
ROBUST QOS CONTROL
FOR IP-BASED CELLULAR NETWORKS
Akihito Okura, Hiroshi Kawakami, Takeshi Ihara, Akira Miura
Network Laboratories, NTT DoCoMo, Yokosuka, Japan
Keywords: proactive control, multipath control, anomaly detection, attractor, linear optimization
Abstract: This paper proposes "Proactive Control and Multipath Control" to realize a robust QoS control system for
IP-based cellular networks. In
these networks, all kinds of traffic will share the same backbone network.
This requires a QoS system that differentiates services according to the required quality. Though DiffServ is
thought to be a promising technique for achieving QoS, a technique that is proof against rapid traffic
changes and an effective path control scheme are not yet available. Our solution is proactive control using
traffic anomaly detection and multipath control using linear optimization. Simulation results show that
proactive control and multipath control improve system performance in terms of throughput and packet loss
when rapid traffic change takes place.
1 INTRODUCTION
It is expected that the ALL-IP network will become
the de-facto platform for the future cellular network,
and so all kinds of real time and non-real time traffic
will share the same backbone network. In cellular
networks, the traffic pattern drastically changes
when certain events occur, such as natural disasters
or fireworks display. This requires a QoS system
that differentiates services according to the required
quality. DiffServ has been proposed by IETF, the
standardization group for Internet technology. When
a packet enters the DiffServ network, the edge router
writes DSCP (DiffServ Code Point) in the IP header.
DSCP is an identifier of the traffic class. In the
router, PHB (Per Hop Behavior), which decides
queue assignment and scheduling, is set as per
DSCP. DiffServ is a scalable and promising
technique because it divides traffic into several
classes as units of priority control. The problem with
DiffServ is that since it only deals with router
internals, it can’t guarantee QoS. There are two
problems that prevent DiffServ from functioning
effectively.
Problem 1 is how to detect rapid traffic change.
Co
nv
entionally in cellular networks, a traffic
anomaly is judged according to a threshold, and
congestion control is begun only after the traffic
exceeds the threshold. This requires a router metric
that mirrors the current traffic situation. After that,
router parameters must be appropriately set. If the
control procedure is begun after the threshold is
exceeded, these procedures might not finish in time
leading to a deterioration in communication quality.
Problem 2 involves path control between routers.
R
out
ing protocols such as Open Shortest Path First
(OSPF) can be used to implement path control. In
OSPF, traffic concentrates on a specific path
because they forward all traffic across the shortest
path (Moy, 1998). The use of label switching like
Multi Protocol Label Switching (MPLS) is also
available, but the initial Label Switching Path (LSP)
of MPLS is the same as that of the other routing
protocols (Davie, 1998). Therefore, an effective
multipath algorithm is needed to realize QoS control
regardless of the forwarding protocol used.
With regard to these two problems, one approach
is to
p
repare in advance router parameters for each
type of congestion. For example, by customizing the
threshold, or preparing paths groups for each type of
congestion, calculations for each traffic situation
become unnecessary. However, because in the
ubiquitous networks of the future, various kinds of
traffic in addition to voice traffic will coexist, it will
be impossible to prepare for every possible traffic
situation. For this reason we must calculate the
router parameters individually for each traffic
situation.
This paper tackles Problem 1 by proposing
pr
oact
ive control which can deal with various kinds
199
Okura A., Kawakami H., Ihara T. and Miura A. (2004).
ROBUST QOS CONTROL FOR IP-BASED CELLULAR NETWORKS.
In Proceedings of the First International Conference on E-Business and Telecommunication Networks, pages 199-206
DOI: 10.5220/0001385601990206
Copyright
c
SciTePress

of traffic situations. For proactive control, we first
describe the details of a traffic anomaly detection
approach that isn’t based on thresholding. Next, we
introduce a control switching method that makes
effective use of traffic anomaly detection. To handle
Problem 2, we propose multipath control which
enables the path control to be based on traffic
classes. As the multipath algorithm, we apply a
linear optimization algorithm to guarantee
optimality.
From the QoS viewpoint, it is said that
distributed control system is not suitable because it
fails to offer traffic quality guarantees. Accordingly,
we chose the centralized control model. We use a
QoS manager that can control the entire network
(Figure 1). Proactive control decides whether control
is necessary or not. When control is necessary,
proactive control sends a message to multipath
control which calculates the optimal path setting to
realize QoS control.
Proactive Control
QoS Manager
Network Devices
Multipath Control
Measure for Traffic Change New Parameter Setting
Figure 1: Architecture
The remainder of the paper is organized as
follows. Section 2 describes proactive control. First
we define the meaning of proactive, and then explain
traffic anomaly detection, which is based on the use
of attractors. In Section3 we propose a QoS aware
multipath algorithm that uses linear optimization.
Computer simulations and result are discussed in
Section4. Section 5 concludes our paper.
2 PROACTIVE CONTROL
2.1 Definition of Proactive Control
In conventional cellular network operation, a certain
control procedure is triggered after the threshold is
exceeded. This operation can be described as
reactive control. The problem of reactivity is the
delay in triggering system responses such as
congestion control. Using a threshold means that the
control procedure is not begun until the traffic
exceeds the threshold. If traffic increases rapidly, the
control procedure may not be completed in time. To
solve this problem, it is natural to lower the
threshold to detect traffic anomalies earlier, but this
causes control overhead because low thresholds are
exceeded far more often.
This problem is caused by the lack of an
approach to cope with traffic anomalies. Thus, our
solution is to define proactive control as a
combination of both local and global traffic anomaly
detection. First we describe traffic anomaly
detection.
2.2 Traffic Anomaly Detection
There are several approaches to detect traffic
anomalies. The methods described are rule-based
approaches, finite state machine models, pattern
matching, and statistical analysis (Thottan, 2003).
The rule-based approach uses an exhaustive
database containing the rules of system behavior to
determine if an anomaly has occurred (Ndousse,
1996). Rule approaches are too slow for real-time
detection and are dependent on prior knowledge
about the anomalous conditions on the network
(Lewis, 1993). Moreover, rule approaches rely
heavily on the expertise of the network manager, and
do not adapt well to an evolving network
environment (Franceshi, 1996).
Anomaly detection using finite state machines
model alarm sequences that occur during and prior
to fault events. A review of such state machine
techniques can be found in (Lazar, 1992) and
(Jakobson, 1992). The difficulty encountered in
using the finite state machine method is that not all
faults can be captured by a finite sequence of alarms
of reasonable length. This may cause the number of
states required to explode as a function of the
number and complexity of faults modeled (Thottan
2003).
Statistical analysis uses the standard sequential
change point detection approach. The source of such
analysis is SNMP MIB data. (Thottan, 1998)
proposed duration filter heuristics to obtain real-time
alarms using MIB variables.
In pattern matching approach, online learning is
used to build a feature map for a given network.
These maps are categorized by time of day, day of
week, and special days, such as weekends and
holidays. The simplest way of making the feature
map is to reproduce the traffic pattern. This map,
however, has a time-axis which means that the
memory capacity increases when the monitoring
interval shortens. As for the change in IP traffic
volume, changes over periods of 1 second or less are
important. In this time scale, it is impractical to
make the map mirror the real traffic.
All four approaches are complementary. So we
can combine these approaches to realize a better
detection system. In this paper, we propose a pattern
matching method which utilizes an attractor (Takens,
1981). An Attractor map is constructed from the
ICETE 2004 - SECURITY AND RELIABILITY IN INFORMATION SYSTEMS AND NETWORKS
200

traffic volume. The traffic volume range is not
influenced by the time scale. Moreover, the
granularity of the traffic-axis is less significant than
that of the time-axis. This means that using only
traffic volume makes the map scalable.
2.3 Attractor Map
The attractor is known as a way of extracting a
feature map from time series data, which is based on
deterministic chaos (Takens, 1981). The attractor
can also be used to map certain linear/non-linear
time series data. If the traffic has some patterns, such
as periodic features, the attractor is created by just
coordinate transformation. For example, to extract
the attractor of traffic data, all that is necessary is to
convert the coordinates of the observation time
series system into the delay coordinate system
equivalents (Packard, 1980).
Attractor space can be represented as a multiple-
dimensional space. We explain attractor
transformation for a two-dimensional space. We
select two points from traffic data. These data are
separated by d. These two points yield one point in
the attractor field (Figure 2). The vertical axis of
attractor represents the traffic volume at time n, and
the horizontal axis is the traffic volume at time n-d.
The whole periodic traffic trace is projected to form
a closed attractor orbit. We utilize this useful
characteristic in proposing the attractor map method.
V(1)
V(2)
Y(t-d)
Y(t)
Y(t)
d
d
t
V(1)
V(2)
Traffic Data Attractor
Coodinate
Transformation
Figure 2: Attractor
First we create an attractor from usual traffic
data and prepare an array of bits that has the same
dimensions as the attractor space. We set those bits
that lie within the attractor orbit as "Normal" and
those bits which do not lie within the attractor as
"Anomaly”. We can detect traffic anomalies by
comparing the attractor map for usual traffic with
that for the current traffic (Figure 3).
Current Traffic Data
Attractor Map
Normal traffic is projected to
"Normal" element
Anomaly traffic is projected to
"Anomaly" element
Figure 3: Usage of Attractor
2.4 Soft Standby
Conventional cellular network control is based on
thresholding. A threshold represents to two things:
anomaly detection and response triggering. The
traffic is recognized as anomalous if it exceeds the
threshold. When the traffic exceeds this threshold,
certain control actions such as congestion control are
initiated. If the threshold is set too low, unnecessary
control actions are triggered. If the threshold is set
too high, the network has insufficient time to react
properly if the traffic increase is rapid. Though the
attractor map enables the detection of anomalous
traffic at an early stage, if congestion control is
triggered at each detection point, the overheads
would be excessive. In this paper, we propose the
control switching method; Soft Standby, which
combines the attractor map with threshold-based
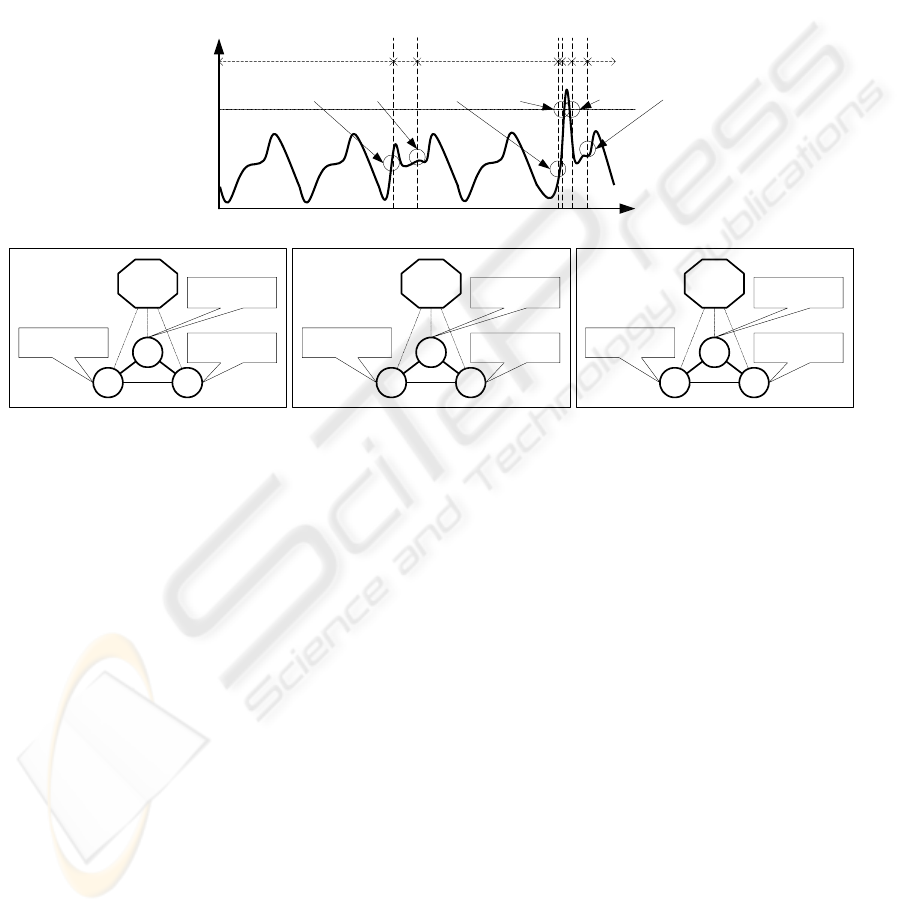
triggering; this is shown inFigure 4. The QoS
manager collects the traffic information and verifies
it using the attractor map. Figure 4 (A) indicates the
state in which the network is normal and each router
is using its default setting. If traffic begins to
increase abnormally and the attractor map detects an
anomaly, the system enters the proactive state Figure
4 (B). In this state, the QoS manager forecasts the
future traffic using linear prediction and calculates
new multipath parameters for each router. Details of
multipath setting are given later. Routers store the
settings but continue to use the default setting. If the
network returns to normal, the system returns to
state Figure 4 (A) and default settings continue to be
used. On the other hand, if the traffic continues to
increase and exceeds the threshold, the system enters
the anomalous state Figure 4 (C). The routers then
activate the new settings; this prevents any quality
deterioration such as packet loss or delay increase.
The conventional method delays the
determination of new parameter settings until the
threshold is exceeded. In our proposal, the new
settings are calculated and loaded when the anomaly
is detected. When the traffic reaches the network
limit, the only control function needed is to activate
the new router parameters and this change can be
ROBUST QOS CONTROL FOR IP-BASED CELLULAR NETWORKS
201
done in a short time. It follows that our proposal
yields faster control response than the conventional
method.
3 MULTIPATH CONTROL
Using proactive control, the QoS manager can deal
with rapid traffic change. The next problem is
calculating the parameter settings. As mentioned
before, current path control is based on singlepath
routing. This causes the traffic to concentrate on the
shortest path. To solve this problem, this chapter
details the multipath control approach.
In conventional networks, the traffic
concentrates on a specific path because existing
routing protocols forward the traffic using shortest
path information. Label switching techniques such
as MPLS do offer a form of multipath control, but
the initial path of MPLS is the same as that of
routing protocols. In an MPLS network, when a
node sends priority traffic, the sender should collect
network information such as topology/path
utilization and calculate the best path using a
constraint-based routing protocol such as CSPF
(Jamoussi, 2002). This calculation is independent in
each node, so optimality is not guaranteed. For
instance, when the low priority traffic dominates the
shortest path, high priority traffic has to make a
detour because the sender of high priority traffic
can't make the sender of low priority traffic accept a
detour route. This sender-based approach can't
realize complete QoS control. Moreover, network
information such as topology and path utilization
can not be sent to end terminals, so sender-based
approaches are not practical. Another approach to
realize QoS label switching is to set up LSPs
beforehand. High priority traffic is allocated to the
shortest paths, and low priority traffic is allocated to
round-about routes. This approach makes the lower
priority traffic take a detour route even if the shortest
path is empty. This degrades communication and
consumes network resources. Therefore, a truly
effective multipath algorithm is needed.
In this paper, we propose a centralize method
which utilizes a linear programming to find optimal
QoS paths group.
QoS
Manager
R
R R
Default Setting
New Setting
Default Setting
New Setting
Default Setting
New Setting
Threshold
Anomaly
Detection
Exceed
Threshold
Back to
Usual
Anomaly
Detection
Below
Threshold
Back to
Usual
QoS
Manager
R
R R
Default Setting
Default Setting
Default Setting
QoS
Manager
R
R R
Default Setting
New Setting
Default Setting
New Setting
Default Setting
New Setting
AB C
B
AAB
A: Normal State B: Proactive State C: Anomalous State
Figure 4: Outline of Soft Standby
3.1 Linear Optimization
The problems that QoS Manager should solve are, a)
can the current path can satisfy the demands of the
current traffic? b) if the current path is sufficient,
how to make the best correspondence between the
paths and traffic classes?, c) if the current path is not
sufficient, how to find the additional path? Problem
a) is equal to a linear problem that verifies whether
the answer that satisfies constraints exists or not.
Problem b) is equal to a linear optimizing problem
which minimizes a certain objective function. In
short, linear programming can be applied to problem
a) and b). Refer to (Press, 2002) for details of linear
programming. In linear programming, the objective
function that should be minimized or maximized is
represented by a linear expression. The constraints
are also composed of linear expressions. The
objective of linear programming is 1) to verify
whether the answer that meets the all constraints
exist, 2) when the answer exists, to find the optimal
variable that minimizes/maximizes the objective
function.
ICETE 2004 - SECURITY AND RELIABILITY IN INFORMATION SYSTEMS AND NETWORKS
202

For N independent variables, minimize the
function
NN
xaxaxaf
0202101
+++= L
(1)
subject to the primary constraints
0,,0,0
21
≥≥≥
N
xxx L
(2)
(
0
2211
≥≤+++
iiNiNii
bbxaxaxa L
)
(3)
0
2211
≥≥+++
jNjNjj
bxaxaxa L
(4)
0
2211
≥=+++
kNkNkk
bxaxaxa L
(5)
xx
a
can have either sign or be zero. A set of
values that satisfies the constraints is called a
feasible vector. The function that we are trying to
minimize is called the objective function. The
feasible vector that minimizes the objective function
is called the optimal feasible vector.
Characteristic 1) is applicable to problem a),
while characteristic 2) is applicable to problem b).
The unsolved problem is problem c). In order to find
the necessity additional path, an understanding of
graph theory is essential.
3.2 Bottleneck Link Detection
We set the traffic amount of each path as the
variable of linear programming. Constraints are
composed of equalities/inequalities concerning the
link bandwidth, traffic amount, delay etc. When a
present path group doesn’t offer enough bandwidth,
there exists a bottleneck link. In this case, at least
one path around the bottleneck is necessary. By
repeating the addition of these necessary paths, we
can get the new path group that satisfies all
constraints. This addition is composed of only
necessary paths, so we can define this as optimal
path addition.
To realize optimal path addition, we first have to
find the bottleneck link first. We take advantage of
the Simplex method, commonly used on linear
programming, to do this.
Imagine that we start with a full N-dimensional
space of candidate vectors. We then eliminate the
regions that are indicated by each constraint. The
area that remains after the elimination is called the
feasible region. If the feasible region doesn’t exist,
there is no feasible vector that satisfies all
constraints. If the feasible vector exists, the optimal
feasible vector should be on the boundary because
the objective function is linear. The simplex method
takes advantage of this characteristic and searches
for the optimal feasible vector along the boundary.
The simplex method is composed of two steps.
First step is the judgment of whether a feasible
vector exists; the second step is to find the optimal
feasible vector. In step 1 we replace our objective
function by a so-called auxiliary objective function
which becomes 0 if the feasible vector exists.
To solve the linear programming problem, we
need to get rid of the inequalities that have form (3)
or (4). We do this by adding to the problem so-called
slack variables;
which, when their
nonnegativity is required, convert the inequalities to
equalities. There is another trick to the auxiliary
objective function. That is the introduction of
artificial variables; we denote them by
.
iN
x
+
i
z
The introduction of slack variables and artificial
variables turns (3) (4) (5) into
iNiiNNiNiii
xcxaxabz
++
−
−
−
−
=
L
11
(6)
Form (6) is not the same as (3) (4) (5). Only
when all
are zero do these forms become the
same. Thus we set (7) as the auxiliary objective
function.
i
z
∑
=
−=
′
M
i
i
Zf
1
(7)
M is the number of constraints.
In step 1, we try to maximize the auxiliary
objective function. If the auxiliary objective function
becomes 0, the feasible vector exists and the next
step begins. If the auxiliary objective function
doesn’t become 0, the simplex method stops and
returns the result that there is no feasible vector.
As previously mentioned, this maximization
process advances along the wall of the constraints.
When the process reaches the vertex, and the
auxiliary objective function has not become 0, there
is no feasible vector that satisfies all constraints. The
coordinate of the vertex represents the answer of the
simultaneous equations used by the process. In other
words, this coordinate means the feasible vector that
satisfies the constraints followed by the simplex
procedure, so this coordinate is the current
maximum traffic volume of each path within the
network limitation. This allows us to find the
bottleneck link by comparing the vector at which the
simplex method stopped with the link bandwidth.
After detecting the bottleneck link, we use Dijkstra's
algorithm, well known as the shortest path algorithm,
to find an additional roundabout path. We
recursively repeat this procedure until we get the
sufficient paths to satisfy the constraints.
3.3 Minimization of Network
Resource Consumption
If the paths are sufficient and the feasible vector
exists, step 2 begins to find the optimal feasible
vector. In our proposal, the objective function
realizes optimality in terms of network resource
consumption.
ROBUST QOS CONTROL FOR IP-BASED CELLULAR NETWORKS
203
l
c
is the cost of each link
l
per traffic unit. The
cost of path
is set as follows
i
p
∑
∈
=
i
i
Pl
lP
CC
(8)
where variable
represents the traffic load of
path
,
i
x
i
p
∑
=
≤
=
1i
ni
iP
xCf
i
(9)
If we can find a feasible vector that satisfies the
constraints and minimizes form (9), it can be said
that the feasible vector is the optimal answer that
minimizes the network resource consumption.
3.4 Scalability Consideration
The practicality of the linear programming method is
not clear. In fact, an attempt to solve for an entire
network may yield a large amount of variables and
constraints. However, the linear programming
formulation can be applied to a uniform topology,
such as a cellular network. Furthermore, the linear
programming method can generate optimal solutions
for small areas of a network, and these local
solutions can be combined to create a global
approximation. And with suitable simplification,
some variables and constraints can be removed.
These considerations above show the applicability of
linear programming to the cellular networks.
4 SIMULATION
We combined our proposals, Proactive Control and
Multipath Control, and evaluated its performance by
computer simulation. To this end we modified
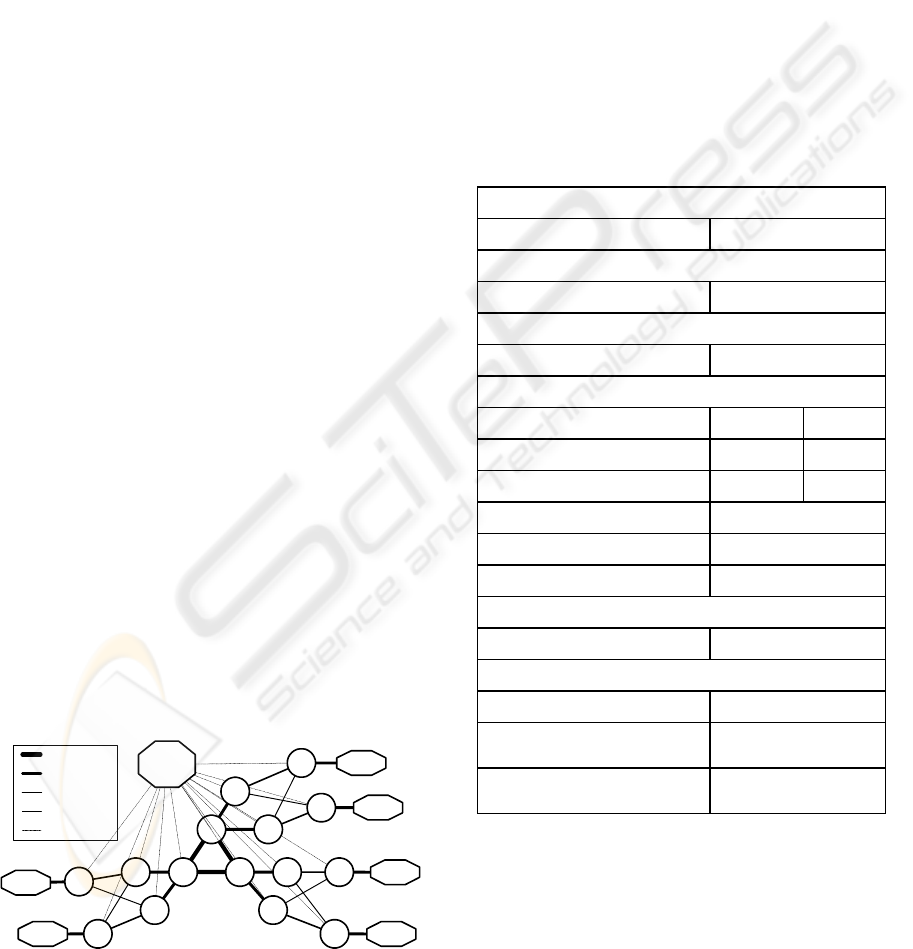
Network Simulator2 (NS2). Figure 5 shows the
simulated topology, which is tree-based structure
typical of cellular and ISP (Internet Service
Provider) networks.
R
AR1
QoS
Manager
R R RR
R
R
R
R
RR
R
R
R
R
AR3
AR4
AR5
AR6
AR2
350Mbps
700Mbps
300Mbps
300Mbps
50Mbps
5msec
5msec
30msec
5msec
5msec
Figure 5: Simulation Topology
The simulation parameters are shown in Table 1.
The communication time was assumed to follow an
exponential distribution; Destination AR was
randomly set. Figure 6 (a) is a graph of usual traffic
for one day. This traffic data was collected from the
statistics database of Ministry of Public
Management, Home Affairs, Posts and
Telecommunications in Japan (Soumu). Figure 6 (b)
image is a sample of the resulting attractor. These
attractors constructed from normal traffic data are
projected to two-dimensional attractor maps (50x50
elements).
We evaluated our proposal in 2 scenarios. For
each scenario, additional traffic is added to usual
traffic. The additional traffic followed a normal
distribution. The parameters were variance
V[minutes] and terminal number N[terminals].
Table 1: Simulation Parameter
Attractor Map
Time Delay [d] 15 minutes
Soft Standby
Threshold 150M
Multipath
Link Cost of all Paths 1
Traffic
Traffic Class Bandwidth Delay
Class1 150Kbps 50msec
Class2 150Kbps -
Class3 Best Effort
Number of Terminals per AR 3000 (1000 per Class)
Traffic of All Classes 150Kbps UDP
QoS Manager
Preparation time of New Param. 30sec
DiffServ Router
Number of Queues 3
Queuing Method
Weighted Fair Queuing
Q1:Q2:Q3=10:5:1
Queue Assignment
Class1/Signaling:Q1
Class2:Q2 Class3:Q3
ICETE 2004 - SECURITY AND RELIABILITY IN INFORMATION SYSTEMS AND NETWORKS
204

(a) Usual Traffic
Throughput (Mbps)
Throughput (Mbps)
Class1
Class2
Class3
0 30 60 90 120 150
30
60
90
120
150
0:00
Throughput (Mbps)
Time
Class1
Class2
Class3
0 4:00 8:00 12:00 16:00 20:00 24:00
30
60
90
120
150
(b) Attractor
Figure 6: Usual Traffic and Attractor
Scenario 1 is the fireworks congestion model.
The feature of the fireworks congestion model is that
the additional traffic follows a wide distribution;
V=135, N=9000. The fireworks event takes place at
17:00. In Scenario 2, the earthquake congestion
model, the additional traffic follows a narrow
disrtibution; V=6, N=6000. The earthquake takes
place at 8:00. Figure 7 plots the ideal throughput of
each scenario.
The events in both scenarios were generated
using AR1. The especially high traces in Figure 7,
which represent the theoretical throughput of AR1,
indicate the traffic concentration. We compared 3
methods. Method 1 is a conventional singlepath
control that doesn’t change the path even when
traffic becomes congested. Method 2 is a
combination of our multipath routing and
conventional reactive control; threshold based
control triggering was used. The threshold is set to
trigger multipath control when link utilization arises
to 80%. Method 3 is our proposal, multipath and
proactive control; anomalous traffic detection was
used. In this method, QoS manager detects a traffic
anomaly using attractor maps and trigger multipath
control when link utilization exceeds 80%.
0:00
Throughput (Mbps)
Time
Class1
Class2
Class3
0
4:00 8:00 12:00 16:00 20:00 24:00
50
100
150
200
250
(b) Earthquake Traffic
0:00
Throughput (Mbps)
Time
Class1
Class2
Class3
0
4:00 8:00 12:00 16:00 20:00 24:00
50
100
150
200
250
(a) Fireworks Traffic
Figure 7: Theoretical Throughput
4.1 Fireworks Scenario
The resulting throughput and packet loss in the
fireworks scenario are shown in Figure 8. The
difference between singlepath and multipath is seen
in the throughput at the traffic peak. The throughput
of Class2 in AR1 is lower than that of Class1. On
the other hand, with multipath control, both Class1
and Class2 keep their guaranteed throughputs and
Class3 throughput is also improved. Moreover
Class3 throughput at AR2 is decreased. This is
because Class2 traffic was detoured and influenced
Class3 traffic in multipath control. In short,
multipath control improved the whole network
throughput and realized QoS control. On the
contrary, there is little difference between reactive
control and proactive control. This is because the
preparation procedure can be finished in time since
the traffic increase is not rapid, unlike earthquake
congestion. In short, in the fireworks scenario,
multipath is better than singlepath but there is little
difference between proactive and reactive.
4.2 Earthquake Scenario
The resulting throughput and packet loss in the
earthquake congestion model are shown in Figure 9.
As in the fireworks scenario, multipath control
offers improved throughput with AR1. In this
scenario, there is a slight difference between reactive
and proactive control when the earthquake occurs.
Throughput (Mbps)
Time
Class1
Class2
Class3
0:00 4:00 8:00 12:00 16:00 20:00 24:00
0
50
100
150
200
250
Throughput (Mbps)
Time
Class1
Class2
Class3
0:00 4:00 8:00 12:00 16:00 20:00 24:00
0
50
100
150
200
250
Throughput (Mbps)
Time
Class1
Class2
Class3
0:00 4:00 8:00 12:00 16:00 20:00 24:00
0
50
100
150
200
250
AR1 Class1
AR1 Class2
AR1 Class3
AR1 Class1
AR1 Class2
AR1 Class3
AR2 Class3
AR1 Class1
AR1 Class2
AR1 Class3
AR2 Class3
(a) Singlepath (b) Multipath & Reactive
(c) Multipath & Proactive
Class1
Class2
Class3
Number of Lost Packets
Singlepath
Multipath
Reactive
Multipath
Proactive
0
2000
4000
6000
8000
10000
12000
14000
16000
18000
20000
(d) Packet Loss
Figure 8: Results of Fireworks Scenario
ROBUST QOS CONTROL FOR IP-BASED CELLULAR NETWORKS
205

Throughput (Mbps)
Time
Class1
Class2
Class3
0:00 4:00 8:00 12:00 16:00 20:00 24:00
0
50
100
150
200
250
Throughput (Mbps)
Time
Class1
Class2
Class3
0:00 4:00 8:00 12:00 16:00 20:00 24:00
0
50
100
150
200
250
Throughput (Mbps)
Time
Class1
Class2
Class3
0:00 4:00 8:00 12:00 16:00 20:00 24:00
0
50
100
150
200
250
AR1 Class1
AR1 Class2
AR1 Class3
AR1 Class1
AR1 Class2
AR1 Class3
AR1 Class1
AR1 Class2
AR1 Class3
Class1
Class2
Class3
Number of Lost Packets
Singlepath Multipath
Reactive
Multipath
Proactive
0
2000
4000
6000
8000
10000
(a) Singlepath (b) Multipath & Reactive
(c) Multipath & Proactive (d) Packet Loss
Figure 9: Results of Earthquake Scenario
The difference is seen in the number of Class2
packets lost. The reason for the difference is the
difference in preparation time. In the proactive
method, the procedure began when the QoS manager
detected the traffic anomaly using agent-initiated
traffic reporting and the attractor map so the
calculation and preparations could be finished before
the traffic exceeded the network limit. On the other
hand, in the reactive method, the QoS manager
didn't detect the rapid traffic change until the next
monitoring period. Since the procedure began after
the traffic exceeded the threshold, it could not be
completed in time, so Class2 packets were lost until
the new settings were established. In short, in the
earthquake scenario, both proactive and multipath
control improved communication quality.
5 CONCLUSION
In this paper, we proposed proactive control and
multipath control to cope with the rapid traffic
change in IP-based cellular networks. Proactive
control is based on traffic anomaly detection via
attractor maps. Proactive control includes a control
triggering method that efficiently switches the
network states. Linear programming is applied to
determine the multipath setting and guarantee
optimality in terms of network resource
consumption.
NS2simulations showed that our multipath
control approach achieved better performance in
terms of throughput and packet loss than
conventional singlepath control. The simulations
also showed that proactive control is especially
effective when the traffic increase is rapid. Proactive
control prevented packet loss in priority traffic class
unlike the conventional reactive control.
REFERENCES
J.T. .Moy, "Anatomy of an Internet Routing Protocol",
Addison-Wesley, January, 1998.
B.S. Davie, Y. Rekhter, "MPLS: Technology and
Applications", Morgan Kaufmann Pub., May, 2000.
M. Thottan, C. Ji, "Anomaly Detection in IP Networks",
IEEE Transactions of signal processing, vol.51, no.8,
August 2003.
T.D. Ndousse and T. Okuda "Computational intelligence
for distributed fault management in networks using
fuzzy cognitive maps", in Proc. IEEE ICC, Dallas, TX,
pp.1558-1562, Jun. 1996.
L. Lewis, "A case based reasoning approach to the
management of faults in communication networks", in
Proc IEEE INFOCOM, vol.3, San Francisco, CA, pp.
1422-1429, March 1993.
A.S. Franceschi, L.F. Kormann, and C.B. Westphall,
"Pefrormance evaluation for proactive network
management", in Proc. IEEE ICC, Dallas, TX, pp. 22-
26, June 1996.
A. Lazar, W. Wang, and R. Deng, "Models and algorithms
for network fault detection and identification: A
review," in Proc. IEEE Int. Contr. Conf., 1992
G. Jakobson and M. D.Weissman, “Alarm correlation,”
IEEE Network, vol. 7, pp. 52–59, Nov. 1993.
M. Thottan and C. Ji, “Proactive anomaly detection using
distributed intelligent agents,” IEEE Network, vol. 12,
pp. 21–27, Sept./Oct. 1998.
Floris Takens. "Detecting strange attractors in turbulence,"
in "Dynamical Systems of Turbulence", Vol.898, of
Lecture Notes in Mathematics, pp.366-381, Berlin,
1981.
N.N. Packard, J.P. Crutchfield, J.D. Farmar, and R.S.
Shaw. "Geometry from a Time Series", Physical
Review Letters, Vol.45, No.9, pp.712-716, September,
1980.
B. Jamoussi, et al, "Constraint-Based LSP Setup using
LDP", RFC3212, January, 2002.
W. H. Press, et al "Numerical Recipes in C++",
Cambridge univ. press, 2002.
NS2, http://www.isi.edu/nsnam/ns/
Soumu, http://www.soumu.go.jp/index.htm
ICETE 2004 - SECURITY AND RELIABILITY IN INFORMATION SYSTEMS AND NETWORKS
206
