AUDIO WATERMARKING QUALITY EVALUATION
Andrés Garay Acevedo
Georgetown University, Washington, DC, USA
Keywords: Audio watermarking, benchmarking, perceptual model.
Abstract: The recent explosion of the Internet as a collaborative medium has opened the door for people who want to
share their work. Nonetheless, the advantages of such an open medium can pose very serious problems for
authors who do not want their works to be distributed without their consent. As new methods for copyright
protection are devised, expectations around them are formed and sometimes improvable claims are made.
This paper covers one such technology: audio watermarking. First, the framework is set for the objective
measurement of such techniques. After this, the remainder of the document proposes a test and a set of
metrics for thorough benchmarking of audio watermarking schemes. The development of such a benchmark
constitutes a first step towards the standardization of the requirements and properties that such systems
should display.
1 INTRODUCTION
A watermarking process can be modeled as a
communication process. In fact, this assumption is
used throughout this paper, as it will prove to be
beneficial at a later stage. A more detailed
description of this model can be found in (Cox,
Miller, & Bloom, 2002).
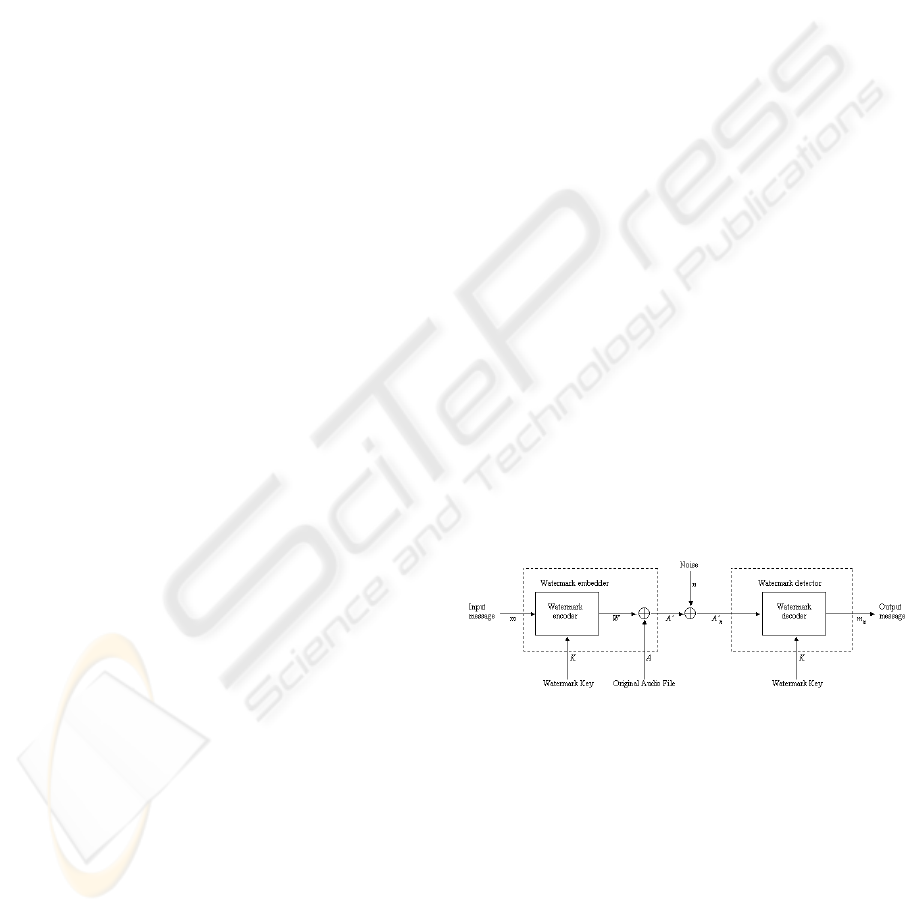
In this framework, watermarking is viewed as a
transmission channel through which the watermark
message is communicated. Here the cover work is
just part of the channel. This is depicted in figure 1,
adapted from (Cox et al., 2002).
The embedding process consists of two steps. First,
the watermark message m is mapped into an added
pattern
1
W
a
, of the same type and dimension as the
cover work A. When watermarking audio, the
watermark encoder produces an audio signal. This
mapping may be done with a watermark key K.
1
This pattern is also known as a pseudo-noise (PN)
sequence. Even though the watermark message and the
PN-sequence are different, it is the later one we refer to
as the watermark W.
Next, W
a
is embedded into the cover work in order
to produce the watermarked audio file A’.
After the pattern is embedded, the audio file is
processed in some way. This is modeled as the
addition of noise to the signal, which yields a noisy
work A’
n
. The types of processing performed on the
work will be discussed later, as they are of no
importance at this moment. However, it is important
to state the presence of noise, as any transmission
medium will certainly induce it.
Figure 1: Watermark communication process.
The watermark detector performs a process that is
dependant on the type of watermarking scheme. If
the decoder is a blind or public decoder, then the
original audio file A is not needed during the
recovery process, and only the key K is used in order
to decode a watermark message m
n
.
Another possibility is for the detector to be
informed. In this case, the original audio cover A
must be extracted from A’
n
in order to yield W
n
,
prior to running the decoding process. In addition, a
confidence measure can be the output of the system,
rather than the watermark message.
290
Garay Acevedo A. (2004).
AUDIO WATERMARKING QUALITY EVALUATION.
In Proceedings of the First International Conference on E-Business and Telecommunication Networks, pages 290-300
DOI: 10.5220/0001387202900300
Copyright
c
SciTePress

In order to measure the quality of a watermarking
scheme, one can perform a different test at several
points of the communication process. In fact, this is
exactly what is proposed on this document. These
points are namely the sending and receiving ends,
and the communication channel. Moreover, at these
points specific actors (with different concerns about
the technology) take part in the process. The rest of
this document addresses these concerns, as it
outlines three specific subtests for evaluating
watermarking systems. Finally, these tests are
combined in order to produce a final watermarking
test score.
2 MEASURING FIDELITY
Artists, and digital content owners in general, have
many reasons for embedding watermarks in their
copyrighted works. These reasons have been stated
on various occasions. However, there is a big risk in
performing such an operation, as the quality of the
musical content might be degraded to a point where
its value is diminished. Fortunately, the opposite is
also possible and, if done right, digital watermarks
can add value to content (Acken, 1998).
Content owners are generally concerned with the
degradation of the cover signal quality, even more
than users of the content (Craver, Yeo, & Yeung,
1998). They have access to the unwatermarked
content with which to compare their audio files.
Moreover, they have to decide between the amount
of tolerance in quality degradation from the
watermarking process and the level of protection
that is achieved by embedding a stronger signal. As
a restriction, an embedded watermark has to be
detectable in order to be valuable.
Given this situation, it becomes necessary to
measure the impact that a marking scheme has on an
audio signal. This is done by measuring the fidelity
of the watermarked audio signal A’.
As fidelity refers to the similitude between an
original and a watermarked signal, a statistical
metric must be used. Such a metric will fall in one of
two categories: difference metrics or correlation
metrics.
Difference metrics, as the name states, measure the
difference between the undistorted original audio
signal A and the distorted watermarked signal A’. In
the case of digital audio, the most common
difference metric used for quality evaluation of
watermarks is the signal to noise ratio (SNR). This is
usually measured in decibels (dB), so SNR(dB) = 10
log
10
(SNR).
The signal to noise ratio, measured in decibels, is
defined by the formula
2
()10log
10
2
(')
A
n
n
SNR dB
AA
nn
n
∑
=
−
∑
,
(1)
where A
n
corresponds to the n
th
sample of the
original audio file A, and A’
n
to the n
th
sample of the
watermarked signal A’. This is a measure of quality
that reflects the quantity of distortion that a
watermark imposes on a signal (Gordy & Burton,
2000).
Another common difference metric is the peak
signal to noise ratio (PSNR), which measures the
maximum signal to noise ratio found on an audio
signal. A description of the PSNR, along with some
other difference metrics found on the literature is
presented on (Kutter & Hartung, 2000; Kutter &
Petitcolas, 1999).
Although the tolerable amount of noise depends on
both the watermarking application and the
characteristics of the unwatermarked audio signal,
one could expect to have perceptible noise distortion
for SNR values of 35dB (Petitcolas & Anderson,
1999).
Correlation metrics measure distortion based on the
statistical correlation between the original and
modified signals. They are not as popular as the
difference distortion metrics, but it is important to
state their existence.
For the purpose of audio watermark benchmarking,
the use of the signal to noise ratio should be used to
measure the fidelity of the watermarked signal with
respect to the original. This decision follows most of
the literature that deals with the topic (Gordy &
Burton, 2000; Kutter & Petitcolas, 1999, 2000;
Petitcolas & Anderson, 1999). Nonetheless, in this
measure the term noise refers to statistical noise, or a
deviation from the original signal, rather than to
perceived noise on the side of the hearer. This result
is due to the fact that the SNR is not well correlated
with the human auditory system (Kutter & Hartung,
2000). Given this characteristic, the effect of
perceptual noise needs to be addressed later.
In addition, when a metric that outputs results in
decibels is used, comparisons are difficult to make,
as the scale is not linear but rather logarithmic. This
means that it is more useful to present the results
using a normalized quality rating. The ITU-R Rec.
500 quality rating is perfectly suited for this task, as
it gives a quality rating on a scale of 1 to 5 (Arnold,
2000; Piron et al., 1999). Table 1 shows the rating
scale, along with the quality level being represented.
AUDIO WATERMARKING QUALITY EVALUATION
291

Table 1: ITU-R Rec. 500 quality rating
Rating Impairment Quality
5 Imperceptible Excellent
4 Perceptible, not annoying Good
3 Slightly annoying Fair
2 Annoying Poor
1 Very annoying Bad
The fidelity of the watermarked signal is computed
by using the formula
5
1*
Fidelity
NSNR
=
+
,
(
2)
where N is a normalization constant and SNR is the
measured signal to noise ratio.
2.1 Data Payload
The fidelity of a watermarked signal depends on the
amount of embedded information, the strength of the
mark, and the characteristics of the host signal. This
means that a comparison between different
algorithms must be made under equal conditions.
That is, while keeping the payload fixed, the fidelity
must be measured on the same audio cover signal for
all watermarking techniques being evaluated.
However, the process just described constitutes a
single measure event and will not be representative
of the characteristics of the algorithms being
evaluated, as results can be biased depending on the
chosen parameters. For this reason, it is important to
perform the tests using a variety of audio signals,
with changing size and nature (Kutter & Petitcolas,
2000). Moreover, the test should also be repeated
using different keys.
The amount of information that should be embedded
is not easy to determine, and depends on the
application of the watermarking scheme. In (Kutter
& Petitcolas, 2000) a message length of 100 bits is
used on their test of image watermarking systems as
a representative value. However, some secure
watermarking protocols might need a bigger payload
value, as the watermark W could include a
cryptographic signature for both the audio file A, and
the watermark message m in order to be more secure
(Katzenbeisser & Veith, 2002). Given this, it is
recommended to use a longer watermark bitstream
for the test, so that a real world scenario is
represented. A watermark size of 128 bits is big
enough to include two 56-bit signatures and a unique
identification number that identifies the owner.
3 MEASURING ROBUSTNESS
Watermarks have to be able to withstand a series of
signal operations that are performed either
intentionally or unintentionally on the cover signal
and that can affect the recovery process. Given this,
watermark designers try to guarantee a minimum
level of robustness against such operations.
Nonetheless, the concept of robustness is ambiguous
most of the time and thus claims about a
watermarking scheme being robust are difficult to
prove due to the lack of testing standards (Craver,
Perrig, & Petitcolas, 2000).
By defining a standard metric for watermark
robustness, one can then assure fairness when
comparing different technologies. It becomes
necessary to create a detailed and thorough test for
measuring the ability that a watermark has to
withstand a set of clearly defined signal operations.
In this section these signal operations are presented,
and a practical measure for robustness is proposed.
3.1 How to Measure
Before defining a metric, it must be stated that one
does not need to erase a watermark in order to
render it useless. It is said that a watermarking
scheme is robust when it is able to withstand a series
of attacks that try to degrade the quality of the
embedded watermark, up to the point where it’s
removed, or its recovery process is unsuccessful.
This means that just by interfering with the detection
process a person can create a successful attack over
the system, even unintentionally.
However, in some cases one can overcome this
characteristic by using error-correcting codes or a
stronger detector (Cox et al., 2002). If an error
correction code is applied to the watermark message,
then it is unnecessary to entirely recover the
watermark W in order to successfully retrieve the
embedded message m. The use of stronger detectors
can also be very helpful in these situations.
Given these two facts, it makes sense to use a metric
that allows for different levels of robustness, instead
of one that only allows for two different states (the
watermark is either robust or not). With this
characteristic in mind, the basic procedure for
measuring robustness is a three-step process, defined
as follows:
For each audio file in a determined test set embed a
random watermark W on the audio signal A, with the
maximum strength possible that doesn’t diminish the
fidelity of the cover below a specified minima
(Petitcolas & Anderson, 1999).
ICETE 2004 - WIRELESS COMMUNICATION SYSTEMS AND NETWORKS
292

Apply a set of relevant signal processing operations
to the watermarked audio signal A’.
Finally, for each audio cover, extract the watermark
W using the corresponding detector and measure the
success of the recovery process.
Some of the early literature considered the recovery
process successful only if the whole watermark
message m was recovered (Petitcolas, 2000;
Petitcolas & Anderson, 1999). This was in fact a
binary robustness metric. However, the use of the
bit-error rate has become common recently (Gordy
& Burton, 2000; Kutter & Hartung, 2000; Kutter &
Petitcolas, 2000), as it allows for a more detailed
scale of values. The bit-error rate (BER) is defined
as the ratio of incorrect extracted bits to the total
number of embedded bits and can be expressed
using the formula
1
0
1, '
100
0, '
l
n
nn
nn
WW
BER
WW
l
−
=
=
=
≠
⎧
⎨
⎩
∑
,
(
3)
where l is the watermark length, W
n
corresponds to
the n
th
bit of the embedded watermark and W’
n
corresponds to the n
th
bit of the recovered
watermark. In other words, this measure of
robustness is the certainty of detection of the
embedded mark (Arnold, 2000).
The three-step procedure just described should be
repeated several times, since the embedded
watermark W is randomly generated and the
recovery can be successful by chance (Petitcolas,
2000).
Up to this point no details have been given about the
signal operations that should be performed in the
second step of the robustness test. These are now
presented.
3.2 Audio Restoration Attack
In audio restoration the recording is digitized and
then analyzed for degradations. After these
degradations have been localized, the corresponding
samples are eliminated. Finally, the missing samples
are recreated by interpolating the signal using the
remaining samples.
One can assume that the audio signal is the product
of a stationary autoregressive (AR) process of finite
order (Petitcolas & Anderson, 1998). With this
assumption in mind, one can use an audio segment
to estimate a set of AR parameters and then calculate
an approximate value for the missing samples. Both
of the estimates are calculated using a least-square
minimization technique.
Using the audio restoration method just described
one can try to render a watermark undetectable by
processing the marked audio signal A’. The process
is as follows: First divide the audio signal A’ into N
blocks of size m samples each. A value of m=1000
samples has been proposed in the literature
(Petitcolas & Anderson, 1999). A block of length l is
removed from the middle of each block and then
restored using the AR audio restoration algorithm.
This generates a reconstructed block also of size m.
After the N blocks have been processed they are
concatenated again, and an audio signal B’ is
produced. It is expected that B’ will be closer to A
than to A’ and thus the watermark detector will not
find any mark in it.
3.3 Invertibility Attack
When resolving ownership cases in court, the
disputing parties can both claim that they have
inserted a valid watermark on the audio file, as it is
sometimes possible to embed multiple marks on a
single cover signal. Clearly, one mark must have
been embedded before the other.
The ownership is resolved when the parties are
asked to show the original work to court. If Alice
has the original audio file A, which has been kept
stored in a safe place, and Mallory has a counterfeit
original file Ã, which has been derived from A, then
Alice can search for her watermark W in Mallory’s
file and will most likely find it. The converse will
not happen, and the case will be resolved (Craver et
al., 2000). However, an attack to this procedure can
be created, and is known as an invertibility attack.
Normally the content owner adds a watermark W to
the audio file A, creating a watermarked audio file
A’=A+W, where the sign “+” denotes the embedding
operation. This file is released to the public, while
the original A and the watermark W are stored in a
safe place. When a suspicious audio file à appears,
the difference
-WAA=
%
%
is computed. This
difference should be equal to W if A’ and à are
equal, and very close to W if à was derived from A’.
In general, a correlation function ƒ(W,
W
%
) is used to
determine the similarity between the watermark W
and the extracted data
W
%
. This function will yield a
value close to 1, if W and
W
%
are similar.
However, Mallory can do the following: she can
subtract (rather than add) a second watermark ŵ
from Alice’s watermarked file A’, using the inverse
of the embedding algorithm. This yields an audio
file  = A’- ŵ = A + W- ŵ, which Mallory can now
claim to be the original audio file, along with ŵ as
the original watermark (Craver, Memon, Yeo, &
Yeung, 1998).
When the two originals are compared in court, Alice
will find that her watermark is present in Mallory’s
audio file, since  – A = W-ŵ is calculated, and ƒ(W-
AUDIO WATERMARKING QUALITY EVALUATION
293

ŵ, W)≈ 1. However, Mallory can show that when A
– Â = ŵ -W is calculated, then ƒ(ŵ -W, ŵ) ≈1 as well.
In other words, Mallory can show that her mark is
also present in Alice’s work, even though Alice has
kept it locked at all times (Craver, Memon, &
Yeung, 1996; Craver, Yeo et al., 1998). A deadlock
is thus created (Craver, Yeo et al., 1998; Pereira,
Voloshynovskiy, Madueño, Marchand-Maillet, &
Pun, 2001).
This attack is a clear example of how one can render
a mark unusable without having to remove it, by
exploiting the invertibility of the watermarking
method. Such an attack can be prevented by using a
non-invertible cryptographic signature in the
watermark W; that is, using a secure watermarking
protocol (Katzenbeisser & Veith, 2002;
Voloshynovskiy, Pereira, Pun, Eggers, & Su, 2001).
3.4 Specific Attack on Echo
Watermarking
The echo watermarking technique (Johnson &
Katzenbeisser, 2000) can be easily “attacked”
simply by detecting the echo and then removing the
delayed signal by inverting the convolution formula
that was used to embed it. However, the problem
consists of detecting the echo without knowing the
original signal and the possible delay values. This
problem is refered to as blind echo cancellation, and
is known to be difficult to solve (Petitcolas,
Anderson, & G., 1998). Nonetheless, a practical
solution to this problem appears to lie in the same
function that is used for echo watermarking
extraction: cepstrum autocorrelation. Cepstrum
analysis, along with a brute force search can be used
together to find the echo signal in the watermarked
audio file A’.
A detailed description of the attack is given by
Craver et al. (Craver et al., 2000), and the idea is as
follows: If we take the power spectrum of A’(t) =
A(t) + αA(t – ∆t), denoted by Φ and then calculate
the logarithm of Φ, the amplitude of the delayed
signal can be augmented using an autocovariance
function over the power spectrum Φ’(ln(Φ)). Once
the amplitude has been increased, then the “hump”
of the signal becomes more visible and the value of
the delay ∆t can be determined (Petitcolas et al.,
1998).
3.5 Collusion Attack
A collusion attack, also known as averaging, is
especially effective against basic fingerprinting
schemes. The basic idea is to take a large number of
watermarked copies of the same audio file, and
average them in order to produce an audio signal
without a detectable mark (Craver et al., 2000;
Kirovski & Malvar, 2001).
Another possible scenario is to have copies of
multiple works that have been embedded with the
same watermark. By averaging the sample values of
the audio signals, one could estimate the value of the
embedded mark, and then try to subtract it from any
of the watermarked works. It has been shown that a
small number (around 10) of different copies are
needed in order to perform a successful collusion
attack (Voloshynovskiy, Pereira, Pun et al., 2001).
An obvious countermeasure to this attack is to
embed more than one mark on each audio cover, and
to make the marks dependant on the characteristics
of the audio file itself (Craver et al., 2000).
3.6 Signal Diminishment Attacks and
Common Processing Operations
Watermarks must be able to survive a series of
signal processing operations that are commonly
performed on the audio cover work, either
intentionally or unintentionally. Any manipulation
of an audio signal can result in a successful removal
of the embedded mark. Furthermore, the availability
of advanced audio editing tools on the Internet, such
as Audacity (Dannenberg & Mazzoni, 2002),
implies that these operations can be performed
without an extensive knowledge of digital signal
processing techniques. The removal of a watermark
by performing one of these operations is known as a
signal diminishment attack, and probably constitutes
the most common attack performed on digital
watermarks (Meerwald & Pereira, 2002).
Given this, a set of the most common signal
operations must be specified, and watermark
resistance to these must be evaluated. Even though
an audio file will most likely not be subject to all the
possible operations, a thorough list is necessary.
Defining which subset of these operations is relevant
for a particular watermarking scheme is a task that
needs to be done; however, this will be addressed
later.
The signal processing operations are classified into
different groups, according to the presentation made
in (Petitcolas et al., 2001). These are:
Dynamics. These operations change the loudness
profile of the audio signal.
Filter. Filters cut off or increase a selected part of
the audio spectrum.
Ambience. These operations try to simulate the
effect of listening to an audio signal on a room.
Conversion. Digital audio files are nowadays subject
to format changes. These changes might induce
ICETE 2004 - WIRELESS COMMUNICATION SYSTEMS AND NETWORKS
294

significant quantization noise, as no conversion is
perfect.
Lossy compression algorithms are becoming
popular, as they reduce the amount of data needed to
represent an audio signal. This can pose a serious
problem to some watermarking schemes, as they
sometimes will hide the watermark exactly in
imperceptible regions.
Noise can be added in order to remove a watermark.
This noise can even be imperceptible, if it is shaped
to match the properties of the cover signal.
Modulation effects like vibrato, chorus, amplitude
modulation and flanging are not common post-
production operations. However, they are included
in most of the audio editing software packages and
thus can be easily used in order to remove a
watermark.
Time stretch and pitch shift. These operations either
change the length of an audio passage without
changing its pitch, or change the pitch without
changing its length in time.
Sample permutations. This group consists of
specialized algorithms for audio manipulation, such
as the attack on echo hiding just presented. Dropping
of some samples in order to misalign the watermark
decoder is also a common attack to spread-spectrum
watermarking techniques.
It is not always clear how much processing a
watermark should be able to withstand. That is, the
specific parameters of the diverse filtering
operations that can be performed on the cover signal
are not easy to determine. In general terms one could
expect a marking scheme to be able to survive
several processing operations up to the point where
they introduce annoying audible effects on the audio
work. However, this rule of thumb is still too vague.
Fortunately, guidelines and minimum requirements
for audio watermarking schemes have been
proposed by different organizations such as the
Secure Digital Music Initiative (SDMI),
International Federation of the Phonographic
Industry (IFPI), and the Japanese Society for Rights
of Authors, Composers and Publishers (JASRAC).
These guidelines constitute the baseline for any
robustness test. In other words, they describe the
minimum processing that an audio watermark
should be able to resist, regardless of their intended
application.
4 MEASURING PERCEPTIBILITY
Digital content consumers are aware of many
aspects of emerging watermarking technologies.
However, only one prevails over all of them: users
are concerned with the appearance of perceptible
(audible) artifacts due to the use of a watermarking
scheme. Watermarks are supposed to be
imperceptible (Cox et al., 2002). Given this fact, one
must carefully measure the amount of distortion that
the listener will perceive on a watermarked audio
file, as compared to its unmarked counterpart; that
is, the perceptibility of the watermark.. Formal
listening tests have been considered the only
relevant method for judging audio quality, as
traditional objective measures such as the signal-to-
noise ratio (SNR) or total-harmonic-distortion
(THD) have never been shown to reliably relate to
the perceived audio quality, as they can not be used
to distinguish inaudible artifacts from audible noise
(ITU, 2001; Kutter & Hartung, 2000; Thiede &
Kabot, 1996). There is a need to adopt an objective
measurement test for perceptibility of audio
watermarking schemes.
4.1 The Human Auditory System
(HAS)
Figure 2, taken from (Robinson & Hawksford,
1999), presents the physiology of the human
auditory system. Each one of its components is now
described.
The pinna directionally filters incoming sounds,
producing a spectral coloration, known as Head
Related Transfer function (or HRTF). This function
enables human listeners to localize the sound source
in three dimensions. The ear canal filters the sound,
attenuating both low and high frequencies. As a
result, a resonance arises around 5 kHz. After this,
small bones known as the timpanic membrane (or
ear drum), malleus and incus transmit the sound
pressure wave through the middle ear. The outer and
middle ear perform a band pass filter operation on
the input signal.
The sound wave arrives at the fluid-filled cochlea, a
coil within the ear that is partially protected by a
bone. Inside the cochlea resides the basilar
membrane (BM), which semi-divides it. The basilar
membrane acts as a spectrum analyzer, as it divides
the signal into frequency components. Each point on
the membrane resonates at a different frequency, and
the spacing of these resonant frequencies along the
BM is almost logarithmic. The effective frequency
selectivity is related to the width of the filter
characteristic at each point.
AUDIO WATERMARKING QUALITY EVALUATION
295

Figure 2: Overview of the Human Auditory System (HAS)
The outer hair cells, distributed along the length of
the BM, react to feedback from the brainstem. They
alter their length to change the resonant properties of
the BM. As a consequence, the frequency response
of the membrane becomes amplitude dependent.
Finally, the inner hair cells of the basilar membrane
fire when the BM moves upward. In doing so, they
transduce the sound wave at each point into a signal
on the auditory nerve. In this way the signal is half
wave rectified. Each cell needs a certain time to
recover between successive firings, so the average
response during a steady tone is lower than at its
onset. This means that the inner hair cells act as an
automatic gain control.
The net result of the process described above is that
an audio signal, which has a relatively wide-
bandwidth, and large dynamic range, is encoded for
transmission along the nerves. Each one of these
nerves offers a much narrower bandwidth, and
limited dynamic range. In addition, a critical process
has happened during these steps. Any information
that is lost due to the transduction process within the
cochlea is not available to the brain. In other words,
the cochlea acts as a lossy coder. The vast majority
of what we cannot hear is attributable to this
transduction process (Robinson & Hawksford,
1999).
4.2 Perceptual Phenomena
As was just stated, one can model the processes that
take place inside the HAS in order to represent how
a listener responds to auditory stimuli. Given its
characteristics, the HAS responds differently
depending on the frequency and loudness of the
input. This means that all components of a
watermark may not be equally perceptible.
Moreover, it also denotes the need of using a
perceptual model to effectively measure the amount
of distortion that is imposed on an audio signal when
a mark is embedded. Given this fact, in this section
the main processes that need to be included on a
perceptual model are presented.
Sensitivity refers to the ear’s response to direct
stimuli. In experiments designed to measure
sensitivity, listeners are presented with isolated
stimuli and their perception of these stimuli is tested.
For example, a common test consists of measuring
the minimum sound intensity required to hear a
particular frequency (Cox et al., 2002). The main
characteristics measured for sensitivity are frequency
and loudness.
The responses of the HAS are frequency dependent;
variations in frequency are perceived as different
tones. Tests show that the ear is most sensitive to
frequencies around 3kHz and that sensitivity
declines at very low (20 Hz) and very high (20 kHz)
frequencies. Regarding loudness, different tests have
been performed to measure sensitivity. As a general
result, one can state that the HAS is able to discern
smaller changes when the average intensity is
louder. In other words, the human ear is more
sensitive to changes in louder signals than in quieter
ones.
The second phenomenon that needs to be taken into
account is masking. A signal that is clearly audible if
presented alone can be completely inaudible in the
presence of another signal, the masker. This effect is
known as masking, and the masked signal is called
the maskee. For example, a tone might become
inaudible in the presence of a second tone at a
nearby frequency that is louder. In other words,
masking is a measure of a listener’s response to one
stimulus in the presence of another.
Two different kinds of masking can occur:
simultaneous masking and temporal masking
(Swanson, Zhu, Tewfik, & Boney, 1998). In
simultaneous masking, both the masker and the
maskee are presented at the same time and are quasi-
stationary (ITU, 2001). In temporal masking, the
masker and the maskee are presented at different
times.
The third effect that has to be considered is pooling.
When multiple frequencies are changed rather than
just one, it is necessary to know how to combine the
ICETE 2004 - WIRELESS COMMUNICATION SYSTEMS AND NETWORKS
296

sensitivity and masking information for each
frequency. Combining the perceptibilities of
separate distortions gives a single estimate for the
overall change in the work. This is known as
pooling.
4.3 ABX Listening Test
Audio quality is usually evaluated by performing a
listening test. In particular, the ABX listening test is
commonly used when evaluating the quality of
watermarked signals. Other tests for audio
watermark quality evaluation, such as the one
described in (Arnold & Schilz, 2002), follow a
similar methodology as well. Given this, it becomes
desirable to create an automatic model that predicts
the response observed from a human listener in such
a procedure.
In an ABX test the listener is presented with three
different audio clips: selection A (non-watermarked
audio), selection B (the watermarked audio) and X
(either A or B), drawn at random. The listener is
then asked to decide if selection X is equal to A or
B. The number of correct answers is the basis to
decide if the watermarked audio is perceptually
different than the original audio and one will,
therefore, declare the watermarking algorithm as
perceptible. In the other case, if the watermarked
audio is perceptually equal to the original audio, the
watermarking algorithm will be declared as
transparent, or imperceptible.
The ABX test is fully described in ITU
Recommendation ITU-R BS.1116, and has been
successfully used for subjective measurement of
impaired audio signals. Normally only one attribute
is used for quality evaluation. It is also defined that
this attribute represents any and all detected
differences between the original signal and the
signal under test. It is known as basic audio quality
(BAQ), and is calculated as the difference between
the grade given to the impaired signal and the grade
given to the original signal. Each one of these grades
uses the five level impairment scale.
Although its results are highly reliable, there are
many problems related to performing an ABX test
for watermark quality evaluation. One of them is the
subjective nature of the test, as the perception
conditions of the listener may vary with time.
Another problem arises form the high costs
associated with the test. These costs include the
setup of audio equipment, construction of a noise-
free listening room, and the costs of employing
individuals with extraordinary acute hearing.
Finally, the time required to perform extensive
testing also poses a problem to this alternative.
Given these facts it becomes desirable to automate
the ABX listening test, and incorporate it into a
perceptual model of the HAS. If this is implemented,
then the task measuring perceptibility can be fully
automated and thus watermarking schemes can be
effectively and thoroughly evaluated. Fortunately,
several perceptual models for audio processing have
been proposed. Specifically, in the field of audio
coding, psychoacoustic models have been
successfully implemented to evaluate the perceptual
quality of coded audio. These models can be used as
a baseline performance tool for measuring the
perceptibility of audio watermarking schemes.
4.4 A Perceptual Model
A perceptual model used for evaluation of
watermarked content must compare the quality of
two different audio signals in a way that is similar to
the ABX listening test. These two signals
correspond to the original audio cover A and the
watermarked audio file A’. An ideal system will
receive both signals as an input, process them
through an auditory model, and compare the
representations given by this model (Thiede et al.,
1998). Finally it will return a score for the
watermarked file A’, in the five level impairment
scale. More importantly, the result of such an
objective test must be highly correlated with those
achieved under a subjective listening test (ITU,
2001).
The auditory model used to process the input signals
will have a similar structure to that of the HAS. In
general terms, the response of each one of the
components of the HAS is modeled by a series of
filters. In particular, a synopsis of the models
proposed in (Robinson & Hawksford, 1999),
(Thiede & Kabot, 1996), (Thiede et al., 1998), and
(ITU, 2001) is now presented.
The filtering performed by the pinna and ear canal is
simulated by an FIR filter, which has been derived
from experiments with a dummy head. More
realistic approaches can use measurements from
human subjects. After this prefiltering, the audio
signal has to be converted to a basilar membrane
representation. That is, the amplitude dependent
response of the basilar membrane needs to be
simulated. In order to do this, the first step consists
of processing the input signal through a bank of
amplitude dependant filters, each one adapted to the
frequency response of a point on the basilar
membrane. The center frequency of each filter
should be linearly spaced on the Bark scale, a
commonly used frequency scale. The actual number
of filters to be used depends on the particular
implementation. Other approaches might use a Fast
Fourier Transform to decompose the signal, but this
creates a tradeoff between temporal and spectral
resolution (Thiede & Kabot, 1996).
AUDIO WATERMARKING QUALITY EVALUATION
297

At each point in the basilar membrane, its movement
is transduced into an electrical signal by the hair
cells. The firing of individual cells is pseudorandom,
but when the individual signals are combined, the
proper motion of the BM is derived. Simulating the
individual response of each hair cell and combining
these responses is a difficult task, so other practical
solutions have to be applied. In particular, (Robinson
& Hawksford, 1999) implements a solution based on
calculating the half wave response of the cells, and
then using a series of feedback loops to simulate the
increased sensitivity of the inner hair cells to the
onset of sounds. Other schemes might just convolve
the signal with a spreading function, to simulate the
dispersion of energy along the basilar membrane,
and then convert the signal back to decibels (ITU,
2001). Independently of the method used, the basilar
membrane representation is obtained at this point.
After a basilar membrane representation has been
obtained for both the original audio signal A, and the
watermarked audio signal A’, the perceived
difference between the two has to be calculated. The
difference between the signals at each frequency
band has to be calculated, and then it must be
determined at what level these differences will
become audible for a human listener (Robinson &
Hawksford, 1999). In the case of the ITU
Recommendation ITU-R BS.1387, this task is done
by calculating a series of model variables, such as
excitation, modulation and loudness patterns, and
using them as an input to an artificial neural network
with one hidden layer (ITU, 2001). In the model
proposed in (Robinson & Hawksford, 1999), this is
done as a summation over time (over an interval of
20 ms) along with weighting of the signal and peak
suppression.
The result of this process is an objective difference
between the two signals. In the case of the ITU
model, the result is given in a negative five level
impairment scale, just like the BAQ, and is known
as the Objective Difference Grade (ODG). For other
models, the difference is given in implementation-
dependant units. In both cases, a mapping or scaling
function, from the model units to the ITU-R. 500
scale, must be used.
For the ITU model, this mapping could be trivial, as
all that is needed is to add a value of 5 to the value
of the ODG. However, a more precise mapping
function could be developed. The ODG has a
resolution of one decimal, and the model was not
specifically designed for the evaluation
watermarking schemes. Given this, a non-linear
mapping (for example using a logarithmic function),
could be more appropriate.
For other systems, determining such a function will
depend on the particular implementation of the
auditory model; nonetheless such a function should
exist, as a correlation between objective and
subjective measures was stated as an initial
requirement. For example, in the case of (Thiede &
Kabot, 1996), a sigmoidal mapping function is used.
Furthermore, the parameters for the mapping
function can be calculated using a control group
consisting of widely available listening test data.
The resulting grade, in the five level scale, is defined
as the perceptibility of the audio watermark. This
means that in order to estimate the perceptibility of
the watermarking scheme, several test runs must be
performed. Again, these test runs should embed a
random mark on a cover signal, and a large and
representative set of audio cover signals must be
used. The perceptibility test score is finally
calculated by averaging the different results obtained
for each one of the individual tests.
5 FINAL BENCHMARK SCORE
In the previous sections three different testing
procedures have been proposed, in order to measure
the fidelity, robustness and perceptibility of a
watermarking scheme. Each one of these tests has
resulted in several scores, some of which may be
more useful than others. These scores have to be
combined in order to obtain a final benchmarking
score. As a result, fair comparison amongst
competing technologies can be possible, as the final
watermarking scheme evaluation score is obtained.
In addition, another issue is addressed at this point:
defining the specific parameters to be used for each
attack while performing the robustness test. While
the different attacks were explained previously, the
strength at which they should be applied was not
specified.
Addressing these two topics can prove to be a
difficult task. Moreover, a single answer might not
be appropriate for every possible watermarking
application. Given this fact, one should develop and
use a set of application-specific evaluation templates
to overcome this restriction. In order to do so, an
evaluation template is defined as a set of guidelines
that specifies the specific parameters to be used for
the different tests performed, and also denotes the
relative importance of each one of the tests
performed on the watermarking scheme. Two
fundamental concepts have been incorporated into
that of evaluation templates: evaluation profiles and
application specific benchmarking.
Evaluation profiles have been proposed in
(Petitcolas, 2000) as a method for testing different
levels of robustness. Their sole purpose is to
establish the set of tests and media to be used when
evaluating a marking algorithm. For example, one
should test a marking scheme intended for
advertisement broadcast monitoring with a set of
ICETE 2004 - WIRELESS COMMUNICATION SYSTEMS AND NETWORKS
298

recordings similar to those that will be used in a real
world situation. There is no point in testing such an
algorithm with a set of high-fidelity musical
recordings. Evaluation profiles are thus a part of the
proposed evaluation templates.
Application specific benchmarking, in turn, is
proposed in (Pereira et al., 2001; Voloshynovskiy,
Pereira, Iquise, & Pun, 2001) and consists of
averaging the results of the different tests performed
to a marking scheme, using a set of weights that is
specific to the intended application of the
watermarking algorithm. In other words, attacks are
weighted as a function of applications (Pereira et al.,
2001). In the specific case of the evaluation
templates proposed in this document, two different
sets of weights should be specified: those used when
measuring one of the three fundamental
characteristics of the algorithm (i.e. fidelity,
robustness and perceptibility); and those used when
combining these measures into a single
benchmarking score.
After the different weights have been established,
the overall watermarking scheme score is calculated
as a simple weighted average, with the formula
***
rr pp
ff
Score w s w s w s=++,
(
4)
where w represents the assigned weight for a test, s
to the score received on a test, and the subscripts f, r,
p denote the fidelity, robustness and perceptibility
tests respectively. In turn, the values of s
f
, s
r
, and s
p
are also determined using a weighted average for the
different measures obtained on the specific subtests.
The use of an evaluation template is a simple, yet
powerful idea. It allows for a fair comparison of
watermarking schemes, and for ease of automated
testing. After these templates have been defined, one
needs only to select the intended application of the
watermarking scheme that is to be evaluated, and the
rest of the operations can be performed
automatically. Nonetheless, time has to be devoted
to the task of carefully defining the set of evaluation
templates for the different applications sought to be
tested.
5.1 Presenting the Results
The main result of the benchmark presented here is
the overall watermarking scheme score that has just
been explained. It corresponds to a single, numerical
result. As a consequence, comparison between
similar schemes is both quick and easy. Having such
a comprehensive quality measure is sufficient in
most cases.
Under some circumstances the intermediate scores
might also be important, as one might want to know
more about the particular characteristics of a
watermarking algorithm, rather than compare it
against others in a general way. For these cases, the
use of graphs, as proposed in (Kutter & Hartung,
2000; Kutter & Petitcolas, 1999, 2000) is
recommended.
The graphs should plot the variance in two different
parameters, with the remaining parameters fixed.
That is, the test setup conditions should remain
constant along different test runs. Finally, several
test runs should be performed, and the results
averaged. As a consequence, a set of variable and
fixed parameters for performing the comparisons are
possible, and thus several graphs can be plotted.
Some of the most useful graphs for this task are
presented in (Kutter & Petitcolas, 1999), along with
their corresponding variables and constants.
6 CONCLUSION
The watermarking benchmark proposed here can be
implemented for the automated evaluation of
different watermarking schemes. In fact, this idea
has been included in test design, and has motivated
some key decisions, such as the use of a
computational model of the ear instead of a formal
listening test. Moreover, the establishment of an
automated test for watermarking systems is an
industry need, as tird-party evaluation of
watermarking schemes seems to be the only
objective solution to the problem transparent
evaluation (Petitcolas, 2000).
As a conclusion, the industry needs to establish a
trusted evaluation authority in order to objectively
evaluate its watermarking products. The
establishment of watermark certification programs
has been proposed, and projects such as the
Certimark and StirMark benchmarks are under
development (Certimark, 2001; Kutter & Petitcolas,
2000; Pereira et al., 2001; Petitcolas et al., 2001).
However, these programs seem to be aimed mainly
at testing of image watermarking systems
(Meerwald & Pereira, 2002). A similar initiative for
audio watermark testing has yet to be proposed.
REFERENCES
Acken, J. M. (1998, July 1998). How watermarking adds
value to digital content.
Communications of the ACM,
41,
75-77.
Arnold, M. (2000).
Audio watermarking: Features,
applications and algorithms.
Paper presented at the
IEEE International Conference on Multimedia and
Expo 2000.
Arnold, M., & Schilz, K. (2002, January 2002).
Quality
evaluation of watermarked audio tracks.
Paper
presented at the Proceedings of the SPIE, Security and
Watermarking of Multimedia Contents IV, San Jose,
CA.
AUDIO WATERMARKING QUALITY EVALUATION
299

Certimark. (2001). Certimark benchmark, metrics &
parameters
(D22). Geneva, Switzerland.
Cox, I. J., Miller, M. L., & Bloom, J. A. (2002).
Digital
Watermarking
(1 ed.). San Francisco: Morgan
Kaufmann.
Craver, S., Memon, N., Yeo, B.-L., & Yeung, M. M.
(1998). Resolving rightful ownerships with invisible
watermarking techniques: Limitations, attacks and
implications.
IEEE Journal on Selected Areas in
Communications, 16
(4), 573-586.
Craver, S., Memon, N., & Yeung, M. M. (1996).
Can
invisible watermarks resolve rightful ownerships?
(RC
20509): IBM Research.
Craver, S., Perrig, A., & Petitcolas, F. A. P. (2000).
Robustness of copyright marking systems. In F. A. P.
Petitcolas & S. Katzenbeisser (Eds.), Information
hiding: Techniques for steganography and digital
watermarking
(1 ed., pp. 149-174). Boston: Artech
House.
Craver, S., Yeo, B.-L., & Yeung, M. M. (1998, July 1998).
Technical trials and legal tribulations.
Communications of the ACM, 41, 45-54.
Dannenberg, R., & Mazzoni, D. (2002). Audacity
(Version 0.98). Pittsburgh, PA.
Gordy, J. D., & Burton, L. T. (2000, August 2000).
Performance evaluation of digital audio watermarking
algorithms.
Paper presented at the 43rd Midwest
Symposium on Circuits and Systems, Lansing, MI.
ITU. (2001). Method for objective measurements of
perceived audio quality
(ITU-R BS.1387). Geneva:
International Telecommunication Union.
Johnson, N. F., & Katzenbeisser, S. C. (2000). A survey of
steganographic techniques. In F. A. P. Petitcolas & S.
Katzenbeisser (Eds.), Information hiding: Techniques
for steganography and digital watermarking
(1 ed.,
pp. 43-78). Boston: Artech House.
Katzenbeisser, S., & Veith, H. (2002, January 2002).
Securing symmetric watermarking schemes against
protocol attacks.
Paper presented at the Proceedings of
the SPIE, Security and Watermarking of Multimedia
Contents IV, San Jose, CA.
Kirovski, D., & Malvar, H. (2001, April 2001).
Robust
cover communication over a public audio channel
using spread spectrum.
Paper presented at the
Information Hiding Workshop, Pittsburgh, PA.
Kutter, M., & Hartung, F. (2000). Introduction to
watermarking techniques. In F. A. P. Petitcolas & S.
Katzenbeisser (Eds.),
Information hiding: Techniques
for steganography and digital watermarking
(1 ed.,
pp. 97-120). Boston: Artech House.
Kutter, M., & Petitcolas, F. A. P. (1999, January 1999).
A
fair benchmark for image watermarking systems.
Paper presented at the Electronic Imaging '99. Security
and Watermarking of Multimedia Contents, San Jose,
CA.
Kutter, M., & Petitcolas, F. A. P. (2000). Fair evaluation
methods for image watermarking systems.
Journal of
Electronic Imaging, 9
(4), 445-455.
Meerwald, P., & Pereira, S. (2002, January 2002).
Attacks,
applications, and evaluation of known watermarking
algorithms with Checkmark.
Paper presented at the
Proceedings of the SPIE, Security and Watermarking
of Multimedia Contents IV, San Jose, CA.
Pereira, S., Voloshynovskiy, S., Madueño, M., Marchand-
Maillet, S., & Pun, T. (2001, April, 2001).
Second
generation benchmarking and application oriented
evaluation.
Paper presented at the Information Hiding
Workshop, Pittsburgh, PA.
Petitcolas, F. A. P. (2000). Watermarking schemes
evaluation.
IEEE Signal Processing, 17(5), 58-64.
Petitcolas, F. A. P., & Anderson, R. J. (1998, September
1998). Weaknesses of copyright marking systems.
Paper presented at the Multimedia and Security
Workshop at the 6th ACM International Multimedia
Conference, Bristol U.K.
Petitcolas, F. A. P., & Anderson, R. J. (1999, June, 1999).
Evaluation of copyright marking systems. Paper
presented at the IEEE Multimedia Systems, Florence,
Italy.
Petitcolas, F. A. P., Anderson, R. J., & G., K. M. (1998,
April 1998).
Attacks on copyright marking systems.
Paper presented at the Second workshop on
information hiding, Portland, OR.
Petitcolas, F. A. P., Steinebach, M., Raynal, F., Dittmann,
J., Fontaine, C., & Fatès, N. (2001, January 22-26).
A
public automated web-based evaluation service for
watermarking schemes: StirMark Benchmark.
Paper
presented at the Electronic Imaging 2001, Security and
Watermarking of Multimedia Contents, San Jose, CA.
Piron, L., Arnold, M., Kutter, M., Funk, W., Boucqueau, J.
M., & Craven, F. (1999, January, 1999).
OCTALIS
benchmarking : Comparison of four watermarking
techniques.
Paper presented at the Proceedings of
SPIE: Security and Watermarking of Multimedia
Contents, San Jose, CA.
Robinson, D. J. M., & Hawksford, M. J. (1999, September
1999).
Time-domain auditory model for the
assessment of high-quality coded audio.
Paper
presented at the 107th Conference f the Audio
Engineering Society, New York, NY.
Swanson, M. D., Zhu, B., Tewfik, A. H., & Boney, L.
(1998). Robust audio watermarking using perceptual
masking.
Signal Processing, 66(3), 337-355.
Thiede, T., & Kabot, E. (1996, 1996).
A new perceptual
quality measure for bit rate reduced audio.
Paper
presented at the 100th AES Convention, Copenhagen,
Denmark.
Thiede, T., Treurniet, W. C., Bitto, R., Sporer, T.,
Brandenburg, K., Schmidmer, C., Keyhl, K., G., B. J.,
Colomes, C., Stoll, G., & Feiten, B. (1998, 1999).
PEAQ - der künftige ITU-Standard zur objektiven
messung der wahrgenommenen audioqualität.
Paper
presented at the Tonmeistertagung Karlsruhe, Munich,
Germany.
Voloshynovskiy, S., Pereira, S., Iquise, V., & Pun, T.
(2001, June 2001). Attack modelling: towards a
second generation benchmark.
Paper presented at the
Signal Processing.
Voloshynovskiy, S., Pereira, S., Pun, T., Eggers, J. J., &
Su, J. K. (2001, August, 2001). Attacks on digital
watermarks: Classification, estimation-based attacks
and benchmarks.
IEEE Communications Magazine,
39,
118-127.
ICETE 2004 - WIRELESS COMMUNICATION SYSTEMS AND NETWORKS
300
