
A METHOD OF IDENTIFYING TRANSFER FUNCTION FOR
NETWORK BY USE OF M-SEQUENCE CORRELATION
Eiji NISHIYAMA and Kenshi KUWANAMI
Department of Information and Communication, Kumamoto National College of Technology,
Suya 2659-2, Nishigoshi-cho, Kumamoto, 861-1102, Japan
Keywords: Internet services, Dial-up networking
Abstract: Monitoring a communication line is significant for broadband
, mobile phone and so on. In this paper, we
propose a new method for detecting a fault point of communication line by use of M-sequence correlation
technique. In this method, detecting signal is used as one or plural M-sequences ( same characteristic
polynomial, including normal and reverse mark, synchronized ). At receiving tap, we make same sequence
with the input one and take crosscorrelation function between M-sequence and the received signal. We can
get transfer functions of plural paths between inputs and a output tap separated from different of delay times
on the crosscorrelation function, and from these transfer functions, so fault point is occurred when we
compare them.
1 INTRODUCTION
Communication network which is used in telephone,
broadband, LAN and so on requires to maintain
completely and quickly. A communication agency is
supervising telephone, CATV or radio-wave lines
and so on.
In case of that a person wants to use internet, the
pers
on use dial up, ADSL and FTTH. He lived in
old style building, it has connected optical FTTH
line on the gateway of the building and branches the
line for many user and use the old style telephone
line, VDSL or ADSL in the building as it was.
It has a cost advantage that it is not necess
ary to
be laid a new (metal or fiber) line. In general, the
metal lines of old building or cables in a city are
very complex. It has short cut open or down cause of
secular progress, flood and animals. It is very hard
work for agency or the building owner to investigate
finding the fault point of the lines.
In this paper, we proposed a new method for
su
pervisory of communication line using M-
sequences and a correlation technique. That is the
M-sequence are put at one or several input points.
And we take crosscorrelation function between same
M-sequence and received signal, on the function,
there exists some peak appeared points shifted and
figured depend on path length and transfer function
from input(s) to receiving point. We compare the
parameter originated from the crosscorrelation
function when fault occurred with in usual time.
2 PRINCIPLE OF
MEASUREMENT
We will describe the fundamental method for
finding the fault point of network by using M-
sequence.
2.1 Measurement of transit function
of path
Let us assume a Communication network which has
one input and output tap line, respectively as shown
in Fig.1. And the transit function between input a
and output b is defined by g
ab
, so the output signal
appears as
146
Nishiyama E. and Kuwanami K. (2004).
A METHOD OF IDENTIFYING TRANSFER FUNCTION FOR NETWORK BY USE OF M-SEQUENCE CORRELATION.
In Proceedings of the First International Conference on E-Business and Telecommunication Networks, pages 146-151
DOI: 10.5220/0001388201460151
Copyright
c
SciTePress

where k
ab
indicated an arriving time from a to b
and (*) is indicated by convolution integral of g
ab
and u(t-k
ab
).
We use M-sequence as input u(t), and take
crosscorrelation function between g
ab
and u(t-k
ab
), so
the function can be written by
{Note, in this paper; we assumed a reflective wave
would not be appeared.}
Here, n is defined by shift time and is
delta function which appears at k
ab
shift time on the
crosscorrelation function. Simultaneously, the transit
function can be estimated start at k
ab
on the
crosscorrelation function.
2.2 Measurement of transit functions
of plural paths
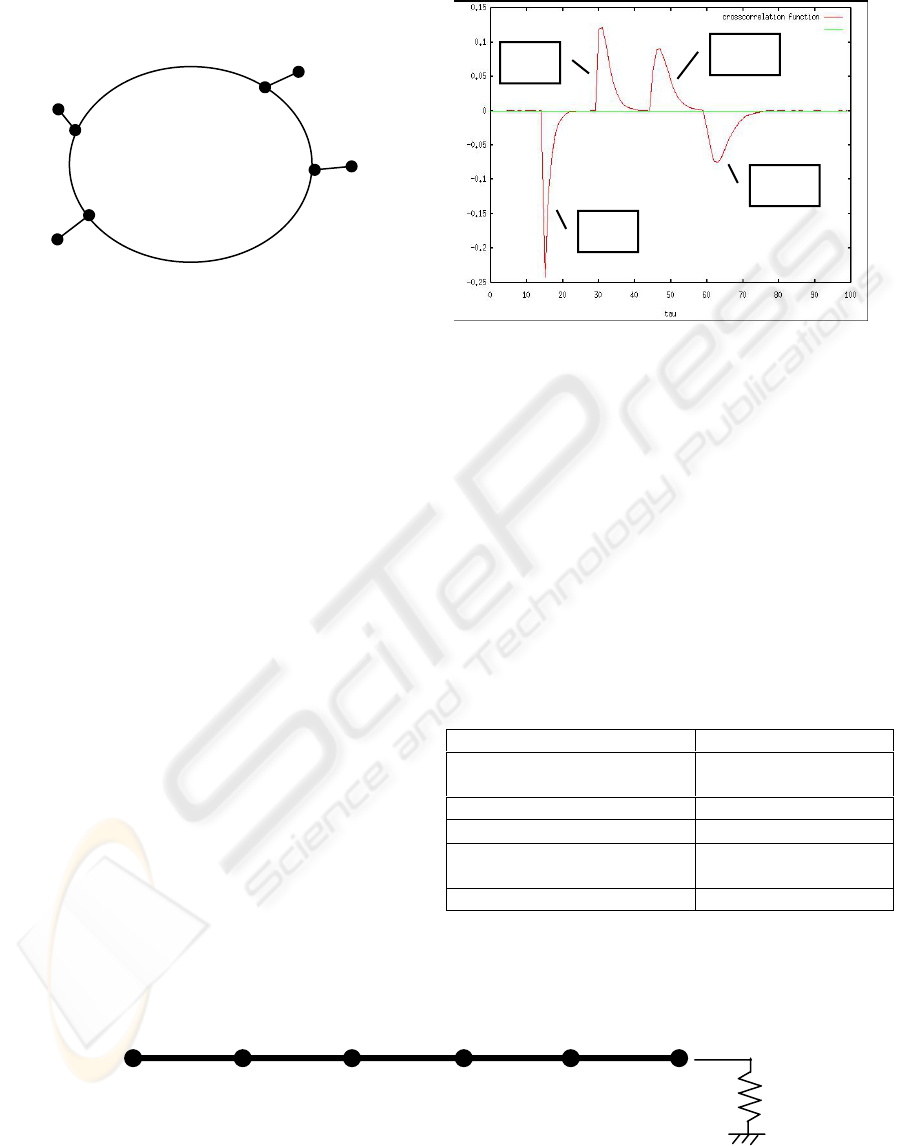
As same consideration with former sub-section, we
define a simple network circuit as shown in Fig. 2. It
has 4 taps such as a, b, c, and d, and they are set far
places each other. a, b is assumed signal as input,
and c, d are set receiving taps, respectively. Then
output signal y
c
(t) is displayed as
Here, g
abc
and k
abc
are transfer function and delay
time of the paths of a-b-c and a-d-c, respectively,
note that g
abc
, g
bc
, g
badc
, k
abc
, k
bc
and k
badc
also have to
be named.
If u
b
would be used same M-sequence with u
a,
, thus,
the crosscorrelation function via a and c taps is
indicated by
)1)(*
)()()(
abab
abab
ktug
dktugty
−=
−−=
∫
τττ
)4.)(*)(*
)(*)(*)(
badcbadcbcbc
adcadcabcabcac
kngkng
kngkngn
−+−+
−+
−
=
δδ
δ
δ
φ
We see in Equation 4), each term of this equation
has to be overlapped. It is a reason that the M-
sequence clock speed is too late comparison with the
light speed, so almost correlation function have
overlapped. In general, we can not analyze the
transfer functions from plural input system in this
method.
)2)(*)( nkgn
ababab
−=
δ
φ
In order to get each functions, this is the idea of
the study, we use b shift of u
a
in u
b
which satisfies
enough delay compare with transfer time of via a to
b.
y
b
(t)
u(
t
)
At this time, the crosscorrelation function via a to c
is calculated by
a
b
)5.)(*)(*
)(*)(*)(
badcbadcbcbc
adcadcabcabcac
kbngkbng
kngkngn
−−+−−+
−
+
−
=
δδ
δ
δ
φ
Figure 1: One input and output line
Then, this crosscorrelation function can show all
of path information from a to b.
Additionally, in general, in order to easy
understanding, shift b should be used delay time
comparison with u
a
, and u
b
also used reverse mark of
u
a
.
3 COMPUTER SIMULATION
3.1 Target circuit and M-sequence
We tried a theoretical simulation to confirm
effectiveness of the proposed method. Fig. 2 shows
an example network circuit. Here a and b are
defined input taps, and c and d are signal receiving
taps, respectively. Transfer functions of path a-b, b-
c, c-d are assumed,
,respectively, and path d-a is
( nk
ab
−
δ
)
)3.)(*)(*
)(*)(*)(
badcabadcbcabc
adcaadcabcaabcc
knugknug
knugknugny
−+−+
−
+−=
)6
31
1
)()()(
s
ggg
cdbcab
+
===
τττ
)7.
31
1
31
1
)(
s
s
g
da
+
•
+
=
τ
A METHOD OF IDENTIFYING TRANSFER FUNCTION FOR NETWORK BY USE OF M-SEQUENCE
CORRELATION
147
And, transfer delays are
n=14 for k
ab
= k
bc
= k
cd
8)
n=28 for k
da
9)
We use 10 degree M-sequence having characteristic
polynomial (x
10
+x
8
+x
5
+x
2
+1=0) as u
a
(t) and u
b
(t).
3.2 Crosscorrelation function
Figure 3 indicates crosscorrelation function between
u
a
(t) and y
c
(t). There exists much information of the
each path. The first peak has minus correlation, and
n is the smallest delay shift, and this amplitude is
also the largest and this peak figures shape, therefore,
the first peak is originated input u
a
(t) and b-c by
these reasons. The second (n=28) one has plus peak
and larger from the third peak (n=42), we can
estimate that transferring path is a-b-c and input
u
a
(t). And it has also third (+ correlation, n=42,
originated from u
a
(t), path a-d-c) and fourth (-
correlation, n=54, from u
b
(t), path b-d-c).
4. EXPERIMENT
We tried to confirm to the theory and computer
simulation, then we carried out the four practical
simulations using shield line, one is Loop type and
the other hand is 3 kinds of Y-connect type circuits.
The property of this circuit is shown Table 1. In
order to be accuracy measuring, M-sequence is used
12 degree (length is 2
12
-1=4095), and it clock
frequency (chip speed) is selected by 2MHz (shield
line property, it has LPF characteristics, it can not be
passed upper of this frequency).
Table 1: Property of shield line simulation
M-sequence f
(x)
=x
12
+x
6
+x
4
+x+1
Clock frequency
(chip speed)
2MHz
Shield line impedance 75 ohm
Input voltage 8Vpp
Result of unit of y axis
(Fig.6)
0.5micro second
u
b
(t) u
a
(t-50T)
u
b
(t) y
c
(t)
u
a
(t)
Figure 2: A network having 2 inputs
g
adc
g
ac
b c
d
a
g
bdc
g
bc
Figure 3: Crosscorrelation between u
a
(t) and y
c
(t)
u
y
b
y
c
y
d
y
e
y
f
a b c d e f R
L
Figure 5: Line segment type of shield line
ICETE 2004 - SECURITY AND RELIABILITY IN INFORMATION SYSTEMS AND NETWORKS
148
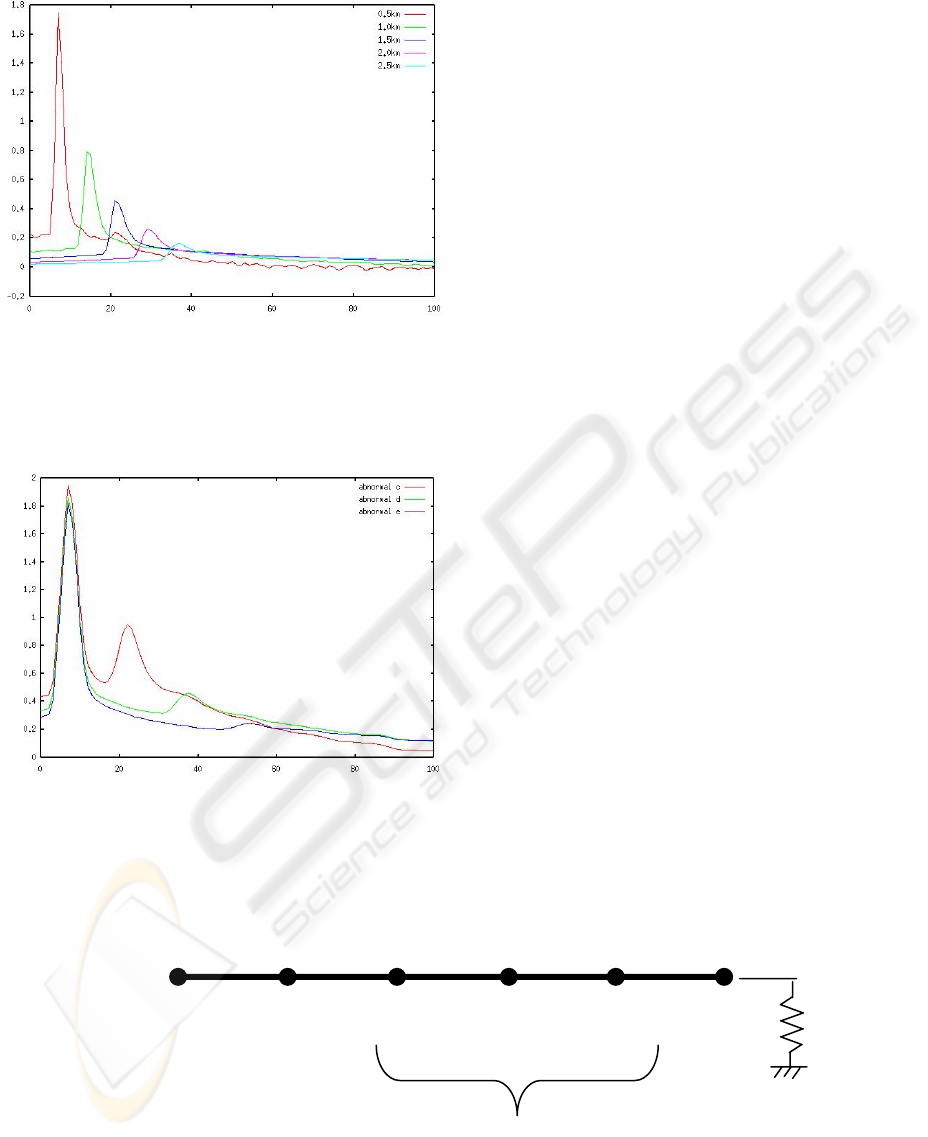
4.1 Line Segment type
Figure 5 shows line segment type circuit, distance
between each tap (a-b, b-c,…., e-f) is 0.5km. The
shift time is 10micro second in 20 shift time.
0.5 k
m
1.0 km
1.5 km
2.0 km
2.5 km
Figure 6: Crosscorrelation of line segment
The crosscorrelation function between taps (a-b,
a-c, a-d,..) can be drawn in Fig. 6,. The peak of each
tap can be occurred in this figure. The peak will be
proportional apart from shift 0 comply with distance.
And the figure of peak will be sharply according
reverse of distance. Here we can not see reflective
peak in order to be set the resistor same as
characteristics resistance of the shield cable.
Figure 7 shows Crosscorrelation of line segment
with reflective waves (without resistor), so you can
see the reflective peak in the largest one at 20 shift
time. We can estimate the wave come from
neighbour tap of b.
4.2 Line segment type with cut point
Figure 8 shows Line segment type and it has one cut
point, the input stimulate in a and output signal will
be received in b when the accident ( cut at c, d, or f ).
In order to avoid of reflecting wave, so resistor is set.
a-b
a-c
a-d
a-e
Figure 7: Crosscorrelation of line segment with
reflective waves (without resistor)
Figure 9 shows crosscorrelation function between
tap a and b, in this figure, the first peak of each wave
are same shift time and absolute caused of direct
distance of a to b.
Cut point in c, we can see the reflecting wave
came from 23-7=16 from the point.
Cut point in d, we estimate approximate twice shift
time 38-7=31 comparison cut point c.
Cut point in e, as same approximate 3
rd
time 55-
7=48.
We consider that the peak of reflecting wave is
appeared in the time shift proportioned with the
distance.
y
u
a edc
b
f
Cut point (only one point)
Figure 8: Line segment type with cut point
A METHOD OF IDENTIFYING TRANSFER FUNCTION FOR NETWORK BY USE OF M-SEQUENCE
CORRELATION
149
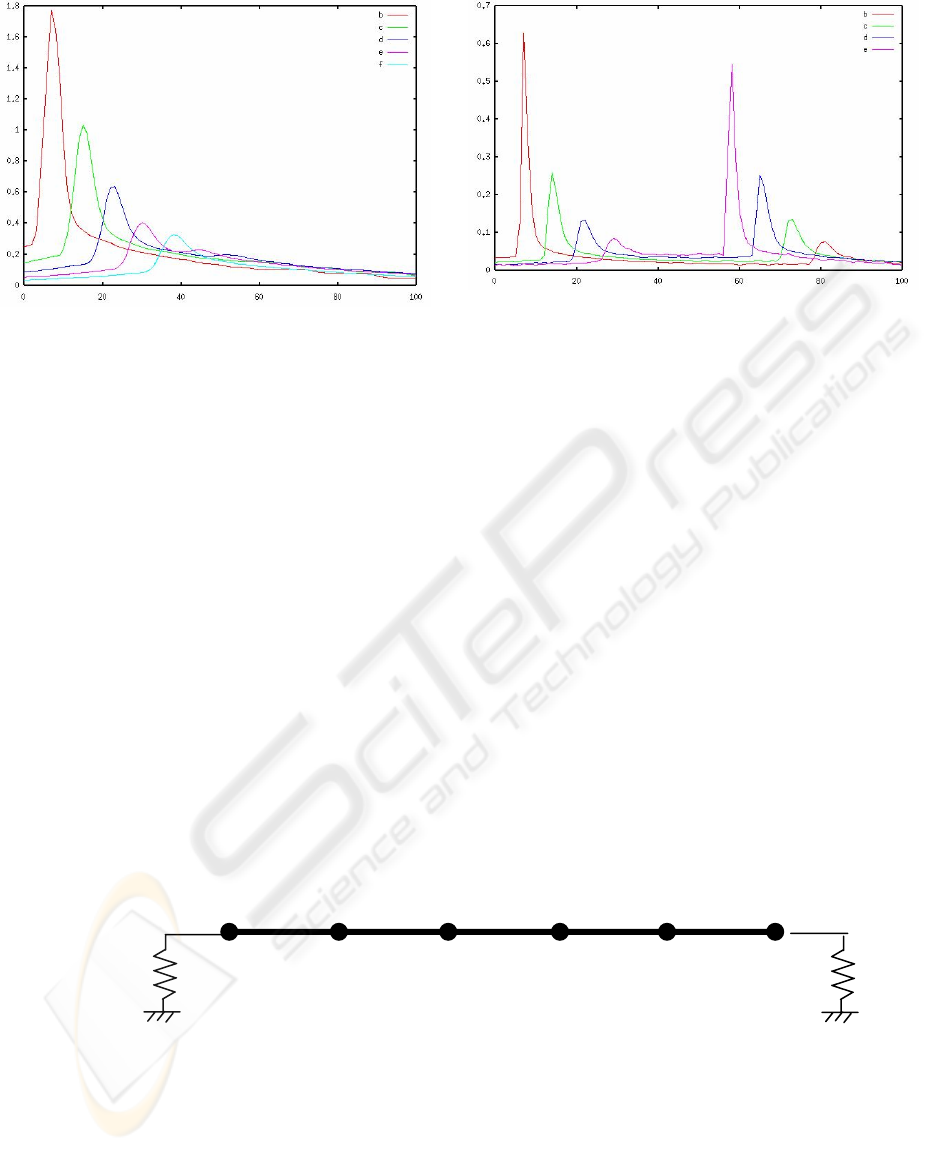
4.3 Line segment type with 2 inputs
Figure 10 shows line segment type with 2 inputs
circuit. We input 2 stimulates at a and f 50 shifted
by a. and receiving wave is gotten at b,c,d,e or f.
Figure 11 shows crosscorrelation function of line
segment type with 2 inputs circuit. It is easy to
understand to see the information, the wave which
has first peak is obtained in tap b. it is the nearest
from a and farthest point from f, therefore it has
largest at 7 and smallest peak at 80 shift point. Also
the second arrived peak has second and second
smallest peaks.
So, we will able to estimate direction and distance, if
we stimulate 2 M-sequences for one circuit.
b
c
d
e f
Figure 9: Crosscorrelation of line segment Line with
cut point
b e
c d
d e c b
Figure 11: Crosscorrelation of line segment
type with cut point
4.4 Loop circuit of shield line
Figure 12 shows Loop circuit the shield line
simulation. Distance between a-b and b-c is set also
0.5km and a-c is 1.5km, respectively. Here, we use
u
b
=–u
a
(t-50T).
The crosscorrelation function signal between a and c
is shown as Figure 13. In this figure, first and second
peak ( appeared at 16 and 22 ) came from a tap via
upper path and lower path, respectively. Third and
forth peak came from b tap via upper and lower path,
respectively. The third peak is larger than first and
second peak. The nearest point from receiving point
is c. The transfer time to c of upper path of b is the
fastest, however, it appears shift time at the shift M-
sequence shift delay plus differential phase 50.
u(
t
)
u(
t
-50
T
) y
c
y
d
y
e
y
b
ae
b
c d
f
Figure 10: Line segment type with 2 inputs
ICETE 2004 - SECURITY AND RELIABILITY IN INFORMATION SYSTEMS AND NETWORKS
150
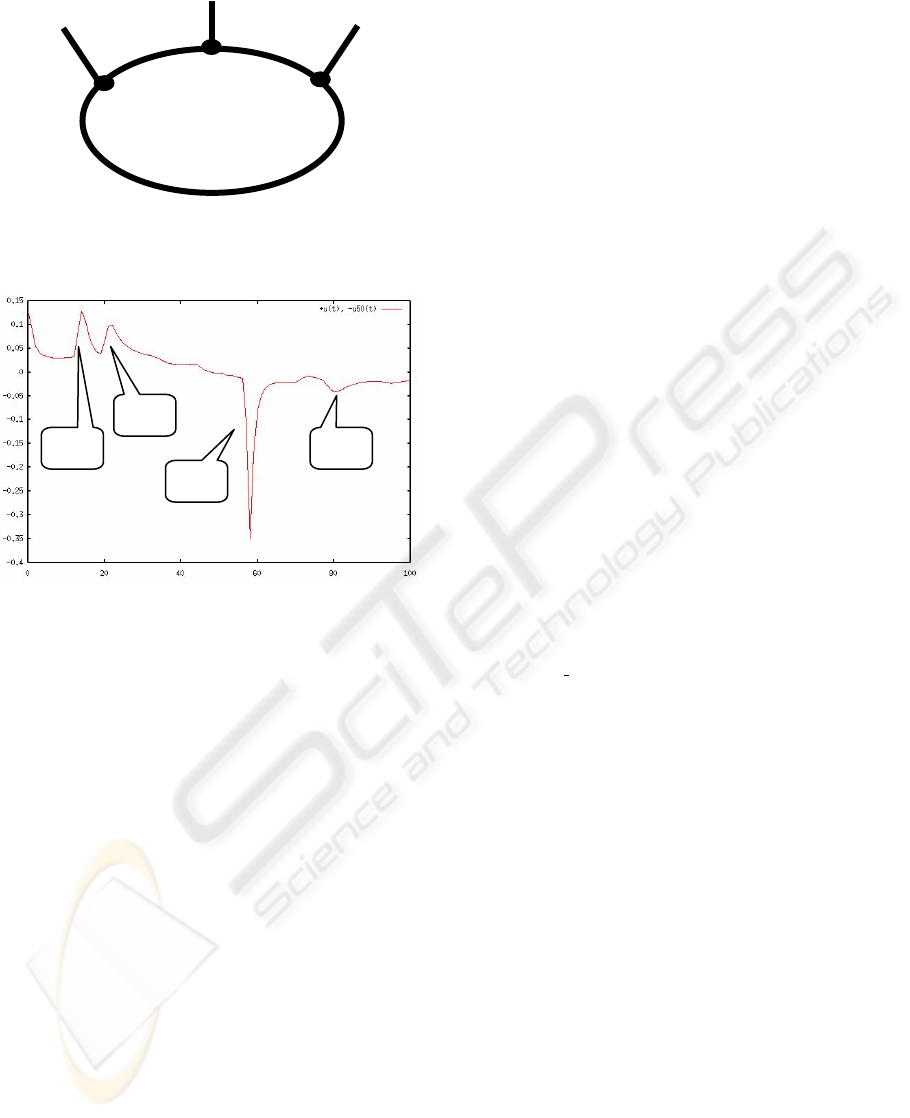
Figure 13: A result of loop type
5 CONCLUSIONS
u
b
u
a
y
0.5km 0.5km
1.5km
Figure 12: Loop type
We proposed a new method for identification of
transfer function of line and network is used
communication lines. In this method we input an or
plural M-sequence(s) which is a kind of pseudo-
random sequence and get receiving signal after
flowing networks. And the crosscorrelation function
between M-sequence and receiving signal is
calculated. So we get the transfer function depend on
the paths of input and receiving taps.
We carried out computer simulations and
experiments to confirm the effectiveness of the
method. The results of the simulations and
experiments, we can identify the transfer functions
which are matched with theoretical consideration.
2nd
REFERENCES
1s
t
4th
E. Nishiyama and K. Kuwanami : “Fault Detection for
Power Transmission Line by Use of M-sequence
Correlation” Proc. IEEE/PES Transmission and
Distribution Conference and Exhibition 2002: Asia
Pacific held in Yokohama, Japan, ,pp.465-469 (2002).
1s
t
E. Nishiyama, K. Owakii, and K. Kuwanami: “ Fault
Detection for Network by use of Plural M-sequences”,
Proc. ICCAS 2002 held in Jeonbuk, Korea, pp. 1339-
1342 (2002).
E. Nishiyama
and K. Kuwanami: “Presentation of a Fault
detecting Method for Power Transmission Line using
M-sequence”, Proc. ICCAS held in Cheju, Korea,
pp.533-535 (2001).
Kashiwagi, “M-sequence and its application,” shokodo,
Japan, 1996.
IEE, “ Electrical Engineering Handbook, “ IEE 1986.
A METHOD OF IDENTIFYING TRANSFER FUNCTION FOR NETWORK BY USE OF M-SEQUENCE
CORRELATION
151
