
BER PERFORMANCE SIMULATION IN LOS ENVIRONMENT
FOR FIXED BROADBAND WIRELESS ACCESS SYSTEM
Tang Min Keen , Tharek Abdul Rahman
Wireless Communication Centre, Faculty of Electrical Engineering,
Universiti Teknologi Malaysia, 81310 UTM Skudai, Johor, Malaysia
Keywords: BER performance, Channel modelling, Fixed Broadband Wireless Access
Abstract: This paper presents a straightforward bit error rate (BER) performance simulation methodology that can be
readily used for FBWA system with environment effects being taken into consideration. This work begins
with physical layer modelling of a current market available fixed broadband wireless access (FBWA)
system.Then, with the eight modelled line of sight (LOS) channels obtained from prediction and
measurement, BER performance of the system in the related environment is simulated. The FBWA system
is a high performance and high-speed wireless Ethernet bridge terminal, which operates in the Unlicensed
National Information Infrastructure (UNII) band of 5.8 GHz with orthogonal frequency division
multiplexing (OFDM) wireless transmission. Tests and verifications have been carried out in the simulation
tools in order to ensure the modelled system is conforming the standard and specifications of the actual
system. With the physical layer system template and the channel models that represent the real environment,
the BER computations are obtained
1 INTRODUCTION
Wireless local area networks (WLAN) supporting
broadband multimedia communication are being
developed and standardized around the world. IEEE
802.11a is one of the standards that provides an
internationally accepted standard defining
independent PHY and MAC layers at UNII
frequency band of 5 GHz. As mandated by Federal
Communications Commission (FCC), the IEEE
802.11a is applying to lower band (5.15-5.25 GHz)
for indoor applications, middle band (5.25-5.35GHz)
for indoor or outdoor applications and upper band
(5.725-5.825 GHz) for outdoor applications. Here,
the modelled FBWA system operates in the upper
band that is designed for outdoor point to point
application. It meets the standard requirements for
IEEE 802.11a.
The terminology, quality targets and
methodologies to be used in the planning of fixed
wireless systems are defined in F-series of the radio
communication sector of the International
Telecommunication Union (ITU-R)
recommendations. BER is one of the quality
parameters, which is used to define the performance
and range of radio systems. (Clark, 2000) Hence, to
know the performance range of the system used, the
system is modeled and simulated using a powerful
simulation software tool.
This paper is organized as follows: Firstly, a brief
description and results of transmitter tests that
include spectrum mask, error vector magnitude and
relative constellation error test are presented. This is
followed by receiver sensitivity level, adjacent and
alternate channel rejection test to confirm the
modelled receiver with related standard and
specifications. Then, a short summary about the
eight LOS channel models is explained in Section
IV. Finally, the results of physical layer software
simulation are given in the form of bit error rate
(BER) versus energy per bit to noise ratio (E
b
/N
0
)
and discussed before this paper is concluded.
2 TRANSMITTER TEST
According to FCC regulations as stated in (IEEE
802.11a, 1999) section 17.3.9.1, the maximum
allowable output power is 40 mW (50 mW/MHz)
with up to 6dBi antenna gain. Though the maximum
power level is depending on the standard, the
166
Min Keen T. and Abdul Rahman T. (2004).
BER PERFORMANCE SIMULATION IN LOS ENVIRONMENT FOR FIXED BROADBAND WIRELESS ACCESS SYSTEM.
In Proceedings of the First International Conference on E-Business and Telecommunication Networks, pages 166-171
DOI: 10.5220/0001392701660171
Copyright
c
SciTePress
software of the system will determine the actual
power. The system has different actual transmit
power permitted for each channel according to the
modulation scheme. Yet, the defined value is lower
than the maximum allowable values by the relevant
standard. To achieve higher radiated power that is
allowed by the standard, a high gain directional
antenna will be used. In the software tool, the
maximum transmit power for the system is set.
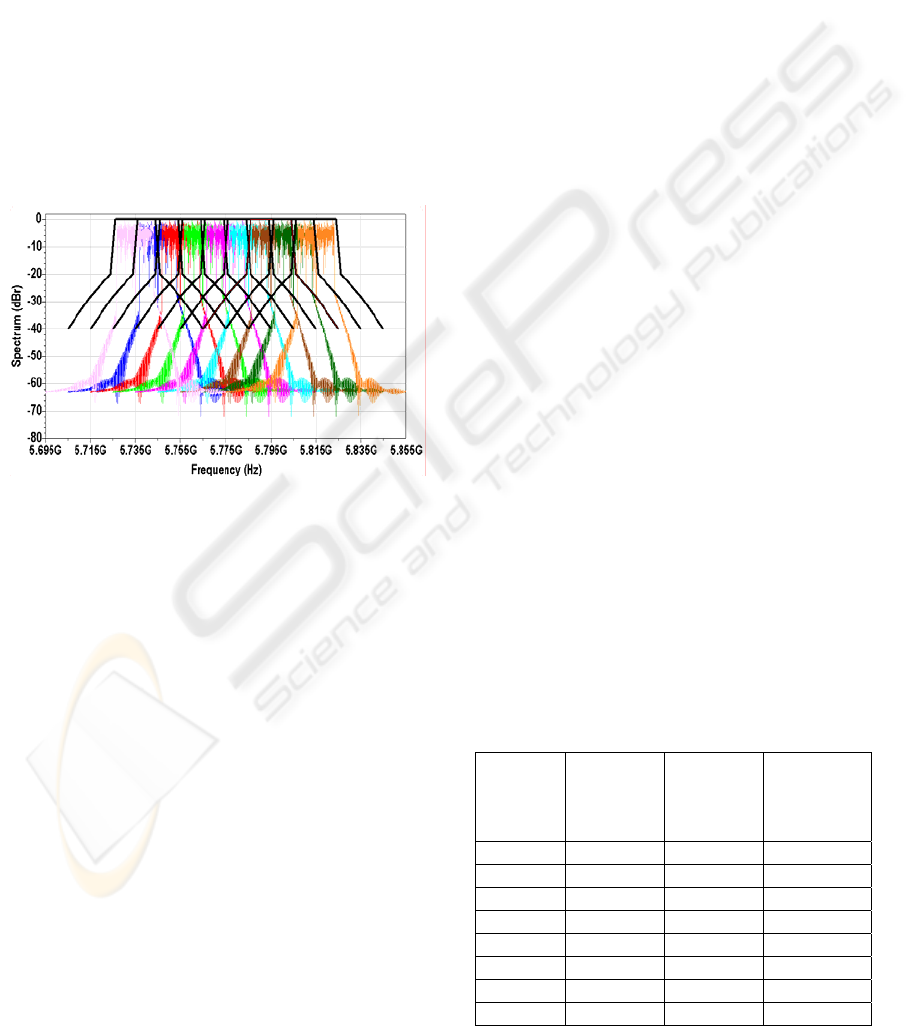
In section 17.3.9.2, the transmit spectrum shall
have a 0 dBr (dB relative to the maximum spectral
density of the signal) bandwidth not exceeding 18
MHz, -20 dBr at 11 MHz frequency offset, -28 dBr
at 20 MHz frequency offset and –40dBr at 30 MHz
frequency offset and above. Here, the nine channels
that available in this system are measured. It is
found that all the transmit signal falls within the
allowable spectral mask shown in the Figure 1.
Figure 1: Transmit RF Spectrum
The error vector between the vector representing
the transmitted signal and the vector representing the
error-free modulated signal defines modulation
accuracy. The magnitude of the error vector is
called EVM. The purpose of this test is to verify that
the root mean square (rms) EVM measured on the
specific part of the burst meets the conformance
requirement. EVM and relative constellation error
measurements here are based on (IEEE 802.11a,
1999) section 17.3.9.6 and section 17.3.9.7. The test
for every sub carrier is performed over 20 frames
and the rms average is taken. Simulation results
show that all the EVM, averaged over sub-carriers,
OFDM frames and packets are less than 0.003%,
and the constellation are approximately –88 dB
which is much smaller than the specification
requirements.
3 RECEIVER TEST
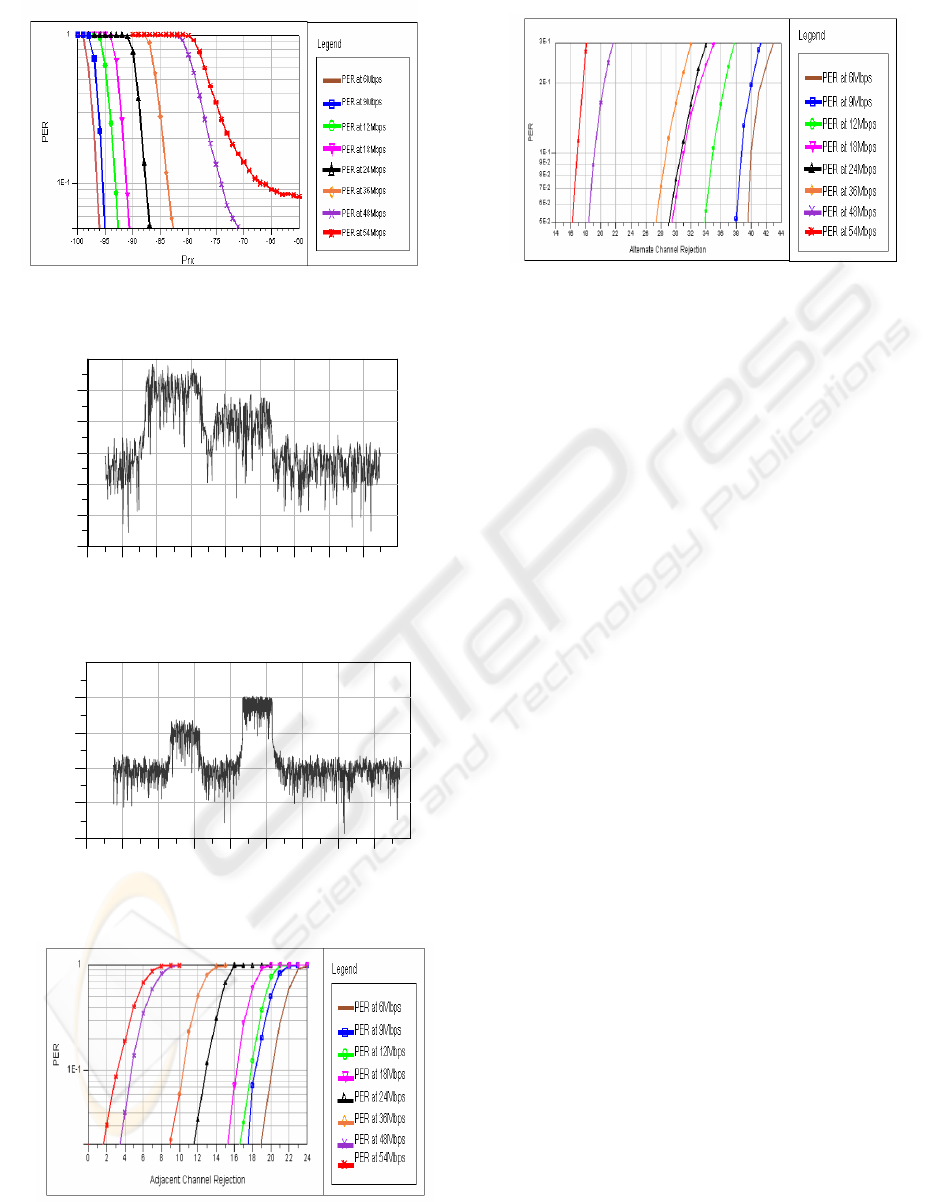
The receiver performance requirements (IEEE
802.11a, 1999) are listed in Table 1. Firstly, the
packet error rate (PER) for rate-dependant input
levels in the table are tested less than 10% at a
physical sublayer service data units (PSDU) length
of 1000 bytes The minimum input levels are
measured at antenna connector with noise factor of
10 dB and 5 dB implementation margins. The
simulation result is displayed in Figure 2. It shows
that at PER
1
10
−
(10%), the received signal levels is
lower than the minimum sensitivity allowed.
Secondly, the adjacent channel rejection is tested
by setting the desired signal’s strength 3dB above
the rate-dependent sensitivity specified in Table 1
and raising the power of the interfering signal until
10% PER is caused for PSDU length of 1000 bytes.
The power difference between the interfering and
the desired channel is the corresponding adjacent
channel rejection. The interfering signal in the
adjacent channel is also a conformant OFDM signal,
unsynchronized with the signal in the channel under
test.
Thirdly, the same setting applies for the non-
adjacent channel rejection. The non-adjacent
channel rejection is also called alternate channel
rejection where the interfering signal is 40 MHz
from the channel under test. Figure 3 and 4 show the
power versus spectrum for data rate at 54 Mbps with
interference signal 10dB higher than the actual
signal for adjacent rejection channel and interference
signal 15dB higher than the actual signal for
alternate rejection channel rejection. The simulation
results for adjacent and alternate rejection tests are
shown in Figure 5 and 6. At PER equals to
1
10
−
(10%), all the adjacent and alternate channel
rejection for the eight data rate are higher than the
standard values and so the system fulfils the
requirements.
Table 1: Receiver performance requirements
Data
Rate
(Mbits/s)
Minimum
sensitivity
(dBm)
Adjacent
channel
rejection
(dB)
Alternate
channel
rejection
(dB)
6 -82 16 32
9 -81 15 31
12 -79 13 29
18 -77 11 27
24 -74 8 24
36 -70 4 20
48 -66 0 16
54 -65 -1 15
BER PERFORMANCE SIMULATION IN LOS ENVIRONMENT FOR FIXED BROADBAND WIRELESS ACCESS
SYSTEM
167
5.76 5.77 5.78 5.79 5.80 5.81 5.82 5.835.75 5.84
-120
-110
-100
-90
-80
-130
-70
Frequency (GHz)
P
ower
(dB
m
)
Power (dBm)
Frequency (GHz)
5.74 5.76 5.78 5.80 5.82 5.84 5.86 5.885.72 5.90
-120
-100
-80
-60
-140
-40
Frequency (GHz)
Power (dBm)
Power (dBm)
Frequency (GHz)
Figure 2: Receiver Sensitivity
Figure 3: Adjacent Channel Rejection
Figure 4: Alternate Channel Rejection
Figure 5: Adjacent Channel Rejection Test
Figure 6: Alternate Channel Rejection Test
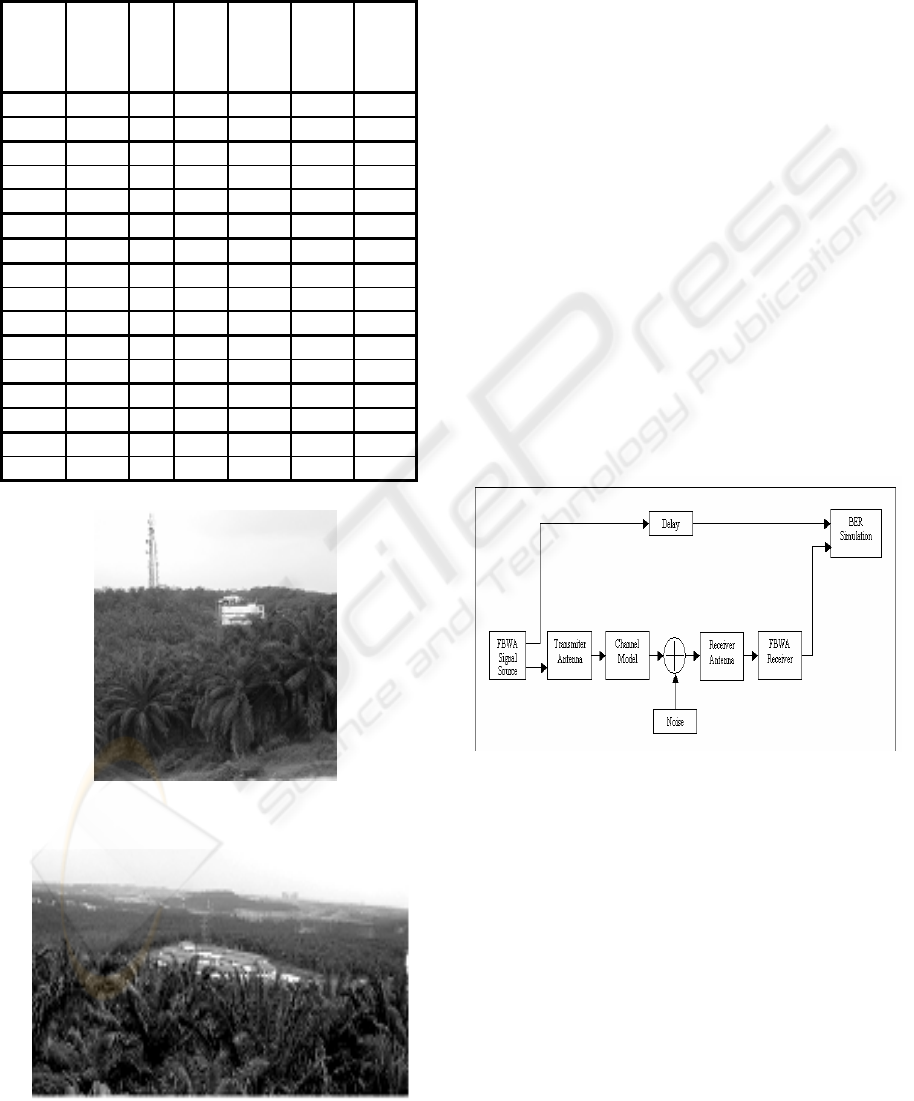
4 CHANNEL MODELS
The channel models are obtained from a 3D Vertical
Plane Launch (VPL) ray tracing technique (Liang
and Bertoni. 1998) that incorporates site specific
environmental data in a newly constructed hostel in
Universiti Teknologi Malaysia (UTM) for 5.8 GHz
carrier frequency. Transmit site is at Wireless
Communication Centre (WCC). The receiver sites
consist of 8 LOS locations in a two u-shaped
hostel’s buildings, which are located around 50
meters lower than WCC. The terrain between WCC
and the hostel is a small oil palm plantation. Hence,
the site overlooked a terrain of light rolling hills with
moderate tree densities. From the highest floor of
WCC, we can see these buildings and the oil palm
plantation. The distances for these links are ranged
from 416 to 564 meter. Figure 7 and 8 show the
photo of WCC and the photo of the hostels that is
captured from WCC.
With building, terrain, and antenna databases, and
also transmitter and receiver locations databases, the
8 channel models are obtained from the propagation
prediction. However, this model excluded the
vegetation effects that appeared in the fresnel zone
clearance in the real site environment. Modification
is needed on predicted channel models to take
account of the obstruction loss. Path loss field
measurement has been conducted using the FBWA
system. To assure that propagation channel is
stationary in time, the measured data is averaged
over 30 instantaneously sampled values in 15
minutes. The deviation within free space loss and
measurement loss is used to consider the obstruction
loss of vegetation in fresnel zone. After adding
relatively the computed obstruction loss into each
component of the ray of the links, the complete sets
of output magnitudes are ready for BER
performance. The parameters of the eight channels
ICETE 2004 - WIRELESS COMMUNICATION SYSTEMS AND NETWORKS
168
are listed in the Table 2. A more detail explanation
of channel modeling can be found in (Tang and
Tharek, 2004)
Table 2: Channel Models
Figure 7: WCC
Figure 8: Hostel
5 SIMULATION RESULTS
The tested BFWA system is simulated under the 8
channel models. The block diagram for the BER
performance simulation is displayed in Figure 9.
Firstly, we have FBWA system signal source which
generates radio frequency (RF) OFDM signal, by
random data generation, scrambling, convolutional
coding, interleaving, mapping, inverse Fast Fourier
Transform, multiplexing, window function addition,
and idle insertion based on the IEEE 802.11a
Standard. The signal is then transmitted by an
antenna with location coordinates, height and gain,
going through the channel model with addition of
the noise according to the
0
/ N
b
E
. A receiver antenna
at a location with certain gain then captures the
signal. The FBWA receiver that owns full frequency
synchronization and reverse operations of FBWA
signal source receives the RF signal. The PSDU
from the receiver and the PSDU from the signal
source is synchronized by delaying the PSDU from
the signal source. Both the PSDU are compared to
obtain the BER performance. As the FBWA system
can only support until 36 Mbps, the simulations are
carried out at that data rate over Channel L1-L8.
Figure 9: Block Diagram for Simulation
To have an idea on how the BER performance is
effected by various parameters seperately, literature
study has been carried out. Numerical results from
(Yee and Linnartz, 1994) and (Witrisal et al., 1998)
revealed that the Rician K-factor has a significant
effect on the BER. The BER performance is getting
better as the value of K factor is higher at
0
/ N
b
E
higher than 5 dB.
On the other hand, results from (Doufexi et al.,
2002) indicated that system performance improves
as the RMS delay spread increases, until the excess
delay significatly exceeds the guard interval length.
This characteristic is due to OFDM exploits the
Channel
Num.
Distance
(meter)
Tap
Num.
Delay
(ns)
Average
Relative
Power
(dB)
RMS
Delay
Spread
(nsec)
Rician K
Factor
(dB)
L1 416.15 1 0 0 89.30 2.54
2 401.43 -12.59
L2 473.31 1 0 0 75.22 6.35
2 696.47 -19.19
3 26.27 -20.28
L3 478.06 1 0 0
L4 480.08 1 0 0
L5 491.00 1 0 0 8.93 6.11
2 29.03 -14.63
3 62.50 -18.27
L6 518.55 1 0 0 3.54 2.90
2 31.93 -19
L7 547.39 1 0 0 4.24 2.90
2 37.70 -18.86
L8 564.11 1 0 0 12.60 2.84
2 91.40 -17.04
BER PERFORMANCE SIMULATION IN LOS ENVIRONMENT FOR FIXED BROADBAND WIRELESS ACCESS
SYSTEM
169

increased frequency diversity that results from high
rms delay spread.
Besides, to improve the performance of the
system under certain channels, we may sacrifice the
speed of the data transmission. The performance of
the system increases as we decrease the data rate.
From Figure 10, we may observe that the BER
performance for the modeled system undergoing
channel L1 improving as data rate is lower.
The simulated BER performance results for
different channels are illustrated in Figure 11. We
found that this system performs better under
Channel L1 and L3, where the BER are near
4
10
−
when the
0
/ N
b
E
is in 12 and 14 dB range, comparing
with BER of other channels with
0
/ N
b
E
bigger than
16 dB. From our observation, L2 with longer
distance and bigger Rician K factor but a smaller
rms delay spread have worse performance than L1.
Here, the rms delay spread has much effect on the
performance. For channel L3 and L4 with single ray,
the longer distance link in L4 has worse
performance. The effect of rms delay spread can also
be seen from channel L2 and L5 with Rician K
factor 6 dB and channel L6 and L7 with Rician K
factor 2.9 dB. The bigger rms delay spread gives a
better performance. The longest distance link in L8
give worst performance although the rms delay
spread is bigger than channel L6 and L7.
The BER performances of the system over the
channels are found unpredictable without a
simulation and measurement. The performance
under these channels varies widely although all of
the channels are under LOS conditions. The
difference of the performances are not only due to
delay spread and Rician K-factor of each channel,
but also the distance, transmit power, and received
signal level of the links.
6 CONCLUSIONS
A high availability of a radio system is not only
depending on the design of the equipment, but also
the good location of radio antenna sites and a good
path planning. This paper highlights a good path
planning for a FBWA system. We model 8 LOS
channels with a physical propagation model and
enhance them with field measurement at the related
site. Then, the physical layer of FBWA system is
modeled and tested to conform its specifications and
standards. This is followed by the simulation on
BER performance of the system over the modeled
channels using a software simulator tool. BER
performance results have been presented and good
performance links are identified.
REFERENCES
Clark M. P., 2000, Wireless Access Network, John Wiley
& Sons. West Sussex P019 1UD, UK.
IEEE 802.11a, 1999, Part 11: Wireless LAN Medium
Access Control (MAC) and Physical Layer (PHY)
specifications: High-speed Physical Layer in the 5 GHz
Band.
Liang G. and Bertoni H.L. 1998. A new approach to 3-D
ray tracing for propagation prediction in cities. IEEE
Trans. Ant. Propagation, vol. 46, no. 6, pp.853-863.
Tang M.K. and Tharek A.R. 2004. Channel Modeling at
5.8 GHz for Fixed Wireless Access. In WOCN’04,
First IFIP International Conference on Wireless and
Optical Communications Network.
Tang M.K and Tharek A.R. 2004. Propagation Prediction
Based on Meaurement at 5.8 GHz for Fixed Wireless
Access. ICT’04,11th International Conference on
Telecommunication.
Yee. N and Linnartz J.P. 1994. Controlled Equalization of
Multi-Carrier CDMA in an Indoor Rician Fading
Channel. In IEEE 44
th
Vehicular Technology
Conference, vol. 3, pp.1665-1669.
Witrisal K., Yong H. K. and Prasad R. 1998. Frequency-
Domain Simulation and Analysis of the Frequency
Selective Radio Channel for the Performance Analysis
of OFDM. In Proc. 3, OFDM Fachgesprach,
Braumschweig, Germany.
Doufexi A. et al. 2002. A Comparison of HIPERLAN/2
and IEEE 802.11a Wirelss LAN Standards.IEEE
Communications Magazine, May 2002, pp. 172-180.
ICETE 2004 - WIRELESS COMMUNICATION SYSTEMS AND NETWORKS
170
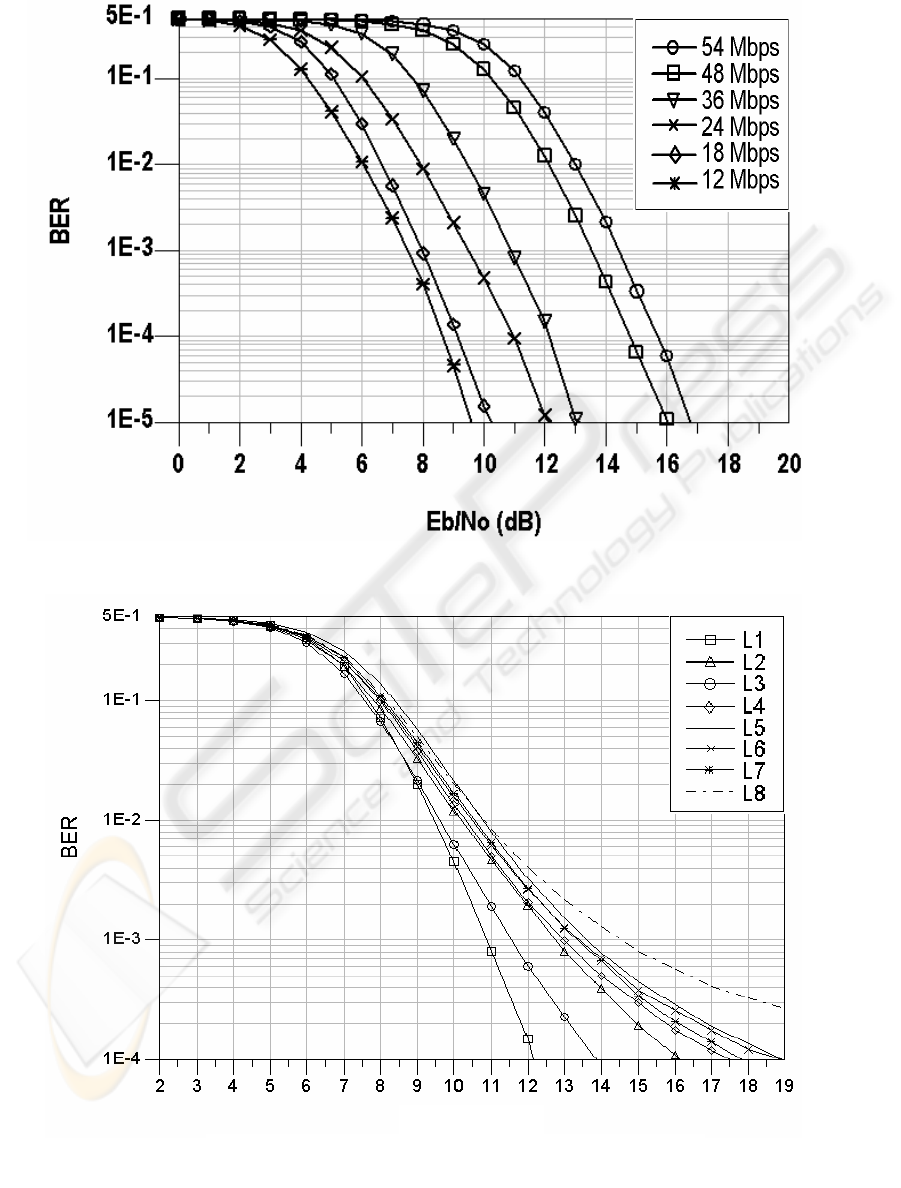
Figure 11: BER Performance For Different Channels
Eb/No
Figure 10: BER Performance For Channel L1
BER PERFORMANCE SIMULATION IN LOS ENVIRONMENT FOR FIXED BROADBAND WIRELESS ACCESS
SYSTEM
171
