
DEVELOPMENT OF OPEN CODE APPLICATION FOR
REMOTE MEASUREMENTS
Simone Müller Vidal, Haroldo Stark Filho, Keiko Ono Fonseca, Alexandre de Almeida Prado Pohl
Centro Federal de Educação Tecnológica do Paraná (CEFET-PR)
Programa de Pós-Graduação em Eng. Elétrica e Informática Industrial
Av. Sete de Setembro, 3165 - CEP 80230-901 - Curitiba-PR – Brasil
Keywords: Java-based instruments, open source software, remote measurement
Abstract: New Web-based monitoring and control system applications have been developed to allow remote control
of equipments. Although interesting and useful, such applications present hidden costs related to software
development tools, annual software licensing, regular maintenance and upgrades. This paper presents an
application tool for controlling instruments over the Web developed using open code resource, such as
Linux, JAVA and CamServ. The application shows a potential use for laboratories dealing with different
types of equipment conformance testing. The developed tool allows access to the instrument’s screen
through a video streaming process, an alternative towards similar application, in which data is first acquired
and then plotted using graphical tools. First tests over a 10 Mbps LAN Network and 1 Gbps Ethernet Inter-
Universities Network evaluated latency times and the video quality versus video signal acquisition system.
Specification and development issues are described, as well testing and validation schemes of the developed
application.
1 INTRODUCTION
The world wide use and evolution of computer-
based communications, through which the Internet is
its best example, has made it possible to create and
develop new types of tools and services that are
intended to offer new alternatives and even replace
the way human activities are performed. One
example is the area of Industrial Automation and
Measurement, which has seen a great number of
innovations and improvements concerning the
remote control of instruments through web-based
techniques.
Beginning in the late 90´s a series of experiments
has shown the feasibility of doing remote
measurements over the web using simple
instruments like oscilloscopes, digital multimeters
and signal generators (Leitão, 2001; Gillet, 2001;
Ko, 2001; Ferrero, 2003). Most part of it was
foreseen as didactic laboratories, which could be
mainly justified as a cost-reduction attempt to bring
expensive instruments to a large audience of
students. Besides, the continuous spread of Local
Area Networks (LAN) in the industrial environment
has facilitated the intervention on and control of
dedicated measurement systems using a client-server
architecture based on Internet Protocol (IP) networks
(Schmid, 2001). Another example of remote
measurement system is drawn from the area of
conformance testing, in which product or equipment
shall be tested in order to verify their specifications
according to parameters established by norms and
standards. Usually, such tests should be carried on
by an experienced technician and require specific
instrumentation.
Following this line of research, this paper
presents the main features of an application tool
based on open code software developed for
controlling measurement instruments. Particularly,
an example is given using an instrument for
measuring baseband video signal. An important
characteristic of such tool is the possibility of
viewing the instrument screen, which displays the
online results of a given command. In contrast to
other tools, that usually send data and plot results in
a scope-like chart using graphic resources at the
client side, the application takes advantage of the
video output existing in many instruments to send
this signal over the Web. Alternately, a web cam or
a CCD may be used to capture the instrument’s
screen output and send it along with the commands
that the operator wishes to set. It facilitates the
33
de Almeida Prado Pohl A., Müller Vidal S., Stark Filho H. and Ono Fonseca K. (2004).
DEVELOPMENT OF OPEN CODE APPLICATION FOR REMOTE MEASUREMENTS.
In Proceedings of the First International Conference on E-Business and Telecommunication Networks, pages 33-38
DOI: 10.5220/0001393600330038
Copyright
c
SciTePress
observation of results on one side, but may be a
burden in low capacity networks imposing a great
delay to the streamed video signal. However, we
believe the upgrade of communication networks to
support higher capacities (e.g. GigaEthernet) and
Quality of Service (QoS) guarantees will drastically
reduce or avoid this problem.
This paper is structured as follow: Section 2
identifies the application context and related
requirements, its basic functions and architecture,
and some development issues; Section 3 describes
its operation through a remote measurement
experiment example. Functional and conformance
tests of the initial requirements are presented and
discussed at Section 4. Finally, Section 5 presents
our conclusions about the application tool
functionalities and results and outlines some future
research works on the same subject.
2 DESCRIPTION OF THE
APPLICATION BASIC
FUNCTIONS
2.1 Concept and Architecture
Every single application designed as a tool for
performing remote measurements should be first
concerned with the type of tests to be done. If its
purpose is only a didactic one, then instruments may
be interfaced apart of each other and each
experiment may run independently. If this is the
case, the application should consider simultaneous
access by several users limiting the users number by
the available number of instruments/experiments one
may have access to (Ko, 2001). However, if the
designers have in mind an application that needs to
follow a norm or standard and a sequence of tests
needs to be performed with one or more instruments
interconnected, then requirements are very strict and
most probably only one user will be allowed to
execute the application at a time. So, a previous
knowledge of the way the application works should
be available for the potential clients as, for instance,
by providing information at the appropriate web
page.
The tool can be represented by its basic
building blocks: a block that grants access to users
(authentication block), a block with general
information about the application and specific
information on every test that may be performed and
a block through which the user call the routines
needed for commanding the instruments. The
authentication block can also checks the tool
availability and sends warnings about the current
access status.
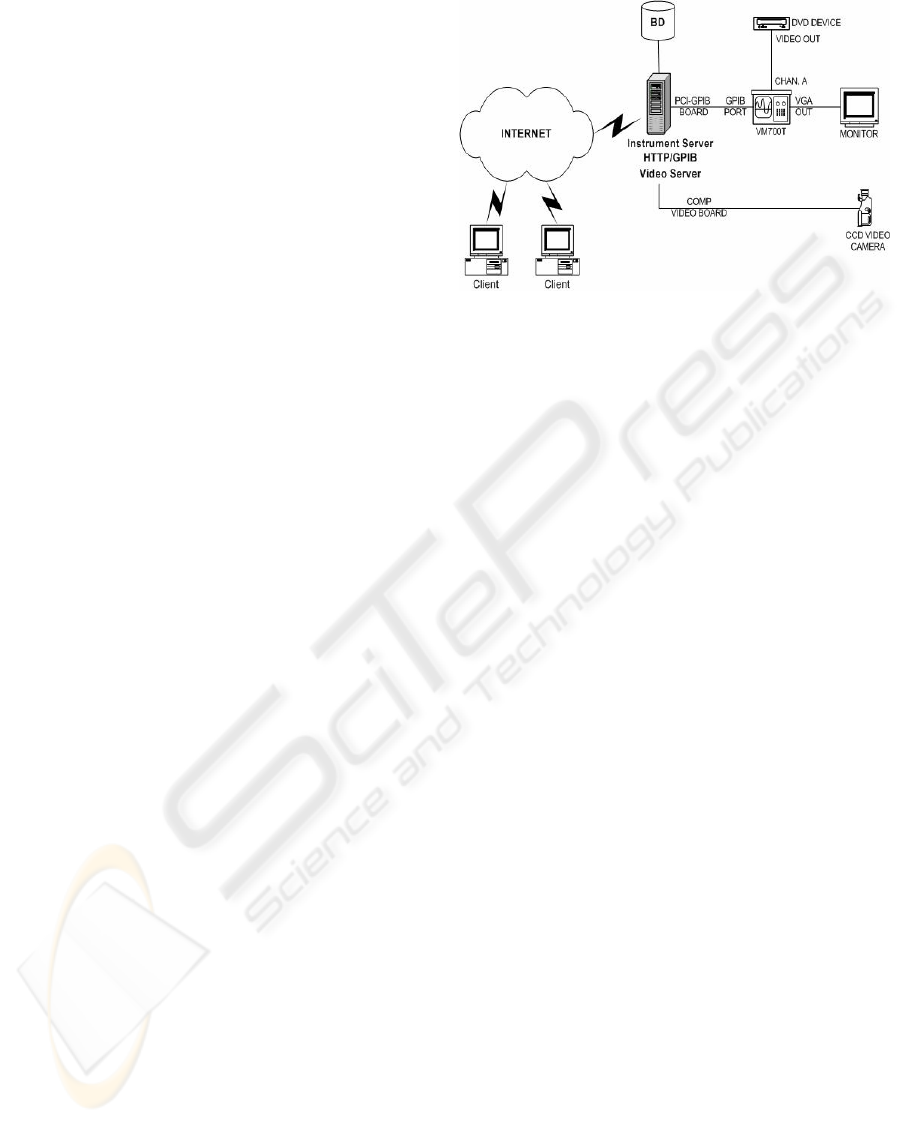
Standard client-server architecture is used for
implementing the remote laboratory. Fig. 01 shows
this architecture, where the remote client accesses a
video and instrument server through a web page.
The instrument server functions as the
communication interface to the required instruments
and should carry out the necessary interfaces (digital
I/O, A/D and D/A boards, RS232, IEEE 488, etc)
through which the commands with the instruments
are exchanged. It also bears the video capture cards
that are necessary for visualizing the instruments´
screen. The communication between the video and
the instrument server may occur over a local
network or even in specific cases over a WAN.
2.2 Development Issues
The application was developed using open code
software such as the JAVA language (JAVA, 2004)
running on a LINUX platform (Kernel version:
2.4.20; Slackware distribution). LINUX has been
widespread, but still presents difficulties concerning
appropriate drivers for the different devices used in
the servers. Particularly, drivers for video capture
cards and IEEE 488 interfaces may be hard to find
for different LINUX versions. JAVA is a platform
independent language that was developed for the
implementation of secure distributed systems. Its use
in the present application is fundamental; it enables
an interface between JAVA and programs written in
another language (for example, C for the interface
between the VM700T, a Waveform Analyzer, and
instrument server) called Java Native Interface (JNI)
and distributes data through the web, between the
JAVA Applet and the instrument server, known as
Remote Method Invocation (JAVA RMI). The JNI
has been developed for interfacing the developed
Java classes to the low-level drivers of the
Figure 1: Remote Laboratory Architecture
ICETE 2004 - GLOBAL COMMUNICATION INFORMATION SYSTEMS AND SERVICES
34
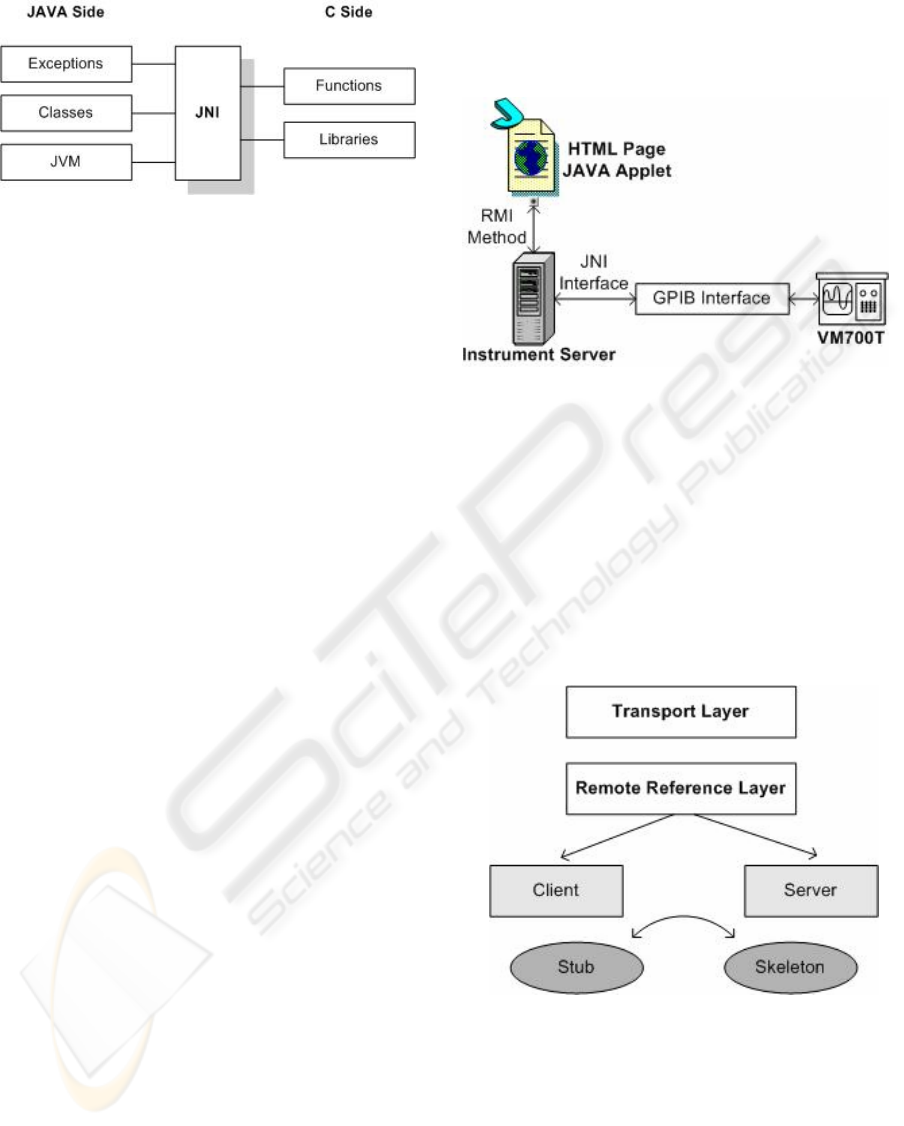
instruments (see Figure 2). This is an important
issue, as instrument manufacturers have a great
variety of native codes through which the instrument
functions may be remotely commanded. The JAVA
RMI enables the creation of distributed JAVA
technology-based to JAVA technology-based
applications, in which the methods of remote JAVA
objects can be invoked from other JAVA virtual
machines.
A video streaming tool is necessary for
visualizing the instrument display of the remote
controlled instrument. Commercial tools such as
Windows Media Player and Real Video Player are
available. These tools may be downloaded free but
limited for a short number of users. However, under
the guideline of using open code software, a
streaming tool known as CamServ (CamServ, 2004)
was used in our application. This video server
presents the following features:
• Downloadable;
• Encoder and server are in one
application;
• Easy to install;
• Not much configuration is needed for it
to run;
• Relatively small when compared to other
video server applications;
• Use multipart JPEG.
The application tool can be executed through an
URL address using a browser such as Internet
Explorer, Netscape or Apache.
2.3 Data Flow Information
In order to use an instrument via Internet, the client-
server model was adopted as described in the
Section 2.1. Fig. 03 shows the data flow information
of this architecture on a remote measurement
experiment with a Waveform Analyzer, VM700T.
On the server side the instrument is connected to the
controller (instrument server) using the GPIB
(General Purpose Interface Bus – IEEE 488) bus
1
.
The GPIB describes a standard interface for
communication between instruments and controllers
from different manufacturers. In the server the
instrument is accessed by a JAVA code that interacts
with the instrument driver via JNI. The client is
represented by means of an applet JAVA that is
downloaded using a standard browser. This applet
will connect with the server using the
communication model RMI.
To control the instrument from a personal
computer (PC), a GPIB bus was used as shown at
Figure 3. This networked system has all the features
that are required to create a measurement system.
Remote control of instruments is one aspect of these
features, but there are other more important features
1
Any communication interface can be used. Usually,
measurement equipments support GPIB, RS232 and the new ones
USB or Ethernet (IEEE 802.3) communication interfaces.
Fi
g
ure 3: Remote Laborator
y
Im
p
lementation
Fi
g
ure 2: JNI Interface
Fi
g
ure 4: RMI Structure
DEVELOPMENT OF OPEN CODE APPLICATION FOR REMOTE MEASUREMENTS
35
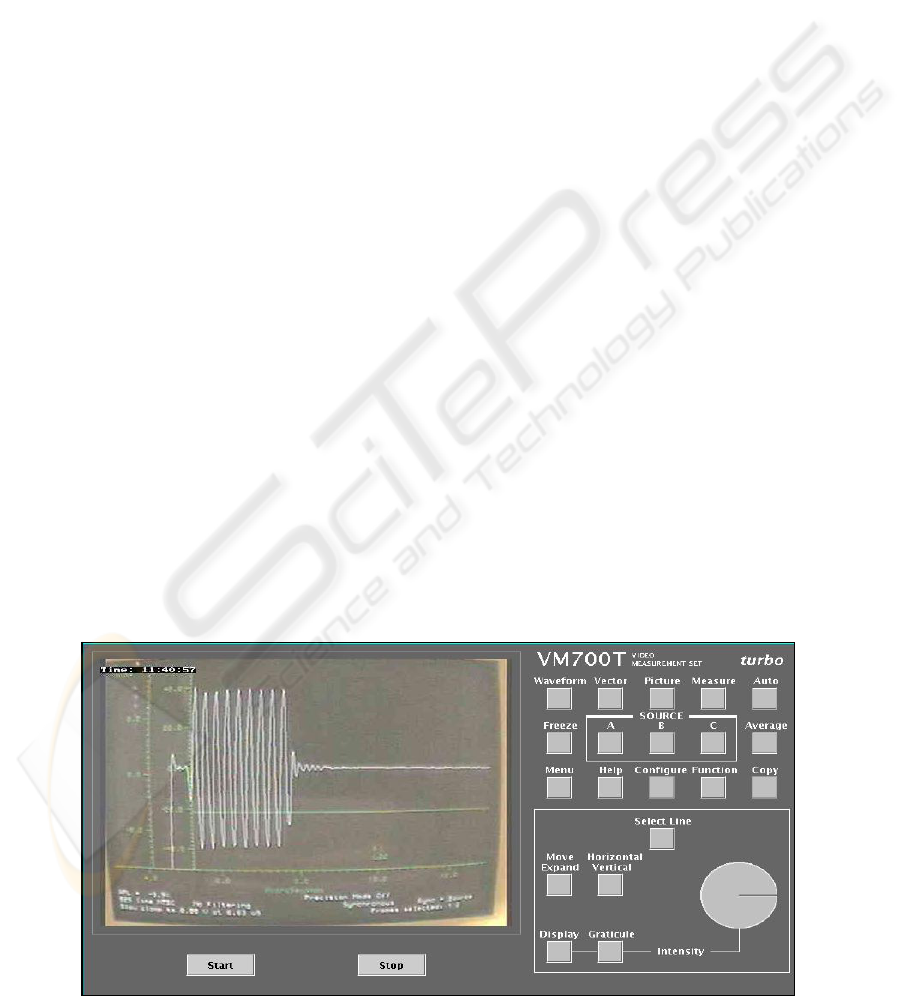
Figure 5: VM700T (Waveform Analyzer) GUI
like data handshake for reliable operation and real-
time response capability, only to name a few.
The JNI allows JAVA code, which runs within
a JAVA Virtual Machine (JVM), to operate with
applications and libraries written in other languages,
such as C, C++ and Assembly. JNI has defined
standardized naming and calling conventions used
by the JVM to call native methods and functions.
Fig. 03 shows how the JNI ties the C-based side of
an application to the JAVA side (Chaitas, 2004).
Particularly, the software used to drive the
instrument by the controller was written in C. The
VM700T main JAVA program (or applet) connects
to the real device through drivers written in C.
To implement a remote instrument control the
RMI mechanism is used. The applet will be
downloaded through a standard browser when the
remote user connects to the measurement site. It has
to communicate with the remote object that resides
on the server in order to transfer commands to, and
take results from the instrument. Globally RMI
works as follow: a RMI server is declared and
bounded to the HTTP server of the local server. A
remote object, which implements a remote interface,
is declared to this server. The remote object has data
members and methods distributed between the
server and client side by using “stub” and “skeleton”
layers. “Stub” and “skeleton” are directly build from
the remote object. The “stub” is the client side
interface for the remote object, and the “skeleton”
the server side. Fig. 04 shows the general structure
of RMI (CGAL, 2004).
2.4 Instrument Graphic Interface
Independently of which instrument and setup is
necessary for the measurements, the client shall have
an interface with which he can interact by inserting
the input data to the experiment, setting the range of
relevant parameters or even the chain of commands
for operating the equipment. With this regard, an
interface was developed which simulates the
instrument front panel. The development was done
by using NetBeans IDE 3.5.1 development
environment, Apache HTTP Server 1.3 (Apache,
2004), J2SE 1.4.2 and CamServ 0.5.1. As an
example, Fig. 05 shows the interface developed for
the Waveform Analyzer, VM700 (Tektronix,
2004). The display of the instrument is viewed by
means of the video streaming application, described
above.
3 REMOTE MEASUREMENTS
3.1 Test Setup
In order to check the functionality of the application
a test setup was constructed. The setup is intended to
measure baseband video parameters, such as Bar
Line Time, Chrominance-Luminance Delay,
Differential Gain, Differential Phase, H_Blank,
V_Blank, etc, and uses the Waveform Analyzer,
VM700. This configuration consists of a signal
source (which may be a standard signal generator or
a baseband signal that outputs a VCR or a DVD) and
the waveform analyzer. Depending on the device
under test (DUT), such as a modulator, a more
sophisticated apparatus may also include a
demodulator, which is placed before the signal
analyzer.
3.2 Trial Tests
First tests were made in a local environment, where
both video and measurement servers were connected
to a hub. Several attempts to capture the image of
ICETE 2004 - GLOBAL COMMUNICATION INFORMATION SYSTEMS AND SERVICES
36
the analyzer’s screen were made. The screen of the
analyzer is very rich on information that is mainly
displayed in its upper or bottom part. Such
information is important for the equipment operation
and for displaying test results. The first attempt
placed a standard web cam (3Com Bigpicture Video
Camera - it captures 30 frames per second at 640-by-
480 pixel resolution) directly in front of the
instrument’s screen. The captured image was poor in
the sense that valuable information could not be read
in the reproduced image, though ordinary
communication lines barely support 176-by-144
resolution and rarely transfer more than 5 or 6
frames per second. So, in the second attempt a CCD
camera (Gradiente SC60) was used. The resolution
of the image was much better, mainly due to the
camera’s higher pixel density and also the quality of
its lens. It was also observed that the display of the
instrument might be an issue regarding the image
quality. The analyzer used in the setup presented a
slightly rounded display in the corners, which
provokes image distortion. This way, the third
attempt used the instrument’s VGA video output.
However, a video capture card with such a connector
would be needed. Unfortunately, no card was found
with such an interface. Instead, the instrument’s
video output was connected to a computer monitor
with a flat panel. This last setup showed a
reasonable image resolution.
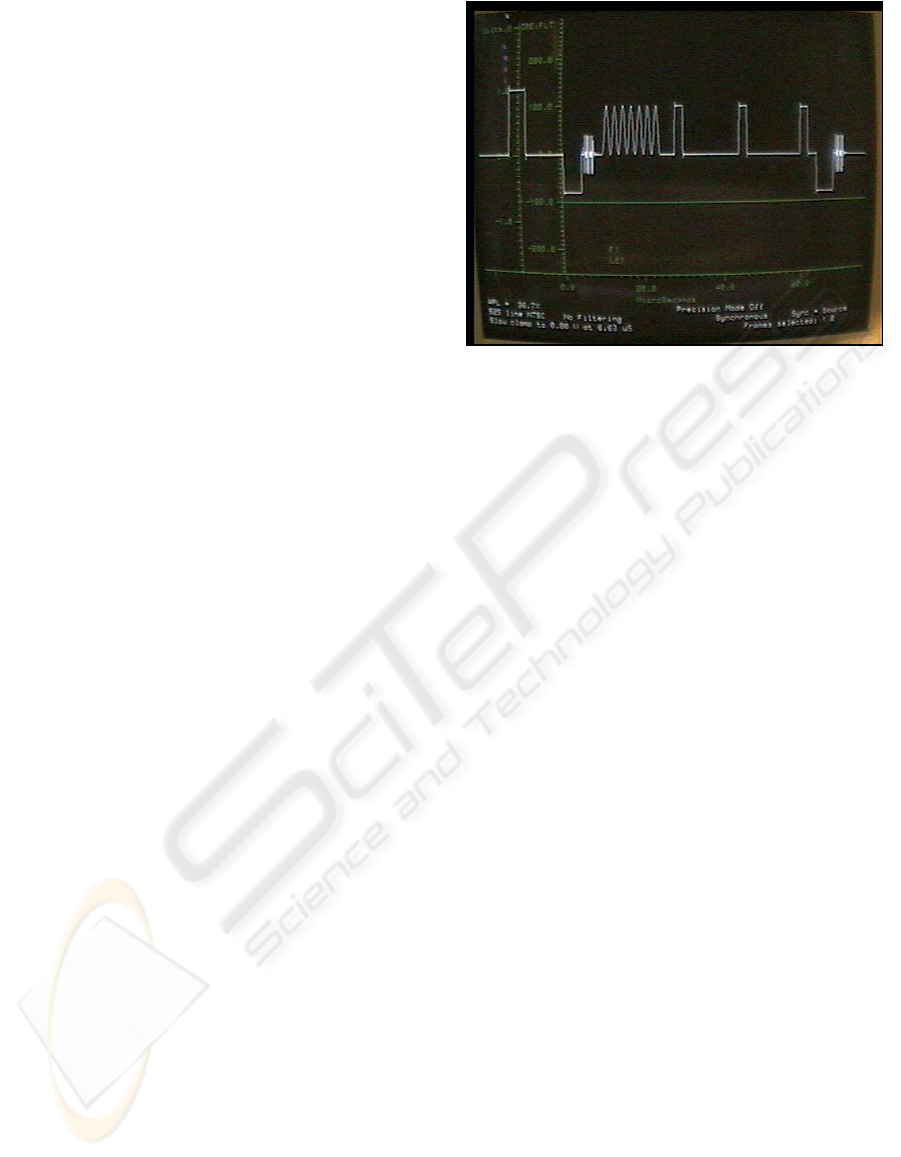
Fig. 06 shows the result of a synchronism
signal measurement viewed at the video server,
which was performed in the local environment.
Besides the touch buttons, there is also a round
button (see instrument’s right bottom panel in Fig.
05), which is driven by spinning it with the hand
around its central axis in the real instrument. This
button is responsible for selecting the individual
signal lines, from which a frame is composed. In the
virtual instrument, this function is implemented by
dragging the knob with the mouse in the
(anti)clockwise direction.
4 VALIDATION OF THE
APPLICATION IN THE WEB
Several tests have been performed in order to verify
the proposed structure. In particular, several
accesses have been made from clients directly
connected to the university LAN and clients
connected to Internet through the ReMAV, an
advanced Metropolitan Area Network used for
research and education purposes.
The most significant contribution to the
equivalent latency time is given by the video
transmission viewed at the VM700 display. Taking
in account that the client already has a web browser
with the right plug-in installed, the delay time for the
video streaming into the university LAN is 7
seconds while, into the ReMAV, this time decreases
to 4 seconds.
5 CONCLUSION
An application for controlling instruments over the
Web was developed using open code resources such
as LINUX, JAVA and CamServ. Any known Web
browser may access the application, although the
performance differs significantly from each other.
Also, the available output display supported by the
instrumentation reflects on performance levels of the
remote display results. Two main bottlenecks were
identified: capacity and QoS support of the
communication network and processing power of
the video server. The main contribution of this paper
is the description of development issues of an open-
source Web-based measurement system based on
video streaming process. We believe our solution
greatly minimizes development time and costs by
avoiding the deployment of graphical tools to each
output file format of measurement equipments. A
next step aiming application performance
improvements requires the testing of other open
source video streaming tools, such as VideoLAN
(VideoLAN, 2004), which provides video
compression before streaming . Also, new
performance tests should lead to better specifications
for designing the video server.
Figure 6: Measurement at Video Server
SinaleasSigMeasurement
DEVELOPMENT OF OPEN CODE APPLICATION FOR REMOTE MEASUREMENTS
37
ACKNOWLEDGEMENTS
The authors would like to thank the Conselho
Nacional de Desenvolvimento Científico e
Tecnológico (CNPq), Brazil, for supporting this
project by means of the research grant CNPq
552342/2001-7.
REFERENCES
Apache, 2004: Apache HTTP Server Project,
http://httpd.apache.org/.
CAMServ, 2004: Official CamServ Home Page,
http://cserv.sourceforge.net.
CGAL, 2004: Building the CGAL Demo: A Web
Distributed Application, URL:
http://cgal.inria.fr/description.html.
Chaitas, 2004: Chaitas, P., Remote Control of Spectrum
and Network Analyser,
http://lesim1.ing.unisannio.it/Analyser/RemAnalyser.h
tm.
Ferrero, 2003: Ferrero, A., Salicone, S., Bonora, C. and
Parmigiani, M., ReMLab: A Java-Based Remote,
Didactic Measurement Laboratory, IEEE Transactions
on Instrumentation and Measurement, vol. 52, no. 3,
pp. 710-715, Jun. 2003.
Gillet, D., Latchmann, H.A., Salzmann, C. and Crisalle,
O.D., Hands-on Laboratory Experiments in Flexible
and Distance Learning, Journal of Engineering
Education, pg. 187-191, April, 2001.
JAVA, 2004: JAVA Technology, http://java.sun.com/.
Ko, 2001: Ko, C.C., Chen, B.M., Hu, S.Y., Ramakrishnan,
V., Cheng, C.D., Zhuang, Y. and Chen, J., A web-
based virtual laboratory on a frequency modulation
experiment", IEEE Transactions on Systems, Man, and
Cybernetics, Part C: Applications and Reviews, Vol.
31, No. 3, pp. 295-303, August 2001.
Leitão, V. G., Especificação de um Ambiente de Suporte
para Ensino de Laboratório via Telemedições. Tese de
Mestrado, Centro Federal de Educação Tecnológica do
Paraná, Curitiba, Dezembro 2001.
Schmid, D., Elkaas, T.I., Foss, B., Gillet, D., A Remote
Laboratory Experimentation Network, 1st IFAC
Conference on Telematics Applications in Automation
and Robotics, Weingarten, July 2001.
VideoLAN,2004: VideoLAN - Free Software and Open
Source video streaming solution for every OS,
http://www.videolan.net/.
ICETE 2004 - GLOBAL COMMUNICATION INFORMATION SYSTEMS AND SERVICES
38
