
PERFORMANCE MEASUREMENT OF TRANSACTION-BASED
INTERNET APPLICATIONS THROUGH SNMP
Luciano Paschoal Gaspary, Ederson Canterle
Programa Interdisciplinar de P
´
os-Graduac¸
˜
ao em Computac¸
˜
ao Aplicada,Universidade do Vale do Rio dos Sinos
Av. Unisinos 950 – 93.022-000 – S
˜
ao Leopoldo, Brazil
Keywords:
Transaction-based applications, response time, passive measurement, SNMP.
Abstract:
This paper proposes an approach to monitor response time of transaction-based Internet applications and proto-
cols that uses a passive network traffic monitoring technique and stores the resulting statistics in a management
information base compatible with the SNMP architecture. The work is within the scope of the Trace platform,
which provides support for high-layer protocols, services and networked applications management. The im-
plementation of the proposed approach comprises the extension of the monitoring agent, a key component of
the platform, so that it stores information related to response time and generates performance-related reports.
1 INTRODUCTION
The growing use of computer networks to support
applications that require high availability and perfor-
mance, such as web portals and e-commerce applica-
tions, has triggered the investigation of mechanisms
that not only assure good performance of the net-
work physical infrastructure, but also let one check
the quality of the services and applications running
on them. One of the most common metrics to as-
sess the functional state of an application is its per-
formance. Within this context, performance is un-
derstood as the response capacity of both the infras-
tructure and a given application in a networked envi-
ronment (Sturm, 1999). One of the most important
benchmarks to assess the performance of applications
is the response time of transactions (protocol interac-
tions).
There are several commercial applications con-
cerned with offering solutions to measure the per-
formance of applications. VitalSuite (Lucent, 2002),
Pegasus Network and Application Monitor (Ne-
tIQ, 2002), Application Performance Management
(Tivoli, 2002), ETE Watch (Candle, 2002), eHealth
(Concord, 2002), AppScout (NetScout, 2002) and
Spectrum (Aprisma, 2002) are examples of such ap-
plications. Among the approaches used to measure
response time, five stand out. One of them consists of
having software agents installed at end users’ stations.
These agents monitor user-run transactions, calculate
elapsed times and regularly report results to a central
station. VitalSuite, ETEWatch, Pegasus Application
Monitor, Application Performance Management and
Spectrum are examples of management applications
that use agents at users’ stations. A variation of this
approach is implemented by eHealth and Spectrum
applications, consisting of agents at server stations
to monitor the behavior of applications (for instance,
by permanently watching log files). The third ap-
proach follows the execution of artificial transactions
triggered from stations located at locations where it
is important to measure the performance users per-
ceive. VitalSuite, Pegasus Network Monitor, Appli-
cation Performance Management and Spectrum offer
this kind of functionality. The fourth and most pow-
erful approach, used by the Tivoli platform, is based
on instrumenting the application to be monitored on
client and/or server ends. Finally, the fifth approach
obtains information by passively monitoring network
traffic. AppScout and VitalSuite implement this tech-
nique.
The first four approaches are invasive. The employ-
ment of agents at end-user or server stations implies
the use of resources and loss of performance at the
stations where they are installed. The use of syn-
thetic transactions to assess application performance
has the disadvantage of using additional network re-
sources. Instrumenting software is useful to monitor
applications built within the organization, but it can-
not be used to monitor proprietary protocols and ap-
12
Paschoal Gaspary L. and Canterle E. (2004).
PERFORMANCE MEASUREMENT OF TRANSACTION-BASED INTERNET APPLICATIONS THROUGH SNMP.
In Proceedings of the First International Conference on E-Business and Telecommunication Networks, pages 12-19
DOI: 10.5220/0001399400120019
Copyright
c
SciTePress

plications. Also, it takes considerable investments to
train personnel in using programming APIs (Applica-
tion Programming Interfaces).
Besides being invasive, most current approaches
of the available management applications are propri-
etary, which induces organizations to acquire man-
agement software from a single manufacturer even
if it does not satisfactorily meet most needs. It thus
becomes a complex task to integrate the information
generated by such applications to the management
platforms organizations already use, which impairs an
integrated view of the operation of both the network
infrastructure and applications.
This paper presents an approach to monitor re-
sponse time of transaction-based Internet applications
and protocols that (a) uses a passive network traffic
monitoring technique and (b) stores resulting statis-
tics in an SNMP-compatible management informa-
tion base (which allows statistics to be obtained from
any management application that supports SNMP).
The work is within the scope of the Trace platform,
which offers support to manage high-layer protocols,
services and applications (Gaspary et al., 2002). The
implementation of the proposed approach covers the
extension of the monitoring agent, a key component
of the platform, so that it stores response time-related
information and generates performance reports, be-
side monitoring the number of trace occurrences.
The specification of protocol interactions whose re-
sponse time is to be measured is performed in PTSL
(Protocol Trace Specification Language), as proposed
by (Gaspary et al., 2001). The network manager
uses these specifications to remotely configure the
monitoring agents through the Script MIB (Levi and
Sch
¨
onw
¨
alder, 2001). In order to configure perfor-
mance measures to be carried out and to retrieve re-
sults, the manager interacts with the agent, also via
SNMP, through a subset of the Application Perfor-
mance Measurement MIB (Waldbusser, 2002).
The main contributions of our work are twofold.
First, we have developed a solution to measure pro-
tocol and application interactions response time that,
at the same time, uses a passive technique and pro-
vides results via SNMP (allowing its integration to
network management systems already in use). Sec-
ond, we propose a more flexible mechanism to spec-
ify, on the fly, the transactions whose response time
are supposed to be measured (in substitution to the
mechanism provided by APM).
This paper is structured as follows: section 2 sum-
marizes how to use PTSL to represent the proto-
col interactions to be monitored. Next, section 3
presents the subset of the Application Performance
Measurement MIB used. The paper follows with a
detailed presentation of the architecture of the mon-
itoring agent in section 4. Section 5 mentions some
examples of the use of the agent and section 6 con-
cludes with some final considerations and prospects
for future research.
2 REPRESENTATION OF
INTERACTIONS TO BE
MONITORED
This section summarizes the language used to rep-
resent protocol traces called PTSL (Protocol Trace
Specification Language), originally described in
(Gaspary et al., 2001). Through this language, the
network manager must specify the protocol interac-
tions (transactions) whose response times are to be
measured. The language is based on the concept
of finite state machines, and it comprises graphical
(Graphical PTSL) and textual (Textual PTSL) nota-
tions. The notations are not equivalent. The textual
notation allows the complete representation of a trace,
including the specification of the state machine and
the events that trigger transitions. The graphical nota-
tion, in turn, is equivalent to a subset of the other, and
offers the possibilities of depicting the state machine
and only labeling the events that enable transitions.
Figures 1 and 2 illustrate some protocol traces de-
scribed using the language’s graphical notation. The
trace shown in figure 1 allows monitoring HTTP re-
quests that will be successfully returned, and it can be
used to gather response times of successful accesses
to a web server. This kind of information can be
rather useful for companies that host web sites, por-
tals, and e-commerce applications (Application Ser-
vice Providers) because it allows the identification of
regions from where user-perceived response time is
too long. The response time of other interactions of
the HTTP protocol can be monitored similarly. For
instance, the time elapsed between the submission
of a given form via browser and the corresponding
return can be measured with the specification of a
trace where the request GET of figure 1 is replaced
with something like POST /path/script.cgi
HTTP/1.1.
Figure 1: Trace to monitor successful HTTP requests
As can be seen in figure 1, states in the graphical
notation are represented by circles. From the initial
PERFORMANCE MEASUREMENT OF TRANSACTION-BASED INTERNET APPLICATIONS THROUGH SNMP
13
idle state, n other states can be created, as long as
they can be reached through some transition. The fi-
nal state is identified by two concentric circles. Tran-
sitions are represented by single-pointed arrows. A
continuous arrow means the transition is triggered by
the client station, whereas a broken arrow means that
the transition is triggered by a server station event.
The text associated to a transition merely labels the
event that triggers the transition; its specification can
be made through the textual notation.
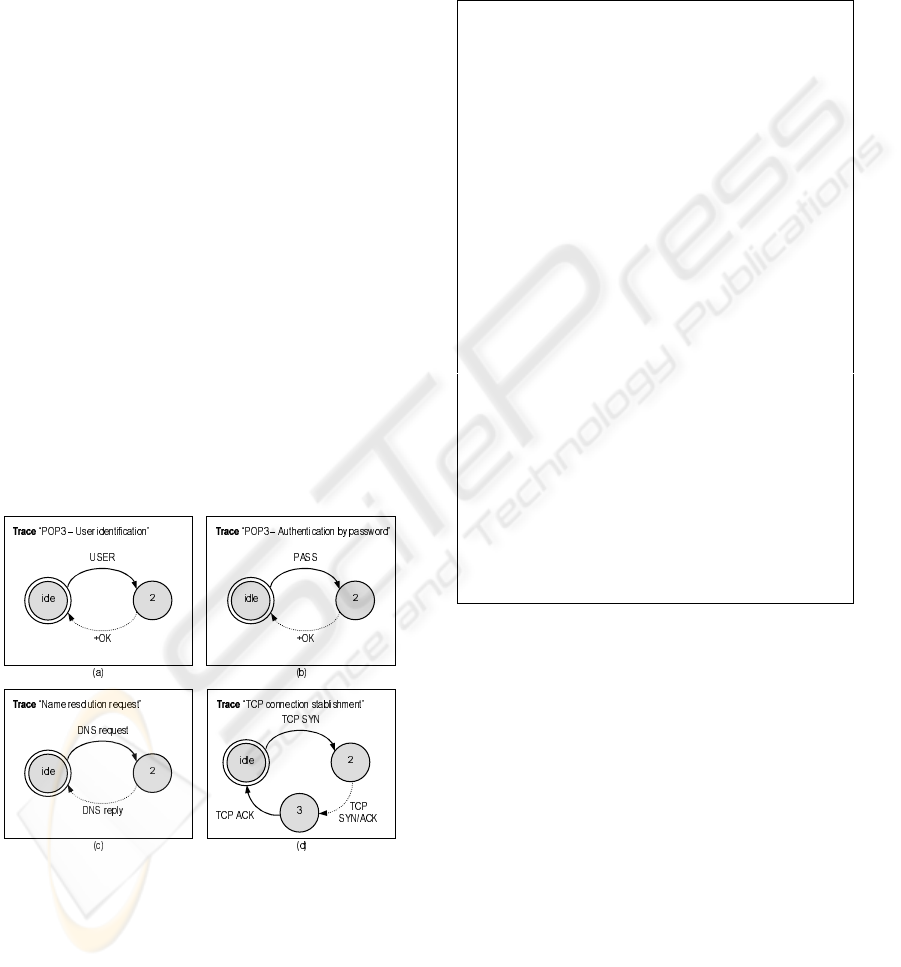
Figure 2 illustrates other examples. (a) and (b)
present traces that model a user’s authentication at a
POP3 server. In (a) the username is informed and in
(b) so is the password. These traces can be used to
store the response time of each stage of the authenti-
cation process. If the manager is interested in storing
a single response time comprising the entire authen-
tication process, the two traces can be combined. In
such case, the resulting trace would have four states:
idle → 2 → 3 → 4 → idle. Other significant pro-
tocol interactions can be modeled by replacing transi-
tion USER in (a) with LIST, RETR or DELE, to men-
tion just a few. The trace shown in (c) allows moni-
toring the response time of requests to a DNS server.
PTSL also allows modeling protocol traces that do not
belong to the application layer. For instance, (d) spec-
ifies the three steps to open a TCP connection (three-
way handshaking). This trace can be used to measure
the time spent to start a TCP connection between any
two end-points.
Figure 2: Graphical representation of protocol traces
Figure 3 presents the textual specification of
the trace illustrated in figure 1. Every specifi-
cation written in Textual PTSL begins with the
word Trace and ends with EndTrace (lines 1
and 37). Catalog and version control informa-
tion appear right after the keyword Trace (lines
2 to 7). After that, the specification is divided
into three sections: MessageSection (lines 9
to 22), GroupSection (not used in this ex-
ample) and StatesSection (lines 24 to 35).
MessagesSection and GroupSection define
the messages that trigger the evolution of the trace.
StatesSection defines the state machine that rep-
resents the trace.
1 Trace "Successful HTTP request"
2 Version: 1.0
3 Description: HTTP request replied with 200.
4 Key: HTTP, 200, successful request
5 Port: 80
6 Owner: Luciano Paschoal Gaspary
7 Last Update: Fri, 27 Dec 2002 16:16:00 GMT
8
9 MessagesSection
10
11 Message "GET"
12 MessageType: client
13 FieldCounter Ethernet/IP/TCP 0 GET
14 EndMessage
15
16 Message "HTTP/1.1 200"
17 MessageType: server
18 FieldCounter Ethernet/IP/TCP 0 HTTP/1.1
19 FieldCounter Ethernet/IP/TCP 1 200
20 EndMessage
21
22 EndMessagesSection
23
24 StatesSection
25 FinalState idle
26
27 State idle
28 "GET" GotoState 2
29 EndState
30
31 State 2
32 "HTTP/1.1 200" GotoState idle
33 EndState
34
35 EndStatesSection
36
37 EndTrace
Figure 3: Textual representation of a trace
The event that triggers the evolution of the state
machine is the verification of a packet on the network
that contains fields with values equivalent to those
specified in a message (Message). The way to spec-
ify the fields to be analyzed depends on the type of
protocol to be monitored. In the case of character-
based protocols, which have variable-length fields
separated by blank spaces (e.g. HTTP and POP),
a field is identified by its position in the message
(FieldCounter strategy). In HTTP/1.1 200,
for instance, HTTP/1.1 is at position 0 and 200 at
position 1 of the message. On the other hand, field
identification in binary protocols, which feature fixed-
length fields (e.g. TCP and DNS), is determined by a
bit offset from the beginning of the protocol header
to the beginning of the desired field; besides the ini-
tial position of the field, it is also necessary to inform
the number of bits the field uses (BitCounter strat-
ICETE 2004 - SECURITY AND RELIABILITY IN INFORMATION SYSTEMS AND NETWORKS
14

Table 1: Sample performance report generated by the APM MIB
Req. HTTP Req. HTTP Req. HTTP Trace
172.16.108.1 172.16.108.32 172.16.108.1 Client
172.16.108.2 172.16.108.2 200.248.252.1 Server
TransactionCount 125 500 313
SuccessfulTransactions 100 447 200
ResponsivenessMean 4.50 3.25 5.25
ResponsivenessMin 0.75 0.85 0.99 Ranges of
ResponsivenessMax 5.85 5.00 5.90 performance
ResponsivenessB1 5 27 10 0 ≤ t.r. < 1
ResponsivenessB2 10 65 17 1 ≤ t.r. < 2
ResponsivenessB3 28 152 50 2 ≤ t.r. < 3
ResponsivenessB4 20 142 30 3 ≤ t.r. < 4
ResponsivenessB5 25 37 40 4 ≤ t.r. < 5
ResponsivenessB6 12 24 53 5 ≤ t.r. < 6
egy).
The trace shown in figure 1 is for a character-based
protocol. Specification of message GET is illustrated
in figure 3 (lines 11 to 14). Line 12 defines the mes-
sage as being of the client type, which means that
the state transition associated to the message will be
triggered by the client station. Line 13 specifies the
only field to be analyzed. The information required
to identify it is: location strategy (FieldCounter),
protocol encapsulation (Ethernet/IP/TCP), field
position (0), expected value (GET) and an optional
field description. Message HTTP/1.1 200 (lines
16 to 20) is specified in a similar way. More infor-
mation on PTSL and more examples of traces can be
found at (Gaspary et al., 2001).
3 THE APPLICATION
PERFORMANCE
MANAGEMENT MIB
The APM (Application Performance Management)
MIB, proposed by (Waldbusser, 2002), defines ob-
jects that provide performance statistics (e.g. re-
sponse time) that users perceive in the applications
they use. The methods employed to build these statis-
tics are not specified by the MIB, so that each man-
ufacturer can choose those considered more conve-
nient. Originally designed to furnish information on
transaction, throughput and streaming-oriented appli-
cation performance, the MIB has been simplified by
our research group to offer support to the first type
only (transaction-oriented), which are the target appli-
cations of the Trace platform (Gaspary et al., 2002).
Henceforth we are going to call it short APM.
3.1 Performance Reports
The traces observed by an APM agent can be ag-
gregated in several ways to generate statistical per-
formance reports. The granularity of these reports
and how often they ought to be generated may be
specified by the network manager. The statistics the
MIB offers after aggregating a set of traces are as
follows: (a) TransactionCount: number of trace oc-
currences in the interval; (b) SuccessfulTransactions:
number of successfully completed traces; (c) Respon-
sivenessMean: arithmetic mean of all successfully
completed aggregated traces; (d) ResponsivenessMin:
minimum response time observed among all success-
fully completed aggregated traces; (e) Responsive-
nessMax: maximum response time observed among
all successfully completed aggregated traces; (f) Re-
sponsivenessBx: number of successfully completed
aggregated traces whose performance matches one of
six specified ranges. Because the performance of each
application varies a lot, the values of these ranges can
be specified separately for each monitored trace.
The APM MIB supports four different types of
aggregation: (a) aggregation of flows: for this kind
of aggregation, a record is created for each different
combination of trace, client and server the agent ob-
serves; (b) aggregation of clients: a record is created
for each different combination of trace and client; (c)
aggregation of servers: a record is created for each
different combination of trace and server; (d) aggre-
gation of applications: a record is created for each
trace observed.
Table 1 illustrates a hypothetical example of a re-
port with performance information related to a set of
traces Successful HTTP request, aggregated by flow
and monitored over a given time interval. It can be
seen that 125 HTTP traces occurred between stations
172.16.108.1 and 172.16.108.2. Out of these 125
traces, 100 were successfully completed. The mean
PERFORMANCE MEASUREMENT OF TRANSACTION-BASED INTERNET APPLICATIONS THROUGH SNMP
15
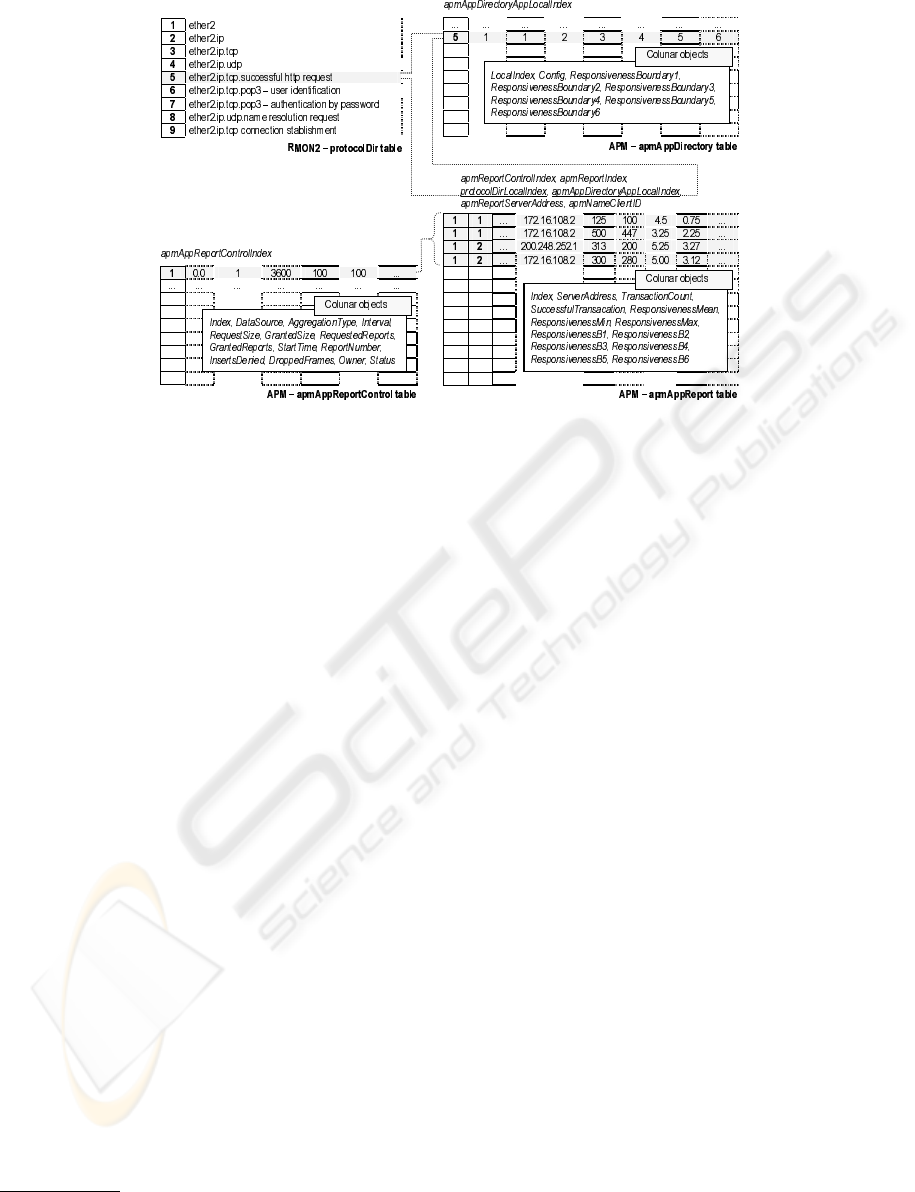
Figure 4: Tables of the short APM MIB
response time of successful traces was 4.50 seconds.
The fastest trace took 0.75 seconds to complete and
the slowest took 5.85 seconds. It can also be seen that
most successful traces had response time from 2.00 to
5.00 seconds.
3.2 MIB Structure
In order to offer the statistics mentioned,
the short APM MIB comprises two groups:
apmAppDirectory and apmReport. The first
one is used to perform configurations of the mon-
itored applications, including the six performance
ranges (table apmAppDirectory). The second
group, in turn, controls the creation and retrieval of
performance reports of these applications. In order to
do so, it has two tables: apmAppReportControl
and apmAppReport. Figure 4 shows these tables.
Table apmAppDirectory has one entry for each
trace to be monitored
1
. This table allows one to con-
figure, for each trace, whether the APM agent should
collect performance statistics for the trace and the
six performance ranges. Figure 4 illustrates the en-
try related to the Successful HTTP request trace in ta-
ble apmAppDirectory. An agent configured this
way is able to measure the response time of such
trace (apmAppDirectoryConfig=1) and its per-
formance ranges are 0–1, 1–2, 2–3, 3–4, 4–5 and 5–6
seconds.
Table apmAppReportControl lets one config-
ure the parameters to generate performance reports
1
Traces to be monitored are defined in table
protocolDir of the RMON2 MIB (Gaspary et al.,
2001).
on the observed traces. Each entry in this table
corresponds to a kind of report to be generated and
has the following information: monitored inter-
face (apmAppReportControlDataSource),
level of aggregation
(apmAppReportControlAggregationType),
monitoring interval
(apmAppReportControlInterval),
number of records admitted in report
(apmAppReportControlGrantedSize),
number of storable reports
(apmAppReportControlGrantedReports),
and others. In figure 4, the requested report will be
generated from monitoring the standard interface
(0.0), the traces will be aggregated by flows (1), the
monitoring interval will be 3600 seconds and the
report will not admit more than 100 records. The
maximum number of storable reports is 100.
Finally, the task of table apmAppReport
is to store the records generated for the config-
ured reports. The information available in this
table was specified in the previous sub-section.
As figure 4 shows, the entries available in table
apmAppReport belong to two consecutive re-
ports generated from the configuration of table
apmAppReportControl. In order to
retrieve the number of Successful HTTP
request traces successfully completed
(apmAppReportTransactionCount) be-
tween stations 172.16.108.1 and 172.16.108.2
in the first report, the OID to be used is
apmReportTransactionCount.1.1.5.5.
172.16.108.1.172.16.108.2.
ICETE 2004 - SECURITY AND RELIABILITY IN INFORMATION SYSTEMS AND NETWORKS
16
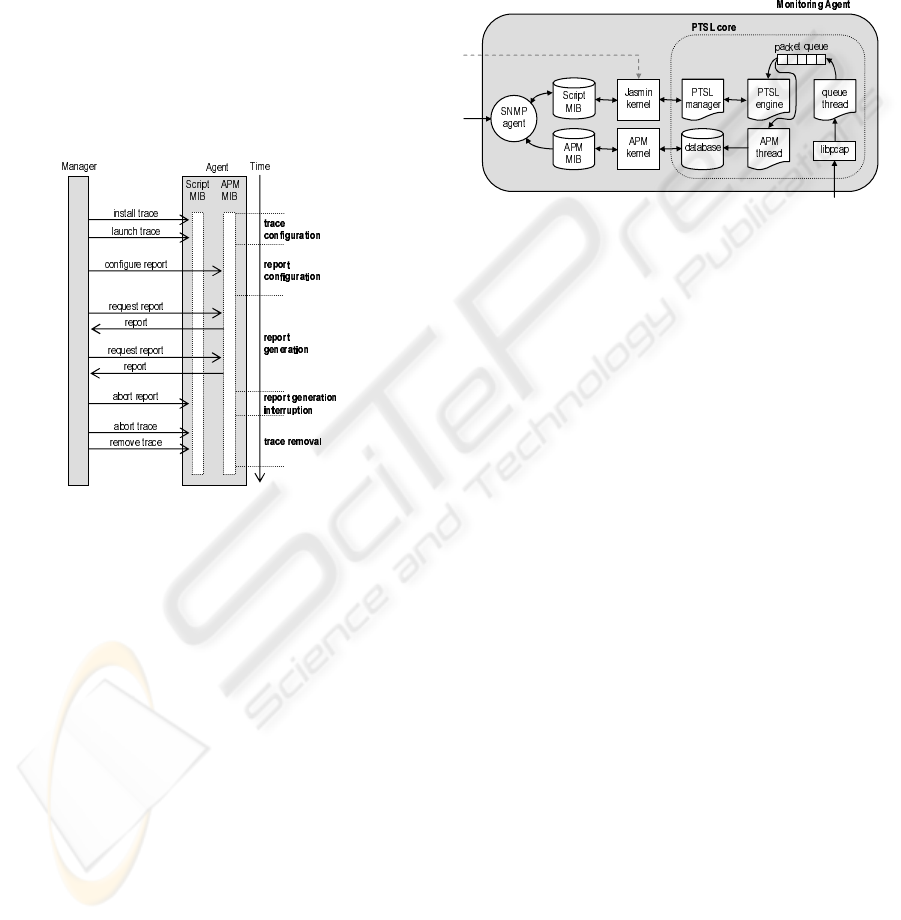
4 AGENT’S ARCHITECTURE
The SNMP agent that assesses performance is input
with protocol traces specified with PTSL language.
The configuration of the traces to be monitored at a
given time is performed by the manager, who commu-
nicates with the agent through the Script MIB. Once
programmed, it starts monitoring trace occurrence. In
order to configure performance measurements to be
carried out, the manager interacts with the agent, via
SNMP as well, through the subset of the Application
Performance Measurement MIB presented in section
3. The resulting reports can be retrieved from any
SNMP-supporting application through regular polls
to the APM agent. Figure 5 illustrates the flow of
information between manager and agent.
Figure 5: Flow of information between manager and APM
agent
The monitoring agent runs on Linux stations and
was implemented using the C language, the POSIX
thread library (Pthreads, 1995) and the NET-SNMP
framework (NET-SNMP, 2002). A more detailed
view of the agent’s architecture is shown in figure 6.
The PTSL manager thread is responsible for integrat-
ing the Script MIB and the PTSL core. It updates
the structures used by the PTSL core every time a
new trace is programmed to be monitored or an ex-
isting trace is deleted (as no longer necessary). Three
other threads – queue, PTSL engine and APM – oper-
ate in a producer/consumer fashion. The first captures
all the packets arriving at the network interface card
using the libpcap library and adds them to a circu-
lar queue. Although this library supports filter spec-
ification with the BPF (BSD Packet Filter) notation
(Mccanne and Jacobson, 1993), the agent is not us-
ing this feature. The second thread processes each
packet in the queue without deleting it, aiming to ver-
ify whether it has the expected features to allow one
or more traces to evolve in the state machine. If so,
the packet is marked. The APM thread, in turn, re-
moves each packet from the queue and, according to
the marks and configured reports, updates a memory-
based data structure. As soon as the monitoring inter-
val of a report is over, the information in the memory
is processed and the results are stored in a database
(mySQL). This database is queried by an extension to
the NET-SNMP agent that implements the short APM
MIB.
Figure 6: Agent’s internal architecture
Regarding security, the agent supports all
capabilities of the SNMPv3 protocol, in-
cluding models USM (User-based Security
Model) (Blumenthal and Wijnen, 1999) and
VACM (View-based Access Control Model)
(Wijnen et al., 1999). Their use prevents unau-
thorized people from reconfiguring the agent.
5 EXAMPLES OF USE FOR THE
AGENT
Monitoring the response time of protocol, service and
networked application interactions is a rather relevant
task when these programs are used to support critical
operations, which require high availability and perfor-
mance. Several scenarios can be used to illustrate the
need to warrant such requirements. Two are shown
below: application service providers and corporate
networks.
5.1 Application Service Providers
Application service providers must warrant 24-hour-
a-day, 7-day-a-week access to users/clients. Given the
extreme competition between companies that offer
similar hosting services, high availability ought to be
accompanied by low response time. Companies that
hire hosting services to make sure their users/clients
have efficient access to sites, portals and so on (within
hired specifications of quality) depend on applications
that monitor actual accesses. In this scenario, the
agent we present can be used by the provider and/or
PERFORMANCE MEASUREMENT OF TRANSACTION-BASED INTERNET APPLICATIONS THROUGH SNMP
17

Figure 7: Monitoring a hosting environment
the internal network of some users/clients. Regardless
of the location of the agent, the party hiring the host-
ing service can remotely configure the traces and re-
ports desired, and retrieve results likewise with some
management tool that supports SNMP (see figure 7).
5.2 Corporate Networks
The corporate network environment is another recom-
mended scenario for monitoring the response time of
protocol, service and networked application interac-
tions. Within that environment, not only sites and por-
tals (e.g. intranet), but also essential services such as
DNS and POP should have their response times mea-
sured, as well as applications of the organization.
Figure 8 illustrates a real management scenario.
The router, through a serial interface, is the link to
the Internet. Besides the serial interface, the router
features two Ethernet interfaces. The first one is con-
nected to a hub, which is linked to two stations: one
hosts DNS and the other hosts POP. The second inter-
face of the router is linked to a station with two net-
work interfaces. It runs a firewall and therefore repre-
sents the borderline between the internal and external
networks. Linked to the other interface of the firewall
(internal interface) is a hub. The web server respon-
sible for the Intranet of the organization and a switch
that segments the internal network into several sub-
networks are linked to it. The other equipment (blank
in the figure) are the management station and two sta-
tions dedicated to the monitoring task.
In order to monitor response time of accesses to
the Intranet server, agent MA
1
must be configured
with traces such as Successful HTTP request, illus-
trated in figure 1. Likewise, agent MA
2
must be pro-
grammed with traces such as POP3 - User identifica-
tion, POP3 - Authentication by password and Name
resolution request to monitor the response time of ac-
cesses to POP and DNS servers. After traces are con-
figured, interaction with the agents through the APM
MIB is needed to request the generation of perfor-
mance reports (creation of one or more entries in table
apmAppReportControl, presented in subsection
3.2). Results can be later obtained by querying table
apmAppReport.
6 CONCLUSIONS AND FUTURE
WORK
This paper has presented an agent to monitor response
time of protocol interactions that, unlike the available
solutions, combines together two essential features:
uses the technique of passive monitoring of network
traffic and stores resulting statistics in an SNMP-
compatible management information base. Sections
2 and 3 presented PTSL, a language used to specify
the protocol interactions to be monitored, and then
the short APM MIB, interface of the manager with
the agent-generated performance statistics. The inter-
nal architecture of the agent and some samples of its
usage were explained in sections 4 and 5.
Regarding the APM MIB originally proposed in
(Waldbusser, 2002), it should be stressed that it has
been under standardization for at least four years and
presentes several divergent points. The original MIB
is lengthy and hard to implement, much due to the
support to many kinds of applications (transaction,
throughput and streaming-oriented). It is also limited
regarding monitorable transactions. A documenta-
tion that is also under standardization (Bierman et al.,
2002) defines well known and spread protocol trans-
actions that APM agents should support. However,
the most important applications for organizations are
proprietary and usually developed within the com-
panies themselves. These applications will never be
registered as standard and APM agent manufacturers
will hardly be able to include support to them in their
products. These limitations led to MIB adaptations,
simplifying it to support a specific class of applica-
tions – transaction-oriented – and replacing the iden-
tification mechanism of transactions to be monitored
with a much more flexible one, which the network
manager can configure with PTSL.
The expression power of PTSL should be high-
lighted. This language allows the specification of pro-
tocol interactions at network, transport and applica-
tion layers. Also, unlike existing solutions, it allows
modeling interactions of both conventional protocols
and organization’s applications. In order to spec-
ify transactions related to encrypted protocols (e.g.
Secure Electronic Transaction), traces are described
ICETE 2004 - SECURITY AND RELIABILITY IN INFORMATION SYSTEMS AND NETWORKS
18

Figure 8: Monitoring a corporate environment
similarly. However, the agent will have to be remod-
eled so as to intercept and decode observed messages.
Although the approach based on the passive moni-
toring of network traffic is the least invasive, it has a
greater computational cost. Measurements performed
by our research group allowed us to detect that the
low packet-processing capacity of the agent is due
to the broad use of a data base (mySQL) to consol-
idate performance-related statistics. From that ob-
servation, the first implementation of the agent has
been redesigned to substitute database for memory
data structures. Among structures considered, hash
tables were the most appropriate because they allow
fast input and update of elements. At present, there
is an ongoing project to gradually implement the de-
signed changes.
REFERENCES
Aprisma (2002). Aprisma Technologies Homepage.
http://www.aprisma.com/.
Bierman, A., Bucci, C., Dietz, R., and Warth, A. (2002).
Remote Network Monitoring MIB Protocol Identifier
Reference Extensions. RFC 3395.
Blumenthal, U. and Wijnen, B. (1999). User-based Secu-
rity Model (USM) for version 3 of the Simple Network
Management Protocol (SNMPv3). RFC 2574.
Candle (2002). Candle Corporation Homepage.
http://www.candle.com.
Concord (2002). Concord Communications Inc. Homepage.
http://www.concord.com.
Gaspary, L., Balbinot, L. F., Storch, R., Wendt, F., and
Tarouco, L. (2001). Uma arquitetura para gerencia-
mento distribu
´
ıdo e flex
´
ıvel de protocolos de alto n
´
ıvel
e servic¸os de rede. In IXX Simp
´
osio Brasileiro de Re-
des de Computadores.
Gaspary, L., Meneghetti, E., Wendt, F., Braga, L., Storch,
R., and Tarouco, L. (2002). Trace: An open plat-
form for high-layer protocolos, services and net-
worked applications management. In Proc. of the
VIII IEEE/IFIP Network Operations and Management
Symposium, pages 871–873.
Levi, D. and Sch
¨
onw
¨
alder, J. (2001). Definitions of
Managed Objects for the Delegation of Management
Scripts. RFC 3165.
Lucent (2002). Lucent Technologies Homepage.
http://www.lucent.com/.
Mccanne, S. and Jacobson, V. (1993). The bsd packet filter:
A new architecture for user-level packet capture. In
Proc. of the USENIX CONFERENCE, pages 259–269.
NET-SNMP (2002). NET-SNMP Project Homepage.
http://net-snmp.sourceforge.net/.
NetIQ (2002). NetIQ Corporation Homepage.
http://www.netiq.com/.
NetScout (2002). NetScout Systems, Inc. Homepage.
http://www.netscout.com/.
Pthreads (1995). Pthreads: POSIX threads standard. IEEE
Std 1003.1c-1995.
Sturm, R. (1999). Foundations of Application Management.
John Wiley & Sons.
Tivoli (2002). Tivoli Systems, Inc. Homepage.
http://www.tivoli.com.
Waldbusser, S. (2002). Application Performance Measure-
ment MIB. Internet Draft.
Wijnen, B., Presuhn, R., , and McCloghrie, K. (1999). View-
based Access Control Model (VACM) for the Simple
Network Management Protocol (SNMP). RFC 2575.
PERFORMANCE MEASUREMENT OF TRANSACTION-BASED INTERNET APPLICATIONS THROUGH SNMP
19
