
LINGUISTIC DESCRIPTION OF PATTERNS FROM MINED
IMAGES
Hema Nair
Faculty of Engineering and Technology, Multimedia University, Jln. Ayer Keroh Lama, Melaka 75450, Malaysia
Ian Chai
Faculty of Engineering, Multimedia University, Jln. Multimedia, 63100 Cyberjaya, Selangor, Malaysia
Keywords: Linguistic summary, data mining, fuzzy logic, genetic algorithm, remote-sensed image.
Abstract: The objective of this paper is to propose an approach to describe patterns in remote-sensed images utilising
fuzzy logic. The general form of a linguistically quantified proposition is “QY’s are F” where Q is a fuzzy
linguistic quantifier, Y is a class of objects and F is a summary that applies to that class. The truth of such a
proposition can be determined for each object characterised by a tuple in the database. Fuzzy descriptions of
linguistic summaries help to evaluate the degree to which a summary describes an object or pattern in the
image. A genetic algorithm technique is used to obtain optimal solutions that describe all the objects or
patterns in the database. Image mining is used to extract unusual patterns from multi-dated satellite images of
a geographic area.
1 INTRODUCTION
In the past, research has focussed on data mining or
extracting implicit patterns in relational databases
(Nair, 1994), (Nair, 2003), (Motro, 1994), (Yager,
1991), (Kacprzyk, Ziolkowski, 1986), but data
mining in multimedia environment has met with
limited success. This is mainly due to the fact that
multimedia data is not as structured as relational data
(Zaine et al., 1998). There is also the issue of diverse
multimedia types such as images, sound, video etc.
While one method of data mining may find success
with one type of multimedia such as images, the same
method may not be well-suited to many other types of
multimedia due to varying structure and content.
Some related work (Zaine et al., 1998) has met with
success. In (Zaine et al., 1998), the objective is to
mine internet-based image and video. The results
generated could be a set of characteristic features
based on a topic (keyword), a set of association rules
which associate data items, a set of comparison
characteristics that contrast different sets of data, or
classification of data using keywords. Data mining
techniques can be used in image mining
(Thuraisingham, 2001) to classify, cluster or
associate images. Image mining is an area with
applications in many domains including space images
and geological images.
This paper proposes an approach that utilises fuzzy
logic to describe patterns in remote-sensed images.
This method aims to extract some feature descriptors
such as area, length etc., of objects in remote-sensed
images and store them in a relational table. Data
mining techniques that employ genetic algorithms are
then used to develop the most suitable linguistic
summary of each object/pattern stored in the table.
Image mining is used to detect unusual patterns such
as forest or field fires in SPOT Multispectral satellite
images of the same geographic area on two different
dates separated by a considerable time interval. The
objective is to generate linguistic summaries of these
and other natural patterns in remote-sensed images.
The approach is to use fuzzy logic to match actual
image feature descriptors with feature definitions and
to evolve the best-suited linguistic summary of the
image object/pattern using genetic algorithms.
Genetic algorithms are parallel, mathematical search
procedures inspired by Darwinian genetic theories of
natural selection (Filho et al., 1994). These
algorithms apply genetically-inspired operators such
as selection, cross-over, and mutation to populations
of potential solutions in an iterative manner, creating
new populations while searching for an optimal
77
Nair H. and Chai I. (2004).
LINGUISTIC DESCRIPTION OF PATTERNS FROM MINED IMAGES.
In Proceedings of the Sixth International Conference on Enterprise Information Systems, pages 77-83
DOI: 10.5220/0002595900770083
Copyright
c
SciTePress
solution to the problem at hand. Many points in the
solution space are searched in parallel.
This paper is organised as follows. Section 2
describes the system architecture, section 3 describes
the approach, section 4 discusses the implementation
issues, and section 5 discusses the conclusions and
future work.
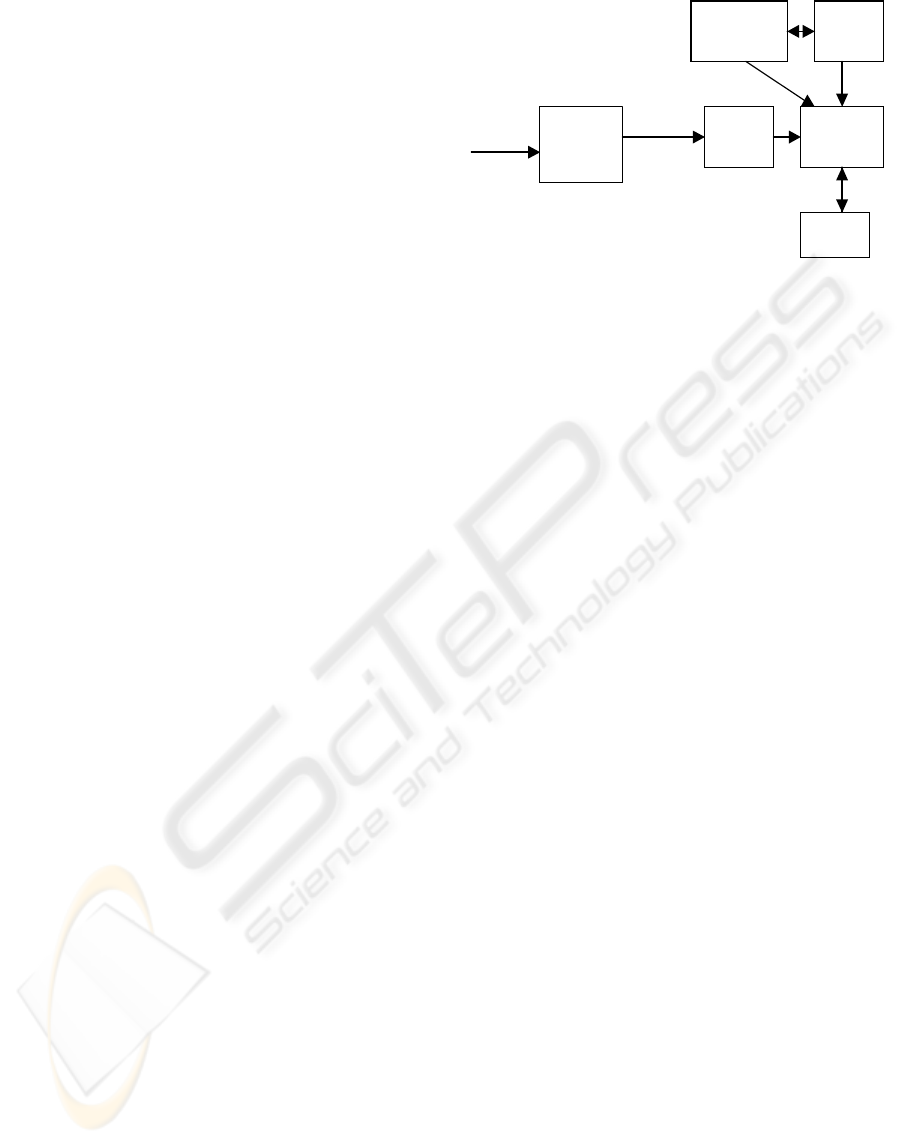
2 SYSTEM ARCHITECTURE
The system architecture is shown in Figure 1. The
data summariser is the key component of the system.
The input image is analysed and feature descriptors
extracted by the image analysis component. Feature
descriptors are extracted using MATLAB (The
Mathworks Inc, 1997) and ENVI (Research Systems
Inc, 1997) which perform the functionality of the
image analysis component. These descriptors are
stored thereafter in a relational table in the database.
The knowledge base uses geographic facts to define
feature descriptors in a typical remote-sensed image.
It interacts with a built-in library of linguistic labels.
As new feature definitions are added into the
knowledge base, corresponding linguistic labels are
added in the built-in library. Likewise, in order to
expand the built-in library, corresponding feature
definitions based on geographic facts have to be
added in the knowledge base. The built-in library also
interacts with the summariser as it supplies the
necessary labels to it. The summariser receives input
from the database and the knowledge base. It
performs a comparison between actual feature
descriptors of the image stored in the database with
the feature definitions stored in the knowledge base.
The summariser then finds a valid optimal linguistic
summary for the data by interaction with the engine
(genetic algorithm). The linguistic summary would
be optimal in the sense that the linguistic label would
be the most suitable one to describe the object or
pattern. The GA evolves the most suitable solution to
the problem and passes it back to the summariser
which translates this solution into its corresponding
linguistic summary. Thus, this system is composed of
two subsystems at this stage. The feature descriptor
extraction using MATLAB and ENVI is a manual
subsystem involving user interaction. After
descriptors are extracted and stored in a relational
table in the database, the automated subsystem
consisting of summariser, knowledge base, library
and engine evaluate the descriptors and compare
them with feature definitions. An optimal linguistic
summary of each object is then generated
automatically.
Figure 1: System Architecture
3 APPROACH
The following assumptions are made regarding the
data model. R is a relational table defined as:
R(A
1
,A
2
,...,A
i
,...,A
n
)
A
1
,A
2
,...A
n
are the attributes in the table R (i.e. the
columns of the relational table).
t
1
,t
2
,...,t
k
are the tuples or records or entries in the
table R (i.e. the rows of the relational table).
A fuzzy set is the most natural representation of a
linguistic variable. A linguistic variable is one whose
value is not a number but a word or a sentence in a
natural language (Mendel, 2001). In order to
generate linguistic summaries of objects, some fuzzy
sets are defined that represent our notion of what the
object description or summary should look like.
The general form of a linguistically quantified
proposition is “QY’s are F” where Q is a fuzzy
linguistic quantifier, Y is a class of objects and F is a
summary that applies to that class. F is defined as a
fuzzy set in Y. Q represents a linguistic quantifier that
groups objects in the class Y. An object/pattern in the
image is characterised by a single tuple in our
database, therefore, we can ignore Q in this analysis.
An example of such a linguistically quantified
proposition in the domain of remote-sensed images
would be as follows:
Island is moderately large.
In the above example, Y is Island and F is moderately
large. In terms of linguistics, this description is
equivalent to:
Moderately large island.
The objects/patterns considered are river, expanse of
water(other water body which is not river), land and
island. The attributes of the objects that are used to
develop their linguistic summaries are :
Input Image
Image
Analysis &
Feature
Extraction
Feature
descriptors
Database Summarise
r
Knowledge
base
Library
Engine
ICEIS 2004 - ARTIFICIAL INTELLIGENCE AND DECISION SUPPORT SYSTEMS
78

1. Area
2. Length
3. Location in image
4. Addition information
Area, length and location (X, Y co-ordinates in image)
are extracted by user interaction using the image
analysis component in Figure 1. For river, the most
significant feature descriptor that is extracted is its
length. For land, island and expanse of water, the
most significant feature descriptor extracted is area.
If
Y = y
1
,y
2
,...y
p
(1)
then
truth(y
i
is F) = µ
F
(y
i
) : i = 1,2,...,p, (2)
where µ
F
(y
i
) is the degree of membership of y
i
in
the fuzzy set F and 0 ≤ µ
F
(y
i
) ≤ 1. The higher the
degree of membership, the higher the truth value of
the linguistic proposition. In our case, referring to
equations (1) and (2), y
i
could be island or area of
land or expanse of water or river. Area of land
represents land other than island, expanse of water
represents any water body that is not a river. For each
object y
i
, the degree of membership of its feature
descriptor such as area or length in corresponding
fuzzy sets is calculated. Fuzzy sets for area are
large,
considerably large, moderately large, fairly large
and small and fuzzy sets for length are long,
considerably long, relatively long, fairly long and
short.
The linguistic description is calculated as follows:
T
j
=m
1j
∧m
2j
∧m
3j
...∧m
nj
(3)
where m
ij
is the matching degree (Kacprzyk,
Ziolkowski, 1986) of the ith attribute in the jth tuple.
m
ij
∈[0,1] is a measure of degree of membership of
the ith attribute value in a fuzzy set denoted by a
fuzzy label. Referring to equation (3), T
j
thus
evaluates the truth value for
each object y
i
, as it
matches the feature descriptors of that object with
fuzzy set definitions by calculating the matching
degrees and combining them together using logical
AND operator. The logical AND (∧) of matching
degrees is calculated as the minimum of the matching
degrees (Kacprzyk, Ziolkowski, 1986).
(4)
Equation (4) means that the conjunction of only those
matching degrees that are non-zero is calculated in
order to evaluate T
j
. This aids in computational
efficiency. All such T
j
’s are added up to evaluate T. T
is a numeric value that represents the truth of the
overall summary of the objects in the database.
4 IMPLEMENTATION ISSUES
This section explains the genetic algorithm approach
and then discusses the results from applying this
approach to mining images.
4.1 GA Approach
A genetic algorithm emulates biological evolutionary
theories as it attempts to solve optimisation problems.
The GA comprises of a set of individual elements (the
population) and a set of biologically inspired
operators such as selection, cross-over and mutation.
According to evolutionary theories, only the most
suited elements in a population are likely to survive
and generate offspring, thus transmitting their
biological heredity to new generations. In computing
terms, a genetic algorithm maps a problem onto a set
of binary strings (the population); each string
representing a potential solution. Using selection,
cross-over and mutation operators, the GA then
manipulates the most promising strings (denoted by
their high fitness value from the evaluation function),
as it searches for the best solution to the problem
(Filho et al., 1994), (Smith et al., 1994), (Goodman,
1996).
Given n attributes, each having m possible fuzzy
labels, it is possible to generate m
n
+1 descriptions.
The GA searches for a optimal solution among these
descriptions. Each of these summaries is represented
by a uniquely coded chromosome string (a string of
0’s and 1’s). The population of such strings is
manipulated and evaluated by the GA and the most
suitable linguistic summary that fits each object is
generated. The evaluation function for the linguistic
summary or description is
f = max(T), (5)
where T in equation (5) is evaluated as shown in the
previous section and f is the maximum fitness value
of a particular linguistic summary or description that
has evolved over several generations of the GA.
4.2 Results
In general, image objects are classified at the highest
level into land and water. Land is further classified
into island and other land. Water is further classified
into river (characterised by its length) and other water
body (characterised by area). Fire is considered as a
separate pattern identified by its bluish white smoke
plume. Some of the fuzzy sets being considered are :
1. For Island or land: Large, Considerably large,
Moderately large, Fairly large and Small based on
degree of membership of area of the land in the
respective fuzzy sets.
T = T
j
,∀m
ij
≠
0
Σ
k
j=1
LINGUISTIC DESCRIPTION OF PATTERNS FROM MINED IMAGES
79
2. For Other Water Body: Large, Considerably large,
Moderately large, Fairly large and Small based on
degree of membership of area of the water body in the
respective fuzzy sets.
3. For River: Long, Considerably long, Relatively
long, Fairly long and Short based on degree of
membership of length of the river in the respective
fuzzy sets.
These fuzzy sets are defined based on geographic
facts such as:
• Largest continent is Asia with area of
44579000 km
2
.
• Largest freshwater lake is Lake Superior
with area of 82103 km
2
.
• Smallest continent is Australia/Oceania with
area of 7687000 km
2
.
• Longest river is the Nile with length 6669
km
• Shortest river is the Roe with length 0.037
km
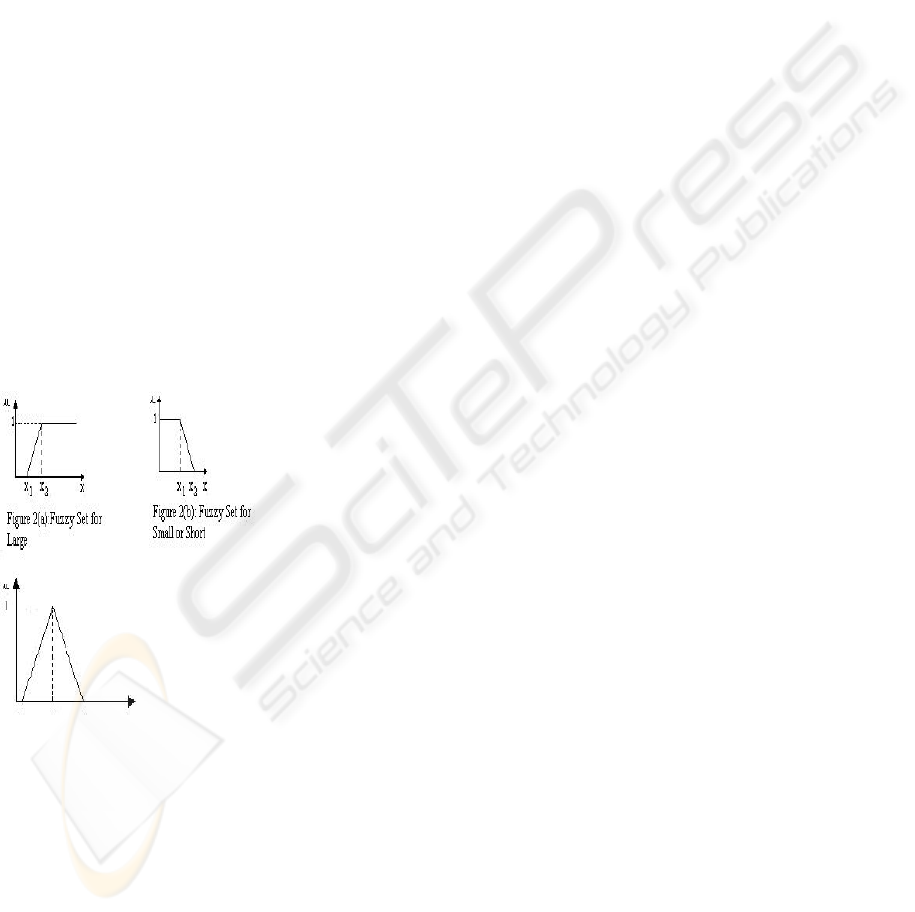
The fuzzy set for large expanse of water is defined in
equation (6) referring to Figure 2(a), where x
1
=
79900 km
2
, x
2
= 82103 km
2
.
µ
large expanse of water
(x)=1, for 82103≤ x
=x/2203 – 36.27, for 79900≤ x <82103
=0, x< 79900 (6)
The fuzzy set for fairly large expanse of water is
defined in equation (7) referring to Figure 3, where
x
1
= 100 km
2
, x
2
= 1000 km
2
, x
3
= 28034.33 km
2
.
µ
fairly large expanse of water
(x)
=1-(1000-x)/900, for 100≤x≤ 1000
=1-(x-1000)/27034.33, for
1000<x≤28034.33
=0, x< 100
=0, x> 28034.33
(7)
The fuzzy set for small expanse of water is defined in
equation (8) referring to Figure 2(b).
µ
small expanse of water
(x) = 1, 0<x≤ 600
=-x/400 + 2.5, for 600<x≤1000
= 0 otherwise
(8)
The set for small area of land is defined in equation
(9) referring to Figure 2(b).
µ
small area of land
(x) = 1, 0<x≤ 7687000
=-x/313000 + 25.56, for 7687000<x≤8000000
= 0 otherwise
(9)
The fuzzy set for short river is defined in equation
(10) referring to Figure 2(b)
µ
short river
(x
) = 1, 0<x≤50
=-0.1x + 6, for 50<x≤60
= 0 otherwise (10)
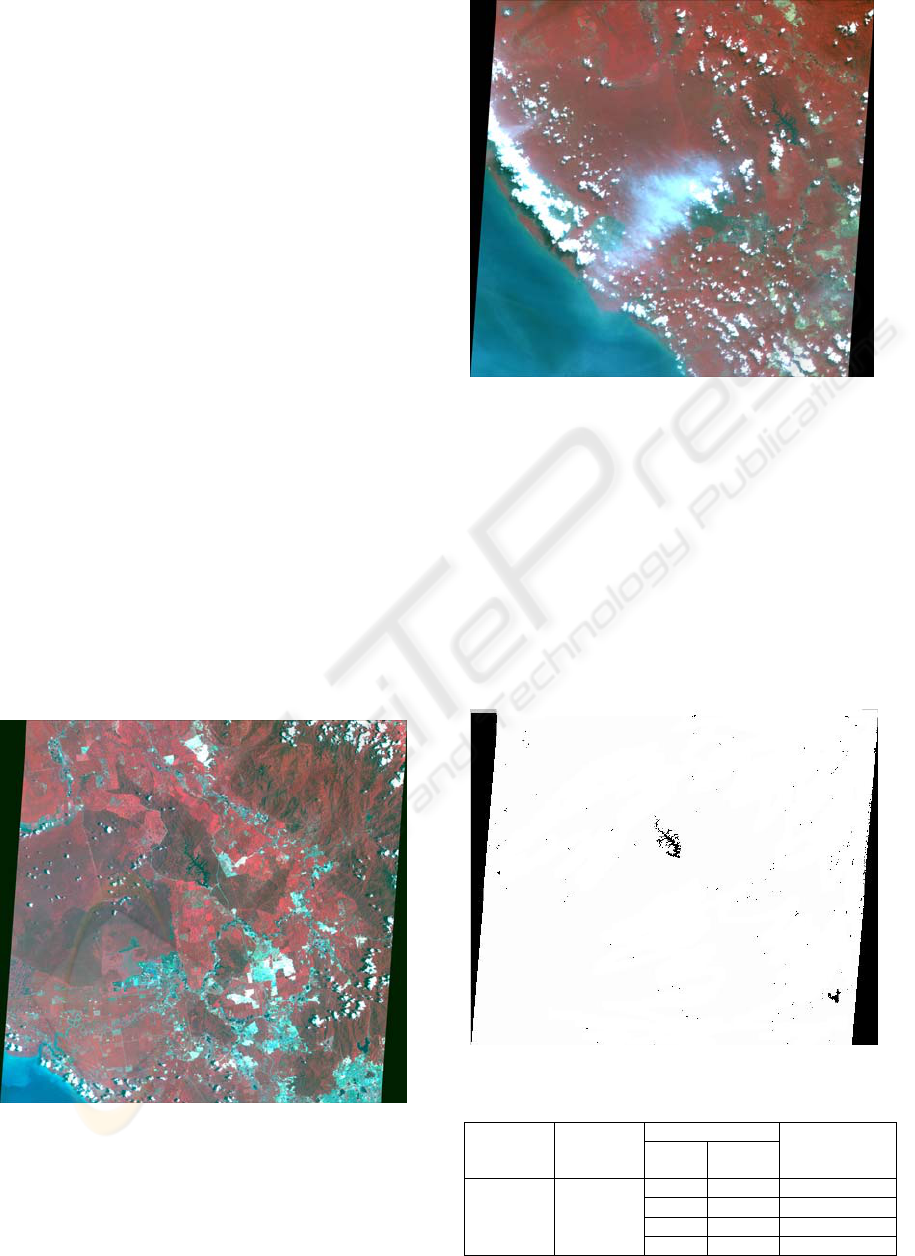
An example pair of SPOT Multispectral images to be
analysed is shown in Figure 4 and Figure 5. Figure 6
shows a binary thresholded image for Figure 4. The
geographic co-ordinates of the image are
approximately 3º17'U-3º48'U latitude and
100º58'T-101º38'T longitude referring to the
topographic map. The scale of the image is
approximately 1: 0.0003764. This means that 1 pixel
square represents 0.0003764 km
2
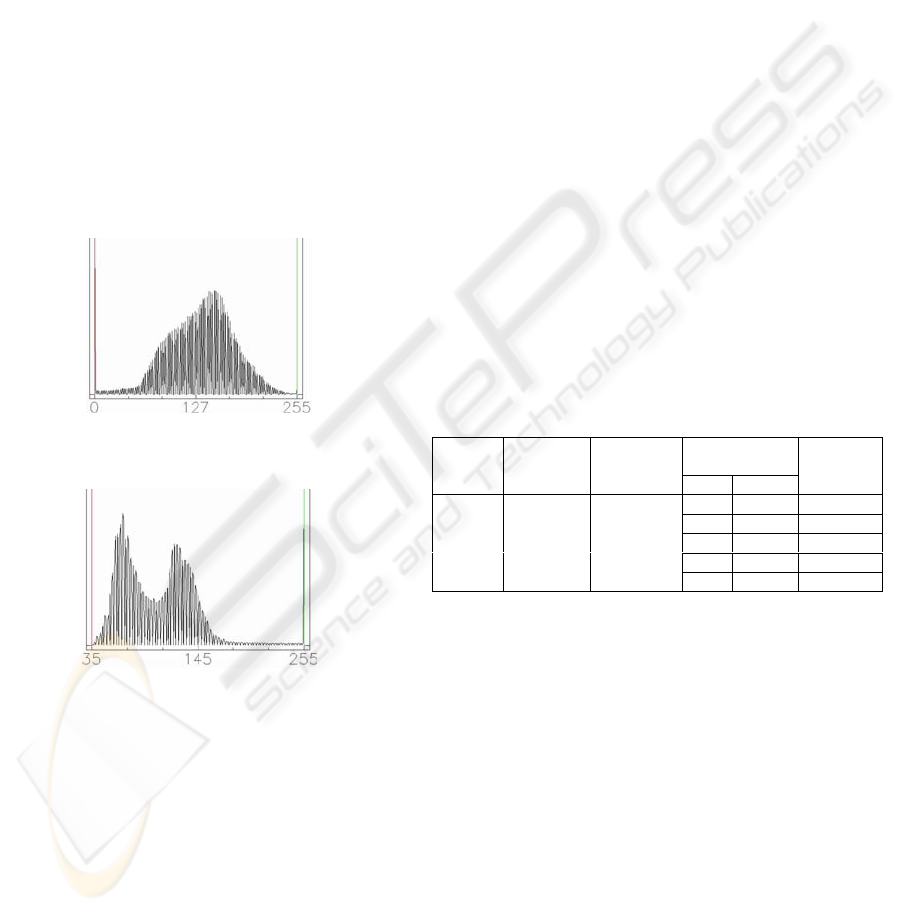
. Figure 7 shows the
histogram of the image without fire at the location
where the fire is later detected. Figure 8 shows
histogram of the image with fire at the location of fire.
Comparing the histograms in Figures 7 and 8, it can
be seen that most of the pixels are of lower intensity
near the burnt scar next to the bluish white smoke
plume in the image (Figure 5). Tables 1 and 2 show
small sample data sets of feature descriptors extracted
from some of the objects in the images(Figures 4 and
5 respectively). Area is in km
2
and length in km.
Additional information attribute denotes numbers as
follows : 0 = River, 1 = Other Water Body, 3 = Other
Land, 4 = Fire. Location indicates X,Y co-ordinates
of centroid of object. X,Y = 0 indicates the remaining
part of image as location. The grey level values are
Figure 3: Fuzzy Sets for Considerably large or
Moderately large or Fairly large
ICEIS 2004 - ARTIFICIAL INTELLIGENCE AND DECISION SUPPORT SYSTEMS
80
from the R-Band as this band shows all the patterns
clearly. River is characterised by length(its most
significant dimension), its area is considered
negligible in the calculations when compared to its
length, and therefore its area is set to 0. Likewise, for
other objects where area is considered as the most
significant parameter in calculations, their length is
ignored and set to 0. The degree of membership in
the fuzzy sets for area and length given in Table 1 and
Table 2 are calculated.
The location attribute is given a linguistic value such
as centre, left, top left etc., using the following
calculation. Centre-span is a variable defined in
order to denote a circular distance around the X, Y
co-ordinates of the centre of an image. The value of
centre-span may vary from image to image as it is
subjective. It is a number that is obtained by
measuring the distance around the centre of the image,
which can be used to denote an area that still
represents the centre of the overall image. This value
is evaluated by user-interaction with the image. All
objects, whose centroids (Buckles et al., 1996) lie
within the range of centre-span from the centre of the
image, are still located at the centre of the image. If
the difference between X, Y co-ordinates of the
centroid of the object and the centre of the image is
greater than centre-span, then the object is located at
lower right (diagonally from image centre). If the
reverse is true, then the object is located at top left
(diagonally from image centre). If the difference
between X co-ordinate
Figure 4: Image of area in peninsular Malaysia on March 6,
1998
Figure 5: Image of area in peninsular Malaysia on July 10,
2001, showing fire on the left.
of the object and the X co-ordinate of image centre is
greater than centre-span and the difference between
Y co-ordinate of image centre and the Y co-ordinate
of centroid of the object is greater than centre-span,
then object is located at the top right of the image.
Similar calculations are used to evaluate the locations
lower left, right, left, top and bottom of image. An X,
Y co-ordinate of 0, 0 evaluates the location as
remainder of image.
It is to be noted that patterns such as urban area
settlements are ignored as trivial in this analysis.
Figure 6: Binary image corresponding to Figure 4.
Table 1: Feature descriptors of some patterns from Figure 4
Location in image Grey level
value (R
Band)
Approximate
Area
X Y
Additional
information
150 3300.84 1606 1457 3
0 2.2275 2856 2566 1
0 6.683 1546 1132 1
0 68.54 0 0 1
LINGUISTIC DESCRIPTION OF PATTERNS FROM MINED IMAGES
81
The main concerns are natural patterns such as water
bodies, land, and also extracting patterns that signal
natural calamities such as fires.
The objective of this paper is to describe
patterns/objects such as river, land, island, expanse of
water etc quantitatively in terms of measures such as
area or length. The additional information attribute is
added in the tables by visual inspection of the images.
Thus, the current work is not concerned with
identifying these patterns automatically.
Pre-segmented images have been used for this
purpose. Future work (Section 5) will focus on this
aspect of identification.
The linguistic summaries are generated with
reference to the scale of land and water defined in the
geographic facts from which the fuzzy sets are
developed, even though the area of land in the images
may appear to be large compared to the expanse of
water.
Figure 7: Histogram of Figure 4 near the location where
fire is later detected.
Figure 8 : Histogram of Figure 5 at the location of burnt
scar near the fire.
The GA is run with following input parameter set.
These parameter values are set after several trial runs.
With other values, the GA produces the summary of
only one or two object/patterns in the table:
1. Number of bits in a chromosome string of the
population = 10
2. Generations per cycle = 26
3. Population size = 200 strings
4. Probability of cross-over = 0.53
5. Probability of mutation = 0.001
After 208 generations, the linguistic summaries
generated from the image in Figure 4(no fire) are :
• A small area of land at the centre.
• A small expanse of water at the lower right
• A small expanse of water at the centre.
• A small expanse of water in the remaining part
of the image.
The GA input parameters are varied to obtain the
linguistic summaries of patterns of the image in
Figure 5(with fire). The parameters used are:
1. Number of bits in a chromosome string of the
population = 10
2. Generations per cycle = 10
3. Population size = 200 strings
4. Probability of cross-over = 0.53
5. Probability of mutation = 0.001
After 80 generations, the linguistic summaries
generated from the image in Figure 5 are :
• Bluish white smoke indicating fire
at the left
• A small expanse of water in the
remaining part of the image
• A small expanse of water at the top
right
• A small area of land at the centre
Table 2: Feature descriptors of some patterns from Figure 5
After 88 generations and generations per cycle set to
11, the following summaries are generated:
• Bluish white smoke indicating fire
at the left
• A short river at the top left
• A small expanse of water in the
remaining part of the image.
In each case it is worth noting that there is at least one
new pattern that has been extracted and described.
Thus comparing the results of the GA after mining
the images of the same geographic area without fire
and with fire taken on two dates separated by a period
of more than three years, it can be seen that that the
GA can correctly describe an unusual pattern such as
the fire indicated in the image in Figure 5. Referring
to the corresponding topographic map, it is possible
Location in
image
Grey level
Value
(R Band)
Approximate
Area
Approximate
Length
X Y
Additional
information
150 2874.38 0 1899 1150 3
166 0 0 1550 1587 4
65 0 47.5 355 237 0
27 6.683 0 2506 976 1
64 509.31 0 0 0 1
ICEIS 2004 - ARTIFICIAL INTELLIGENCE AND DECISION SUPPORT SYSTEMS
82

to conclude that this fire could be the result of
burning in a paddy field or a nearby primary forest.
Thus, with two attributes such as length and area,
each having five possible fuzzy labels, it is possible
to generate 5
2
+1 descriptions. The GA has searched
for an optimal solution among these descriptions
within a very short time.
5 CONCLUSIONS AND FUTURE
WORK
This paper has presented a new approach to
describing patterns in images using linguistic
summaries that use fuzzy labels. A genetic algorithm
technique has been employed to evolve the most
suitable linguistic summary that describes each
object/pattern in the database. Image mining is used
to extract unusual patterns such as fire in the same
geographic area from images collected over two
different dates. This method can be extended to an
array of images of the same geographic area, taken
over a period of several years, to describe many other
interesting and unusual patterns that emerge over
time.
Some directions for future work include:
1. Development and implementation of
clustering algorithms in order to evaluate
automatically the additional information
attribute in the tables. Currently
pre-segmented images are used.
2. Development of a user friendly tool with
graphical interface to ease the task of
extracting and calculating feature descriptors
such as area, length, gray level intensity,
colour etc., stored in the tables. Currently,
both MATLAB and ENVI are required in
order to populate the tables. Each has its own
limitations.
Acknowledgment: The authors wish to acknowledge
and express gratitude to Dr. B. S. D. Sagar for his
valuable advice in the domain of remote-sensing.
REFERENCES
Buckles, B.P, Petry, F.E, Prabhu, D, Lybanon,M., 1996.
Mesoscale Feature Labeling from Satellite Images. In
Genetic Algorithms for Pattern Recognition, eds.
Sankar K.Pal, Paul P. Wang, CRC Press, pp. 167-175.
Filho, J.L.R, Treleaven, P.C, Alippi, C., 1994. Genetic
Algorithm programming environments. In IEEE
Computer, pp.28-43.
Goodman, E,D., 1996. An Introduction to Galopps-the
Genetic ALgorithm Optimized for Portability and
Parallelism System(Release 3.2). Technical Report No.
96-07-01, Genetic Algorithms Research and
Applications Group, Michigan State University.
Kacprzyk, J , Ziolkowski, A., 1986. Database queries with
fuzzy linguistic quantifers. In IEEE Transactions on
Systems, Man and Cybernetics, pp. 474-479.
Mendel, J.M., 2001. Uncertain Rule-Based Fuzzy Logic
Systems: Introduction and New Directions, Prentice
Hall.
Motro, A., 1994 . Intensional Answers to Database Queries.
In IEEE Transactions on knowledge and data
engineering, pp. 444-454.
Nair, H, George, R, Srikanth, R, Warsi, N.A., 1994.
Intensional Answering in Databases-A Fuzzy Logic
Approach. In Proceedings of Joint Conference on
Information Systems.
Nair, H., 2003. Developing linguistic summaries of
patterns from mined images. In Proceedings of Fifth
International Conference on Advances in Pattern
Recognition, pp. 261-267.
Research Systems Inc.,1997. ENVI Version 3.0 User’s
Guide. Better Solutions Consulting.
Smith, R.E, Goldberg, D.E, Earickson, J.A., 1994.
SGA-C:A C-language implementation of a Simple
Genetic Algorithm. TCGA Report No.91002.
The Mathworks Inc.,1997. MATLAB Image Processing
Toolbox User's Guide.
Thuraisingham, B., 2001. Managing and Mining
Multimedia Databases, CRC Press.
Yager, R.R., 1991. On Linguistic Summaries of Data. In
Knowledge Discovery In Databases, eds. Gregory
Piatetsky-Shapiro and William J. Frawley , AAAI Press,
pp.347-363.
Zaine, O.R, Han, J, Li, Z.N, Hon, J., 1998. Mining
multimedia data. In CASCON'98, Meeting of Minds.
LINGUISTIC DESCRIPTION OF PATTERNS FROM MINED IMAGES
83
