
ANALYSIS AND CONFIGURATION METHODOLOGY FOR
VIDEO ON DEMAND SERVICES BASED ON MONITORING
INFORMATION AND PREDICTION
Xabiel G. Pañeda, David Melendi, Roberto García, Víctor García, Ángel Neira
Compurter Science Department,Oviedo University,Campus de Viesques, Xixón-Gijón, Asturies, Spain
Keywords: Methodology, streaming, video
, analysis, configuration, service
Abstract: This paper presents an analysis and configuration
methodology for video-on-demand services. Usually, two
entities take part in this kind of services: a network operator and a content provider. The former provides an
Internet connection and manages servers and proxies, whereas the latter generates the provided contents. All
their possibilities of configuration must be based on an accurate service behavioural analysis which
evaluates the quality and the quantity of resources, contents and subscribers. This analysis can be performed
using monitoring information and predictions of a near future behaviour established by managers. To
formalize both analysis and configuration, a methodology must be developed in order to help the service
managers to attain a good performance and at the same time, make a profit for their companies.
1 INTRODUCTION
The emergence of the World Wide Web has changed
the Internet world. This service has become a
powerful medium. Daily, an important number of
web accesses is produced and a huge volume of
information is delivered. The bandwidth increase in
subscribers’ access capabilities has given rise to the
appearance of a new complementary service: the
Internet video. There are two types of video services
on the Internet: live-video and video-on-demand. In
video-on-demand services, the user requests the
information at any time and the server delivers it in
exclusive. This system allows users to interact with
information and its behaviour is similar to a
videotape. Video services on the Internet are based
on streaming technology. The advantages of video
streaming and the expectations created in
subscribers are important. However, this technology
presents some problems. Video delivering consumes
an important bandwidth in the network and requires
a constant quality of service. To maintain this
quality under control and select the most interesting
contents, the use of a good analysis method is
fundamental. The analysis systems must provide the
necessary information to ensure the correct
configuration of the streaming service.
In this paper, an analysis and configuration
m
ethodology for video-on-demand services is
presented. The aim is to provide a useful tool to help
both the network operator and the content provider
in their configuration tasks.
The rest of the paper is organized as follows: In
sectio
n 2 other related work will be analysed. The
developed methodology will be described in section
3. Finally, conclusions will be presented in section 4.
2 RELATED WORK
Multimedia services analysis is a recent field in the
researching world. Until now, studies on this topic
have not been abundant. However, some studies on
streaming service analysis have appeared during the
last few years (Almeida, 2001) (Chesire, 2001).
Moreover, traffic analyses (Loguinov, 2001) and
workload generators (Jin, 2001) have been
published. One important aspect where some studies
have appeared is the metric design for video services
(Arias, 2002a). They have transformed the analyses,
which used the number of visits and the loss of
packets as the only metrics. In spite of these
innovations, these metrics are difficult to use in real
services because they are based on data which is not
provided by server logs.
This paper tries to compensate for the lack of
m
ethodologies for the analysis and configuration of
video-on-demand services, and is the second step in
289
G. Pañeda X., Melendi D., García R., García V. and Neira Á. (2004).
ANALYSIS AND CONFIGURATION METHODOLOGY FOR VIDEO ON DEMAND SERVICES BASED ON MONITORING INFORMATION AND
PREDICTION.
In Proceedings of the Sixth International Conference on Enterprise Information Systems, pages 289-294
DOI: 10.5220/0002596002890294
Copyright
c
SciTePress
a project of analysis, modelling and configuration of
video-on-demand services, being the first step a tool
presented in (Pañeda, 2003).
3 METHODOLOGY
DESCRIPTION
This methodology specifies: source data, goals,
analysis processes, analysis metrics and
configuration tasks.
3.1 Source Data
The source data needed to feed an accurate analysis
must be obtained from several entities. For example,
the content provider generates information about
contents such as title, theme, etc; on the other hand,
servers and proxies provide access information, such
as, delivered bytes, lost packets, etc. However, in
most of cases all the data is not available. The
methodology classifies services in six groups, based
on entities that provide source data. Table 1 shows
the proposed service classification. Data provided by
source entities can be quite abundant. However, the
minimum information necessary to generate an
accurate analysis is the following:
• Accesses: timestamp, time delivered, bytes
delivered, destination, origin, packet loss, buffer
reloads.
• Content: date, theme.
• Users: connection type.
• Devices: utilization of different elements (CPU,
memory, hard disk, licenses, etc).
• Network: exploitation and features in its
different sections.
Table 1: Service classification
Accesses Contents Users Networks Networks
Accesses Contents Devices Devices
Accesses Users
Accesses Users Contents
Accesses Accesses
Basic Content
Oriented
Service
Oriented
Resource
Oriented
User
Oriented
Complete
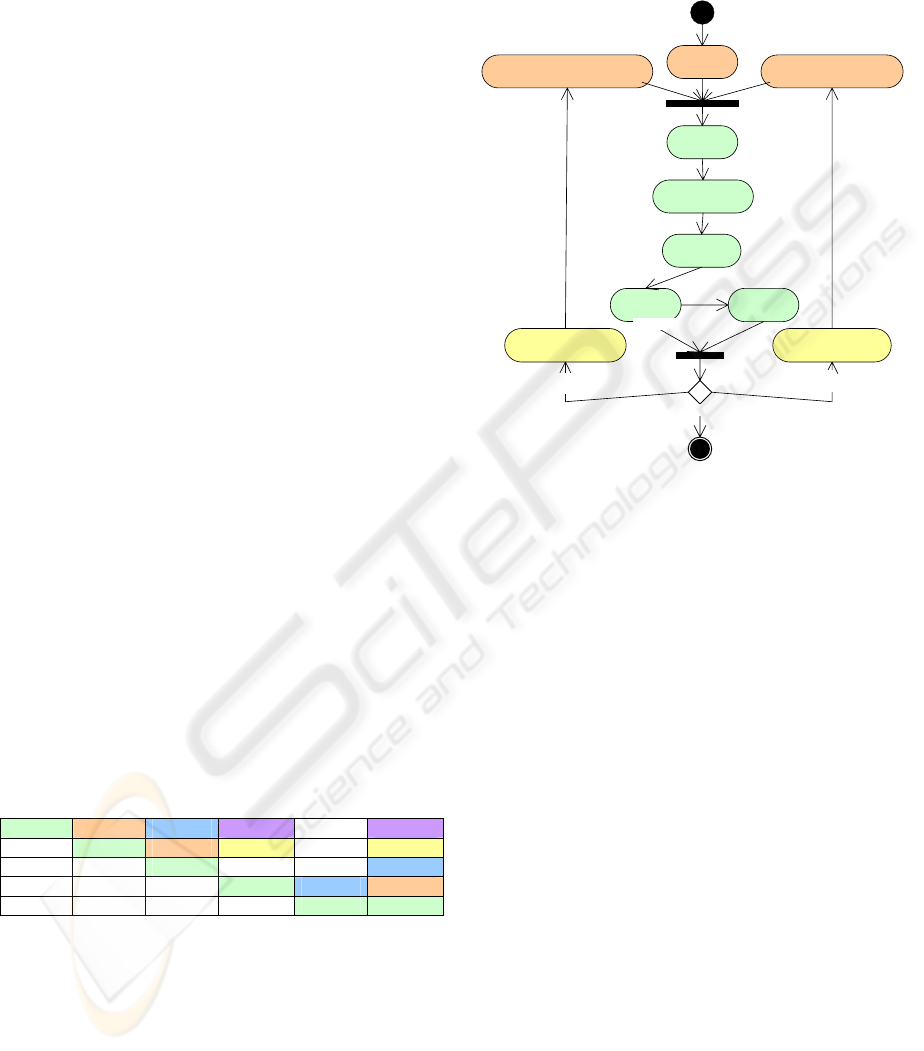
3.2 Application Process
The methodology application process, which is
shown in figure 1, is divided into three main tasks.
The first is the goals definition task where the targets
must be established. The second is the analysis task
where the system performance is evaluated in order
to extract the best configuration parameters. The
third is the configuration task where behavioural
parameters can be modified to improve the quality
of service.
Goals Definition
Basic Analysis
Goal Refinement for Content ProviderGoal Refinement for Communication Operator
Multidimensional Analysis
Results compilation
Conclusions
[Goals reached]
Preditions
Network Operator Configuration Content Provider Configuration
[There are still goals for
Content Provider]
[There are still goals for
Communications Operator]
[ Yes]
[ No additional anlysis]
Figure 1: Application process
The application process begins with the goals
definition task. At first, both network operator and
content provider must define the values of
performance which need to be reached. These goals
can be revised in the following process iteration if
necessary. However, once the process has started,
the modification of goals will be independent for
content provider and network operator, due to the
variability of their expectations. The evolution of the
process may require modifications both on the part
of the network operator and/or the content provider.
The next task is that of analysis, which is divided
into five phases. The first requires an important
number of basic analyses. This phase is subdivided
into four different parts: user analysis, quality
analysis, content analysis, and resource analysis.
Each analysis will be composed of several tests. The
results will be combined in the next phase to
perform multidimensional analyses and their results
will be compiled to obtain conclusions. To complete
the conclusions, another analysis based on
predictions will be developed, using models and
laboratory experiments to analyze alternative
situations different to the real ones.
When the conclusions indicate that the goals
have been achieved, the process concludes and a
new process can be started with new goals. If there
are still pending goals, the next task is configuration.
ICEIS 2004 - INFORMATION SYSTEMS ANALYSIS AND SPECIFICATION
290

Two independent parts, one for the network
operator and one for the content provider, form the
configuration task. The reason for this division is
because one must configure resources, and the other
one needs to configure contents. The network
operator part includes three parallel phases: network
resources configuration, computer resources
configuration and architecture service definition. On
the other hand, the content provider part includes
content creation and content modification.
3.3 Definition of Goals
The content provider goal is to earn profits through
the service. On the other hand, the communication
operator wants to obtain incomes from the content
provider, and the lowest resource consumption
possible. In all cases, the success of the service will
depend on the following parameters:
Number of reproductions. Obtaining many
reproductions means a greater interest on the part of
the users.
Number of different users. Obtaining a large
number of users expands the popularity of the
service.
Duration of reproductions. Providing
reproductions with 100% or more (backward jumps)
of video length means that users are satisfied with
both the provided information and its quality.
User’s loyalty and value. Building up a base of
loyal users is very important because they ensure a
constant number of reproductions.
Quality of reproductions. Achieving
reproductions without interruptions, with a clear
sound, etc, allows users to appreciate the contents
for their quality.
Resources consumption. A low resources
consumption (network, computers, software) is
important for the costs.
At the beginning of the methodology process,
values for some of these parameters need to be
fixed. When the values are reached a new process
will be started with new goals.
3.4 Analysis Metrics
The methodology also specifies a great variety of
metrics, such as: utilization percentage, user value,
delivered and received bytes, quality perceived, real
quality, etc. Some of them will be presented in
detail:
Metric of Interest
In order to evaluate user interest, which is
generated by the provided contents, the number of
different users’ requests is counted. When users
demand videos, they show their interest for the
offered information.
Metric of Success
To analyze the success of the service, the
delivery time of the video is measured.
Metric of Impact
This metric tries to analyze how the users have
received the delivered information. Its formula is the
following:
usersvisualicedimpactvideo ∗
=
%_
The metric of impact tries to establish the
success of the video, by using the percentage of
visualized video and the number of different users
who have reproduced it.
Metric of Perceived Quality Deterioration
Many of the problems produced during video
distribution can be corrected thanks to the client
reproduction buffer. However, when the packets
loaded in the buffer cannot compensate these
mistakes, the reproduction must be stopped to reload
it. That is the moment when the user detects the
problem. To evaluate it, a metric has been designed
to compare the time needed to reload the buffer with
the time of visualized video.
timevisualized
lengthreload
eriorationquality
_
_
det_ =
Sometimes, a more simplified metric can be used
by counting the number of reproductions with two or
more buffer reloads.
Metric of User Value
Calculating user value is quite a difficult task.
Experts in data mining do not agree on the method
of calculation. This methodology proposes two
possibilities, depending if the time of watched video
is considered more important than the number of
visualized videos or vice versa. In the first case, the
user value is evaluated through the time of delivered
video. In the second case, the number of visualized
videos is multiplied by the visualized percentage.
3.5 Basic Analysis
The basic analysis is divided into four parallel tasks.
Each task is carried out to analyze one element of
the whole system. So there are four tasks: users,
quality, content, and resource analysis. Each of them
ANALYSIS AND CONFIGURATION METHODOLOGY FOR VIDEO ON DEMAND SERVICES BASED ON
MONITORING INFORMATION AND PREDICTION
291

is composed of several tests. Some of them are listed
bellow:
3.5.1 Quality Analysis
Mistaken reproduction test (All types of services):
this test calculates the number and percentage of
reproductions with 0 second of visualized video. It is
used to know how many reproductions have been
erroneous.
Real quality reproduction test (All types of
services): this test calculates the number and the
percentage of reproductions with lost and delayed
packets.
Perceived reproduction quality test (All types
of services): this test analyzes the quality of
reproductions from the user’s point of view. It uses
the two metrics which have been defined in the
previous section for this purpose.
3.5.2 Resource Analysis
Bandwidth usage (Resource oriented and complete
services): this test analyzes the bandwidth consumed
in different points of the network which connects
user with servers. Moreover, the bandwidth usage in
the servers output and in the proxies input/output is
also analyzed.
Other tests such as: memory usage test, hard disk
usage test, CPU usage test are also defined.
3.5.3 Content Analysis
Success test (All types of services): by using the
metric presented in the previous section this test
evaluates the success of a video or a set of videos.
Impact test (All types of services): one of the
most important elements when a service is analyzed
is the impact which is produced in the public.
Length suitability test (All types of services):
this test tries to check if the selected length for the
videos is suitable. It is difficult to check if a video is
too short. However, this test enables us to know if a
video is too long. Thanks to the use of a
reproduction length histogram it is possible to know
if users watch the video until the end or not. Figure 2
shows the reproduction length histogram of a real
service. The histogram is a combination of two
distributions, one for users who are not very
interested and another for those who are very
interested. If the reproductions with problems are
deleted from the histogram, the length can be
checked using the weight of both distributions. If the
first distribution is heavier then the video is too long.
Otherwise the length is correct.
Figure 2: Length suitability
Other tests such: inter-arrival time, interest and
fast leaving are also defined.
3.5.4 User Analysis
Users value test (All types of services): by using
one of the metrics presented in the previous section,
this test evaluates the value of users. It helps
managers decide to the importance of a user or a
group of users.
Other tests such as: number of users, loyalty,
user connection quality and origin are also defined.
3.6 Multidimensional Analysis
Sometimes, cross analyses are necessary to achieve
more precision in the results. These analyses are
called multidimensional analyses and are performed
by merging basic analyses results and/or raw source
data. Some of them are the following:
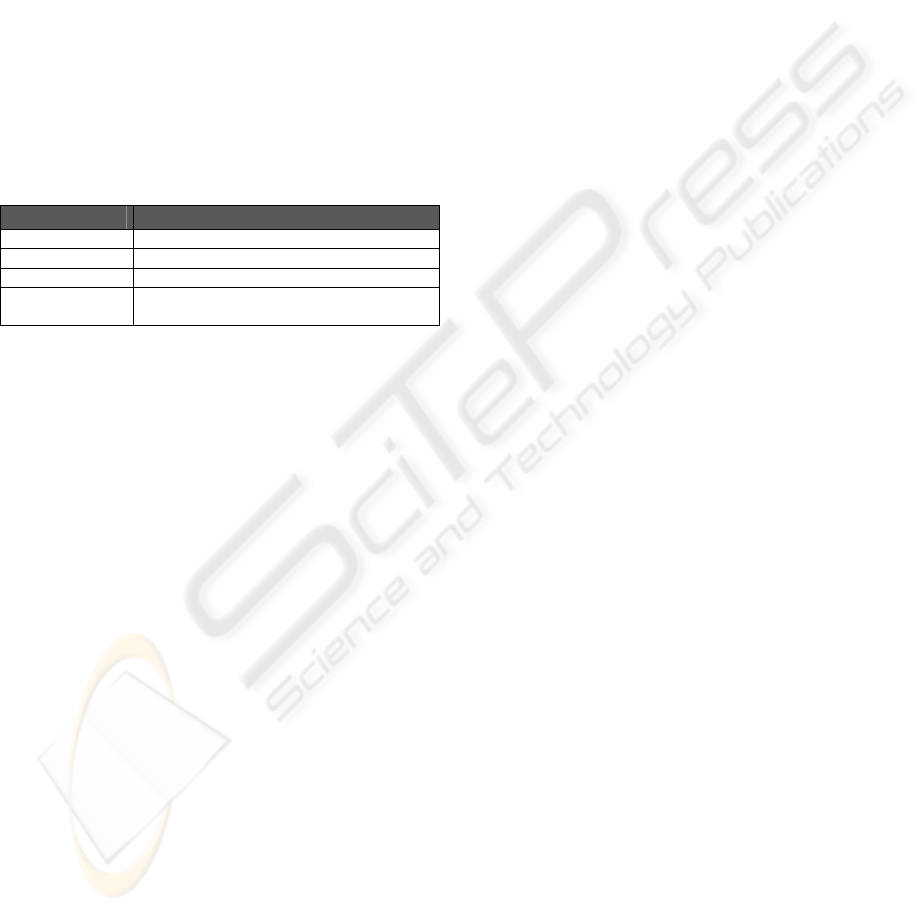
Table 2: Multidimensional tests
Test Goal
Theme / reproductions Theme selection
Theme / impact Theme approach
Origin / access Cache configuration
Access / connection type Quality selection
Connection t. / buffer reloads Quality selection
Origin / buffer reloads Quality selection
Origin/ packet lost Quality selection
Connection t. / packet lost Quality selection
User value / connection type Connection influence
User value / buffer reloads Delivery problems influence
User value / Origin Access provider influence
Contents produced/ reproductions Production influence
The obtained results are clustered to facilitate
their analysis.
3.7 Results Compilation
Results compilation is the process which is
responsible for coordinating all the results obtained
in the previous stages. By combining analysis test
results, several lists are created to help to reach
conclusions:
ICEIS 2004 - INFORMATION SYSTEMS ANALYSIS AND SPECIFICATION
292

List of themes ordered by clients’ preferences
with their most suitable length and quality: this
ordered list will be considered when new contents
have been generated. New videos will be created
with the suggested features, following the previously
established order.
List of Communication Operators with
delivering problems: this list will be important to
determine the distribution of the users who have
problems in receiving videos correctly.
List of bottlenecks in service architecture: it
will be necessary to reconfigure service architecture
when overloads are detected in some point.
3.8 Conclusion obtainment
This task has to evaluate whether the goals have
been reached or not. If goals are reached, the
application process will finish successfully. In any
other case, the differences between the goals and the
results have to be evaluated. Configuration process
will be responsible for modifying the service to
reach the expected values.
3.9 Analysis Based on Predictions
This analysis is used to evaluate states and situations
different to the ones monitored in the real service.
Two types of experiments are specified: emulations
and simulations. The former are mainly used to
evaluate server and proxy capacities. Parameters
such as: bandwidth utilization, hard disk utilization,
etc. The experimental procedure was presented in
(Arias, 2002b). The later is useful to evaluate
network traffic. Through a network model (García,
2001), congestion can be analyzed. By using
parameters possible in a near future, undesired
situations can be detected. These experiments can
help managers reach a more robust and reliable
configuration for the service.
3.10 Configuration process
When goals have not been reached, the service must
be reconfigured. This process must be based on
results which were achieved in the analysis task.
3.10.1 Content provider
Content Creation
In this task the new content will be developed
following the criteria determined in the analysis.
These criteria are the following: theme of the video,
length, quality, and cacheability. The selection of the
theme will not only deal with the list, which has
been established in the results compilation task, but
also with external factors. For example, it is
impossible to produce news if there is nothing to
report. The length will depend on the type of theme
and will be obtained from multidimensional
analyses. Quality parameters will be determined
using origin and connection tests. Depending on
users connection type (or user origin), the bandwidth
to code videos will be selected.
Content Modification
The content modification is one of the most
difficult problems due to several reasons, the
impossibility to get the original material to repeat
the production, and the cost of making a new
production. However, there are some modifications
without a high cost:
Length decrease: the video can be cut without
cost, to adapt it to the new specifications.
Quality modification: generating a new video
in streaming format is relatively easy and cheap.
Cacheability allowing: if the number of
reproductions is low, it is a good decision to deny
the cacheability of the video, due to saving the
videos in cache consumes important resources, and
it does not improve the quality if the video is few
requested.
Removing a video: when there is no free space
in the server disk or this video is harmful to the
service (bad quality) removing is interesting.
3.10.2 Network operator
Service Architecture
This configuration task is related to computer and
network resources configuration. Sometimes,
increasing the number of resources is not the best
solution. In these cases, a modification in the service
architecture can improve the service performance.
Two entities can be introduced: caches, and
workload balancers. These elements are
recommended in the cases presented in table 3.
Table 3 Architecture elements
Function Problem
Cache Important number of reproductions
from network or a subnet
Workload balancing
/ Redundant servers
High traffic in an intermediate point, in
the server connection line; overload in
the existent servers
Usually, a device called proxy undertakes all
these functions. By using them on cascade, complex
architectures can be designed.
ANALYSIS AND CONFIGURATION METHODOLOGY FOR VIDEO ON DEMAND SERVICES BASED ON
MONITORING INFORMATION AND PREDICTION
293
Network Resources
This configuration task involves bandwidth
modifications. Bandwidth usually has to be
increased, however, when reserved resources are
underused, a decrease is logical. To solve the lack of
bandwidth in the output of the video servers, an
increase may be requested to the network operator or
the workload may be balanced using a redundant
server. This problem is more difficult to solve when
the lack of bandwidth is located in the user
connection. In this case, commercial problems
prevent the increase, so the best solution is to change
the requirements of the video. When the problems
are in an intermediate point of the network,
introducing a proxy can be a good solution to cache
the most reproduced videos. Table 4 shows possible
solutions to the lack of bandwidth.
Table 4 Network problems
Point Solution
User access line Decreasing video bandwidth requirements
Intermediate point Cache installation or workload balance
Server access line Workload balance
External operator Cache installation or decreasing video
bandwidth requirements
Computational Resources
There are two types of computational resources,
hardware and software. The hardware configuration
task is directed to modify the power of the computer,
such as increasing the number of CPUs, expanding
the memory, and even sometimes changing the
whole computer or adding a redundant computer.
The software configuration task is carried out to
change program versions (server, proxy) and mainly
to increase or decrease the number of licenses.
Commercial technologies usually limit the number
of simultaneous clients who may be connected to the
server.
Both computational and network resources are
closely related to service architecture. A
modification in the architecture can make
unnecessary or insufficient the resources previously
reserved for the service.
4 CONCLUSIONS
The configuration of video on demand services is a
complex process, due to the high resource
consumption and the difficulties of managing
continuous information. Nowadays, this task is
basically based on the manager’s experience.
However, a formalization of the steps which must be
followed can help to decrease this component. The
developed methodology has been used to configure
the video-on-demand service of La Nueva España
through the tool presented in (Pañeda, 2003). This
digital news service is one of the most important in
Spain. After a year of analysis and configuration, an
important improvement in the quality of service and
the number of satisfied users has been reached. The
methodology has detected the most interesting
themes, the most useful quality for videos and the
resources consumed, which has been fundamental to
decide the best configuration for the service.
REFERENCES
Almeida Jussara M., and others, 2001. Analysis of
Educational Media Server Workloads. NOSSDAV
2001. Port Jefferson, NY, USA.
Chesire M., and others, 2001. Measurement and Analysis
of a Streaming-Media Workload. USENIX. San
Francisco, USA
Loguinov D. and Radha H., 2002. Retransmission
Schemes for Streaming Internet Multimedia:
Evaluation Model and Performance Analysis. ACM
SIGCOMM Computer Communication Review (CCR),
vol. 32, no. 2.
Jin S., Bestavros A., 2001. GISMO, A Generator of
Internet Streaming Objects and Workloads. ACM
SIGMETRICTS.
Arias J. R, and others, 2002. A Set of Metrics for
Evaluation of Interactive News-on-Demand Systems.
ACM Multimedia Conference. Juan Les Pins, France.
Pañeda X.G., and others, 2003. Analysis tool for a video-
on-demand service based on streaming technology.
IEEE HSNM. LNCS, Springer Verlag. Estoril, Potugal.
Arias J. R, and others, 2002. Evaluation of Video Server
Capacity with Regard to Quality of the Service in
Interactive News-On-Demand Systems. PROMS-
IDMS. LNCS, Springer Verlag. Coimbra, Portugal.
García M., and others, 2001. A Tool for Performance
Prediction of an HFC Operator Based, on a Queuing
Network Model Simulation. SPECTS-2001. Orlando,
USA.
ICEIS 2004 - INFORMATION SYSTEMS ANALYSIS AND SPECIFICATION
294
