
ASSESSMENT OF E-LEARNING SATISFACTION FROM
CRITICAL INCIDENTS PERSPECTIVE
Nian-Shing Chen
a
, Kan-Min Lin
b
, Kinshuk
c
a
Department of Information Management, National Sun Yat-sen University, No. 70 Lien Hai Rd., Kaohsiung, Taiwan
b
Department of Information Management, Ling-Tung College, National Yunlin University of Science & Technology
c
Department of Information System, Massey University, New Zealand
Keywords: E-learning satisfaction, Frequency of negative critical incident, Critical incident
Abstract: Understanding learner satisfaction and its factors is very important for E-learning quality development. In
this study, we describe an E-learning satisfaction assessment model based on the negative critical incidents
perspective and examine if critical incidents affect E-learning satisfaction. The model is tested using an
empirical study of 230 online learners at NSYSU Cyber-University. The results show that the model is valid
and it can provide 71% of explanatory power for overall cumulative satisfaction for E-learning in our
empirical case. The critical incidents that affect E-learning satisfaction can be classified into four categories:
administration, functionality, instruction and interaction. Among them, interaction and functionality are
found to be the most important factors.
1 INTRODUCTION
E-learning is an essential trend in education for the
21st century. Many institutions of higher education
and corporate training are resorting to E-learning as
a means of solving learning and performance
problems (Govindasamy, 2002).
An important step that is typically required prior
to
implementing E-learning is the selection of a
suitable learning management system (LMS)
(Govindasamy, 2002). Like any other information
system, the success of learning management systems
largely depends on user satisfaction (Bharati, 2003;
DeLone and McLean, 1992; Doll and Torkzadeh,
1992; Seddon, 1997) and other such factors. Stokes
(2001) indicated that the issue of learner satisfaction
in the digital environment is very important. A high
level of learner satisfaction reflects that the students
are more willing to continue in online programs
evidenced by lower attrition rates, more referrals
from enrolled students, greater motivation, better
learning achievement and increased commitment to
the program (Tallman, 1994; Biner et al., 1994;
Chute et al., 1999).
The critical incident technique (CIT) is
freq
uently used to obtain information for improving
a service (Friman and Garling, 2001). CIT has been
used in our study to collect data about the user
satisfaction. It was originally developed by Flanagan
(1954), and has been used in a variety of disciplines,
including marketing (Grove and Raymond, 1997;
Iacobucci, et al., 1995; Keaveney, 1995; Meuter et
al., 2000) public transport services (Bejou and
Edwardson, 1996; Friman and Garling, 2001) and
education (Barth, 1975; Carter et al., 1968; Copas,
1984). A critical incident is an encounter of a
customer that is particularly satisfying or
dissatisfying of service/product (Bitner et al., 1990).
Friman , Edvardsson and Garling (2001) found that a
critical incident is one that can be described in detail
and that deviates considerably, either positively or
negatively, from what is normal or expected.
Negative critical incidents refer to customer
encounters tha
t do not proceed normally, but create
friction, irritation, and dissatisfaction (Edvardsson,
1992). Customers may reconsider their attitudes and
expectations based on negative critical incidents
caused by the faults encountered during service
delivery. To improve quality, and build trust and
strong customer relationships, it is important to
attend to faulty details that would result in negative
critical incidents in service production (Edvardsson,
1990).
Frequency of information stored in human
me
mory also influences judgments (Hastie, and Park,
1986). However, customers are unlikely to
remember specific critical incidents for a long time.
Yet, they are found to accurately judge the
27
Chen N., Lin K. and Kinshuk N. (2004).
ASSESSMENT OF E-LEARNING SATISFACTION FROM CRITICAL INCIDENTS PERSPECTIVE.
In Proceedings of the Sixth International Conference on Enterprise Information Systems, pages 27-34
DOI: 10.5220/0002605700270034
Copyright
c
SciTePress
frequency of the critical incidents (Greene, 1984)
because such events stand out (Fisk and Schneider,
1984; Woodley and Ellis, 1989). From the viewpoint
of events, Greene (1984) and Jonides and
Naveh-Benjamin (1987) indicated that the frequency
of events is remembered. Hence, overall satisfaction
may be influenced by the strength of the positive
and/or negative emotions aroused by a critical
incident (Mano and Oliver, 1993). Thus, although
overall satisfaction probably is directly affected by
experiences of critical incidents, it appears more
plausible to assume that cumulative satisfaction is
related to the memory for the frequency of critical
incidents (Friman et al., 2001).
With the increasing popularity of E-learning, it
is imperative that managers and researchers will
identify factors that affect learner satisfaction. This
has direct managerial implications in supporting
well-designed E-learning programs and promotion
of running successful E-learning courses. From the
above discussion, it can be noted that negative
critical incidents are more important than positive
critical incidents in management implications. If an
E-learning manager can solve negative critical
problems, learner satisfaction would significantly
increase. Past studies have heavily concentrated on
positive critical incidents to obtain information, yet
few of them focused on negative critical incidents or
explored the relationship between negative and
positive critical incidents. How the interplay
between both incidents affects overall satisfaction is
still missing in the discussions. The objective of
this study is twofold: (1) to discuss a theoretical
framework for evaluating E-learning satisfaction
from the negative and positive critical incident
perspective and provide empirical evidence of the
theoretical model; (2) to explore the relationship
between negative and positive critical incidents
through satisfaction model assessment.
2 HYPOTHESES
Friman’s model has been found useful in assessing
user satisfaction in the public transport services
(Friman et al., 2001). We have modified Friman’s
model to create SAFE (Satisfaction Assessment
from Frequency of negative critical incidents
perspective for E-learning) model in this study
(Figure 1). The model consists of three sets of latent
variables: (1) Frequency of negative critical
incidents for E-learning (FNCI) -- negative critical
incidents perspective, (2) Attribute-specific
cumulative satisfaction for E-learning (ASCS) --
positive critical incidents perspective, and (3)
Overall cumulative satisfaction for E-learning
(OCS).
The relationships among the negative critical
incident frequency, attribute-specific cumulative
satisfaction, and overall cumulative E-learning
satisfaction (see Figure 1) can be summarized in
terms of the following hypotheses:
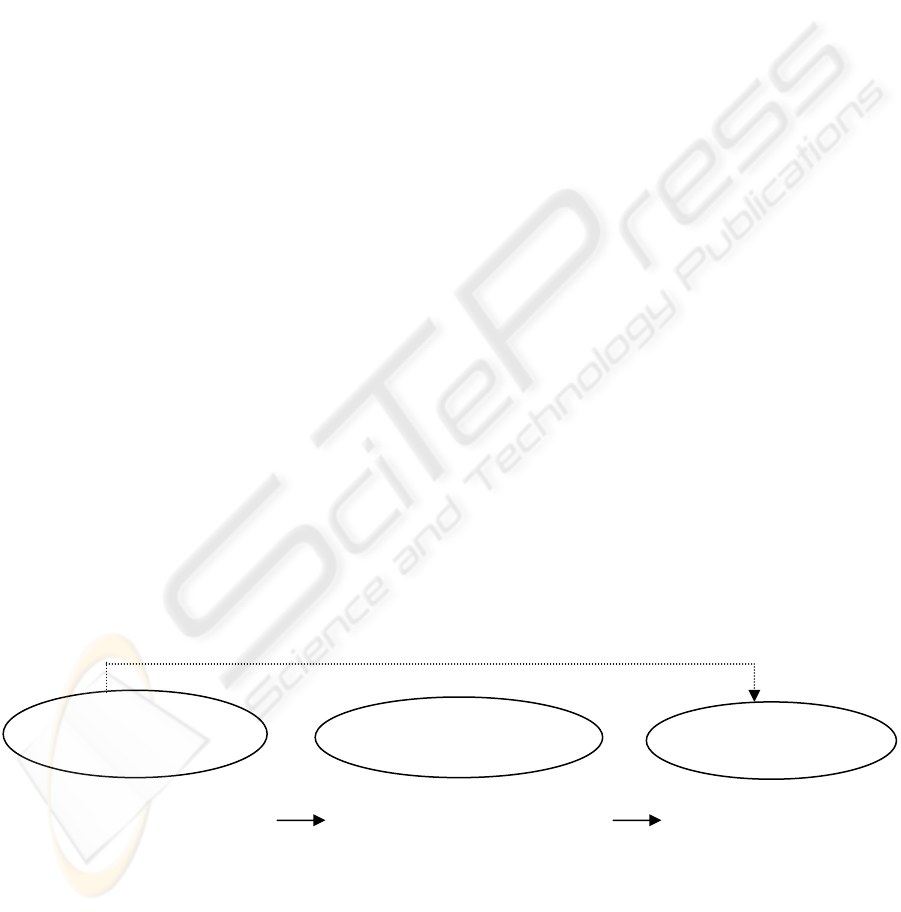
H1: The frequency of negative critical incidents for
E-learning directly and negatively influences
the attribute-specific cumulative satisfaction for
E-learning.
H2: Attribute-specific cumulative satisfaction for
E-learning directly and positively influences the
overall cumulative satisfaction for E-learning.
H3: The frequency of negative critical incidents for
E-learning indirectly and negatively influences
the overall cumulative satisfaction for
E-learning.
Figure 1: The SAFE (Satisfaction Assessment from requency of negative critical incidents perspective for E-learning)
model
(
FNCI
)
(
ASCS
)
Overall Cumulative
Satisfaction for E-learning
Frequency of Negative Critical
Incidents for E-learning
Attribute-Specific Cumulative
Satisfaction for E-learning
H3
H1
H2
(
OCS
)
ICEIS 2004 - HUMAN-COMPUTER INTERACTION
28

3 METHOD
The subjects for this research were 230 students
taking master’s online credit course programs at
NSYSU Cyber-University (http://cu.nsysu.edu.tw).
These students were enrolled in the sixth term online
credit courses program provided by the Department
of Information Management, National Sun Yat-sen
University in 2002. To increase the response rate, all
enrolled students were given the anonymous
questionnaire while they were physically sitting for
the mid-term examination. The anonymous
questionnaire used in this study was adopted from
the previous studies
(Friman et al., 2001; Lin and
Chen, 2001; 2002) with suitable revisions for
E-learning. Two domain experts reviewed and
revised the questionnaire draft for clarity, content,
and adequateness of the questions.
To verify the content validity, a pilot study was
conducted by administering the questionnaire to 50
students enrolled in the online classes. Students in
this pilot study were explicitly made aware of the
anonymous nature of the questionnaire in order to
avoid any effects on the validity of the responses.
The questionnaire consisted of three parts A, B
and C. In part A respondents were asked to rank
their overall cumulative satisfaction (OCS) and
attribute-specific cumulative satisfaction (ASCS)
about E-learning. Based on Lin and Chen (2001;
2002), the questions were divided into four
categories: administration, functionality, instruction,
and interaction. For each question, a seven-point
scale ranging from "strongly unsatisfied" to
"strongly satisfied" was given. Part B consisted of
a description of the frequency of negative critical
incidents. The FNCIs were exemplars of the four
types which the previous research (Lin and Chen,
2001; 2002) had indicated as major problems
encountered by the learners in E-learning:
administration (e.g., inappropriate treatment of
learners by employees of administration);
functionality (e.g., inadequate design of LMS
functions); instruction (e.g., improper instructional
design); and interaction (e.g., hard to reach group
consensus). For each question, respondents checked
a five-point scale ranging from "never" to "always".
In Part C respondents answered demographic
questions.
4 RESULTS
The main purpose of this study was to propose and
validate an E-learning satisfaction assessment model
from frequency of negative critical incidents
perspective. As described earlier, we looked for the
relationships among the negative critical incident
frequency, attribute-specific cumulative satisfaction
and overall cumulative E-learning satisfaction.
Following sub-sections discuss the findings of the
study.
4.1 Learner satisfaction
Table 1 presents the means for the main problem
categories. The overall cumulative satisfaction mean
was 5.68. Learner satisfaction was between
“satisfied” and “very satisfied” about E-learning.
In the attribute-specific cumulative satisfaction
(ASCS) comparison of the means shows that
functionality has a lower value than others
(administration, instruction, and interaction). The
functionality satisfaction mean was 4.82. This
implies that learner satisfaction fell between “no
comments” and “satisfied”. In the frequency of
negative critical incidents (FNCI), a comparison of
the means shows that functionality has a higher
value than others. The functionality mean was 3.6.
The frequency of negative critical incidents was
between “sometimes” and “often”.
4.2 Measurement model
LISREL was used for statistical analysis. LISREL
consists of two distinct parts: the measurement
model (or confirmatory factor model) and the
structural equation model. In the measurement
model, the standardized parameter estimates,
t-statistics, construct reliability coefficients, and the
average variance extraction measure of the research
model presented in Table 2. The results indicate
that the composite reliability coefficients were all
above the 0.6 thresholds (Fornell and Larcker, 1981)
with an acceptable level of reliability. Another index
of reliability is the variance extraction measure.
This measure reflects the overall variance in the
indicators accounted for by the latent construct.
Fornell and Larcker (1981) suggested that construct
exhibit estimates of 0.5 or larger is desirable.
However, Jiang et al. (2002) pointed out that this
index is quite conservative. Normally, variance
extracted estimates will be below 0.5 even when
reliabilities are acceptable. Thus, the two constructs:
FNCI-administration and FNCI-functionality, both
with estimates below 0.5 in this study, are included
for further analysis.
ASSESSMENT OF E-LEARNING SATISFACTION FROM CRITICAL INCIDENTS PERSPECTIVE
29

Table 1: Means for the main problem categories
Code: Latent Mean Scale
Frequency
FNCI 1: Administration 2.99
FNCI 2: Functionality 3.60
FNCI 3: Instruction 2.92
FNCI 4: Interaction 3.06
1:Never
2:Seldom
3:Somtime
4:Often 5:Always
Satisfaction
ASCS 1: Administration 5.08
ASCS 2: Functionality 4.82
ASCS 3: Instruction 5.32
ASCS 4: Interaction 5.26
OCS: Overall satisfaction 5.68
1:Strongly unsatisfied
2:Very unsatisfied
3:Unsatisfied
4:No comment
5:Satisfied
6:Very satisfied
7:Strongly satisfied
Table 2: Standardized Parameter Estimates (SPE), t-value, Composite Reliability (CR), Average Variance Extraction
(AVE), Means (M), Standard Deviations (SD) of the estimated model
Code: Latent
Code : Variable
SPE t-value CR AVE M SD
FNCI 1: Administration
X1: Overall program design doesn’t meet learner’s need
X2: Bad quality of administration service
0.69
0.70
10.44
10.64
0.65 0.49 2.99
3.10
2.88
0.98
1.04
1.11
FNCI 2: Functionality
X3: Bad response time of the LMS
X4: Bad stability of the LMS
0.71
0.60
9.48
7.96
0.60 0.44 3.60
3.57
3.63
1.06
1.11
1.19
FNCI 3: Instruction
X5: Course material doesn’t meet learner’s need
X6: Course material is boring
X7: Recorded lecture doesn’t meet learner’s need
X8: Recorded lecture is boring
X9: Bad design of learning activity
X10: Bad design of assessment
X11: Bad adaptation of teaching methods
0.87
0.82
0.81
0.80
0.82
0.84
0.75
16.36
15.09
14.94
14.42
15.17
15.51
13.35
0.95 0.65
2.92
3.03
2.85
2.89
2.81
2.97
2.97
2.93
0.91
0.97
1.08
1.11
1.04
1.06
1.09
1.17
FNCI 4: Interaction
X12: Hard to reach group consensus because of bad communication
X13: Online interaction is prone to misunderstanding
X14: Interaction for class discussion board is not good
0.70
0.73
0.81
11.43
11.82
13.85
0.79 0.56 3.06
3.05
3.03
3.10
1.03
1.29
1.16
1.14
ASCS 1: Administration
Y1: The overall enrollment plan(promotion, registration, tuition, enrollment)
Y2: The overall curriculum program planning and design
Y3: The quality of administration services
0.84
0.86
0.78
10.97
11.25
12.24
0.86 0.68 5.08
5.01
5.14
5.08
0.80
0.90
0.91
0.88
ASCS 2: Functionality
Y4: The functional completeness of the LMS
Y5: The functional effectiveness of the LMS
Y6: The functional stability of the LMS
0.82
0.94
0.73
11.45
11.76
10.65
0.87 0.7 4.82
5.02
4.87
4.58
1.01
1.02
1.16
1.24
ASCS 3: Instruction
Y7: The course planning and design
Y8: The course scheduling
Y9: The course materials
Y10: The course recorded lecturing
Y11: The course learning activities design
Y12: The course assessment
0.83
0.83
0.91
0.89
0.86
0.79
14.73
14.36
16.77
16.03
15.26
13.79
0.94 0.72 5.32
5.25
5.28
5.34
5.47
5.36
5.20
0.87
0.96
0.94
1.02
1.04
0.99
1.01
ASCS 4: Interaction
Y13: The interaction among classmates
Y14: The interaction for class discussion board
Y15: The interaction for office-hour
Y16: The interaction for issue-based discussion board
0.85
0.94
0.73
0.78
15.30
16.60
12.29
12.95
0.90 0.69 5.26
5.24
5.33
5.23
5.53
0.93
1.06
0.97
1.12
1.04
OCS: Overall satisfaction
Y17: My overall impression about E-learning
Y18: My overall feeling about continually using the LMS for online learning
0.88
0.64
7.50
7.62
0.74 0.59 5.68
5.53
5.83
0.83
0.92
0.92
ICEIS 2004 - HUMAN-COMPUTER INTERACTION
30
4.3 Overall Model Fitness
The chi-square test provides a statistical test for the
null hypothesis that the model fits the data, but it is
too sensitive to sample size differences, especially
for the cases in which the sample size exceeds 200
respondents (Hair et al., 1998). Bagozzi and Yi
(1988) suggested a chi-square per degrees of
freedom instead. Based on the suggestions from
Bagozzi and Yi (1988) and Joreskog and Sorbom
(1992), we adopted the recommended fits including
the goodness of fit index (GFI), adjusted goodness of
fit index (AGFI), normed fit index (NFI), the
non-normed fit index (NNFI) and the
root-mean-square error of approximation (RMSEA)
as indexes for evaluating the overall model fitness.
The fit-indices, NNFI=0.96, NFI=0.91,
GFI=0.86, AGFI=0.81 and RMSEA=0.047, came
from the LISREL analysis. All of these values show
a good model fit that is well within the accepted
thresholds, above 0.90, 0.90, 0.80, 0.80, and below
0.05 (Hair et al., 1998) respectively. Another
fit-index is χ
2
(DF=387,N=230) = 586.88, P<0.01.
The ratio of χ
2
to the degree of freedom (1.52) is
also well below the recommended maximum ratio of
3:1 (Chin and Todd, 1995). In summary, the all fit
indices indicate that the model has a good fit.
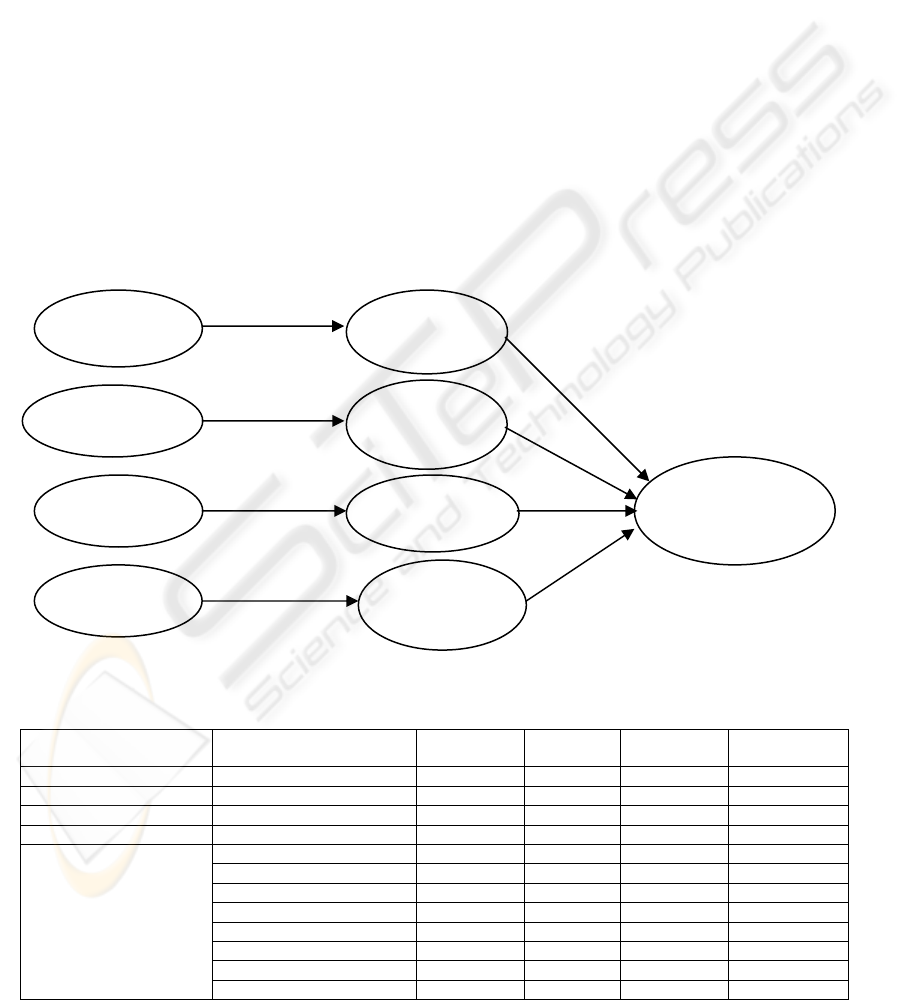
4.4 Structural model
The structural model and hypotheses are tested by
examining whether the significance of path
coefficients (which are standardized betas). In
addition to the individual path tests, the explained
variance in the dependent constructs was assessed as
an indication of the overall predictive power of the
model (Compeau and Higgins, 1999). The path
coefficients are shown in Figure 2. They are all
significant at 0.01 levels.
ASCS 1
Administration
R
2
=0.41
-0.64**
FNCI 1
Administration
0.18**
FNCI 2
Functionality
FNCI 3
Instruction
FNCI 4
Interaction
ASCS 2
Functionality
R
2
=0.49
ASCS 3
Instruction
R
2
=0.41
ASCS 4
Interaction
R
2
=0.35
OCS
Overall satisfaction
R
2
=0.71
-0.70**
-0.64**
-0.60**
0.52**
0.17**
0.33**
** Significant at 0.01 level
Figure 2: Structural Model
Table 3: Direct, indirect and total effect
Dependent Latent Variables Independent
Latent Variables
Direct effect Indirect
effect
Total
effect
t-value
ASCS Administration FNCI Administration -0.64 -0.64 -7.32**
ASCS Functionality FNCI Functionality -0.70 -0.70 -6.22**
ASCS Instruction FNCI Instruction -0.64 -0.64 -8.86**
ASCS Interaction FNCI Interaction -0.60 -0.60 -7.42**
ASCS Administration 0.18 0.18 2.87**
ASCS Functionality 0.17 0.17 2.89**
ASCS Instruction 0.33 0.33 4.61**
ASCS Interaction 0.52 0.52 5.73**
FNCI Administration -0.11 -0.11 -2.73**
FNCI Functionality -0.12 -0.12 -2.81**
FNCI Instruction -0.21 -0.21 -4.29**
OCS Overall satisfaction
FNCI Interaction -0.31 -0.31 -4.97**
** Significant at 0.01 level
ASSESSMENT OF E-LEARNING SATISFACTION FROM CRITICAL INCIDENTS PERSPECTIVE
31

Figure 2 and Table 3 reveal that the results of
this study support hypothesis (H2). That is, the
overall cumulative satisfactions are directly affected
by the attribute-specific cumulative satisfaction for
E-learning. Moreover, the attribute-specific
cumulative satisfaction for E-learning is directly and
negatively affected by the frequency of negative
critical incidents (H1). The frequency of negative
critical incidents shows only indirect influence on
overall satisfaction (H3). In summary, the data
analysis for the model provides significant support
for all three hypotheses. The results have confirmed
that overall cumulative satisfaction (OCS) about
E-learning is not directly affected by the
remembered frequency of negative critical incidents
(FNCIs). However, it is affected indirectly through
cumulative satisfaction with quality or performance
attributes. The SMC (Squared Multiple Correlation)
values show that the model explained 41% of the
variance for administration, 49% for functionality,
41% for instruction, 35% for interaction and 71% for
overall satisfaction.
We can conclude from the proposed SAFE
model that the frequency of negative critical
incidents directly and negatively affects positive
critical incidents satisfaction; positive critical
incidents satisfaction further directly and positively
affects overall satisfaction; and the frequency of
negative critical incidents indirectly and negatively
affects overall satisfaction in E-learning.
5 DISCUSSION AND
IMPLICATION
This study described the SAFE model to assess
E-learning satisfaction from frequency of negative
critical incidents perspective. FNCIs include four
categories: administration, functionality, instruction
and interaction. From administration perspective, the
result showed that "the overall program design does
not meet learner’s need" and "bad quality of
administrative service" have significant influence on
learner satisfaction. From the functionality
perspective, the result were affected by the learning
management system (LMS) and revealed that "bad
response time of the LMS" and "bad stability of the
LMS" has significant influence on learner
satisfaction. From the instructional point of view, the
result showed that "course material doesn’t meet
learner’s need", "course material is boring",
"recorded lecture doesn’t meet learner’s need",
"recorded lecture is boring", " bad design of learning
activity", "bad design of assessment" and "bad
adaptation of teaching methods" have a significant
influence on learner satisfaction. From the
interaction point of view, the result revealed that
"hard to reach group consensus because of bad
communication", "online interaction is prone to
misunderstanding" and "Interaction for class
discussion board is not good" have significant
influence on learner satisfaction.
For positive critical incidents part, overall
cumulative satisfaction (OCS) about E-learning is
affected by satisfaction with administration,
functionality, instruction, and interaction. From
administration perspective, the result showed that the
overall enrollment plan (promotion, registration,
tuition, and enrollment), the overall curriculum
program planning and design and the administrative
service quality are the significant factors affecting
learner satisfaction. From functionality perspective,
the functional completeness, effectiveness and
stability of the LMS have great influence on learner
satisfaction. LMS is the most crucial and
fundamental support of E-learning, learners highly
rely on LMS for support of all online learning
activities. Hence, LMS stability and effectiveness are
very important factors for improving learner
satisfaction. From instruction perspective, the
course planning, design, materials, lecturing, and
learning activities design and assessment have
significant influence on learner satisfaction.
From interaction point of view, a comparison
of the standardized path coefficients shows that
interaction has a stronger effect on overall
satisfaction than the others. This implies that
improving interaction is an important issue for
E-learning. The research in Burnett (2001) and
Parker (1999) also pointed out that learners expect
and demand instruction with high levels of
interaction between the learners and instructor. The
demand for interactivity has placed a new focus on
instructional design and the relevant technologies.
The results in our study found that "the interaction
among classmates" and "the interaction for class
discussion board", "the interaction for office-hour"
and “the interaction for the issue-based discussion
board" have significant influence on learner
satisfaction. It is important to effectively manage
these different discussion boards to better facilitate
interaction among learner-learner, learner-teacher
and learner-content.
6 CONCLUSION
Learner satisfaction is a critical factor that influences
the future development of E-learning. To understand
learner satisfaction and how critical incidents affect
students is a very important research issue for
E-learning. However, there is little research that
ICEIS 2004 - HUMAN-COMPUTER INTERACTION
32

discussed whether overall cumulative satisfaction in
E-learning is related to the remembered frequency of
negative critical incidents.
The major contribution of this study was to
propose and validate the SAFE model – assessing
E-learning satisfaction from negative critical
incidents perspective. Meanwhile, the SAFE model
offers 71% explanatory power for overall cumulative
satisfaction in our empirical study, which is
significantly higher than Al-gahtani and King (1999;
18%) and Baker and Crompton (2000; 60%).
This result shows that negative critical incidents
directly affect positive critical incidents but only
indirectly affect overall satisfaction through positive
critical incidents. However, negative critical
incidents are more important in from the perspective
of management implications because manager can
resolve the most frequency incidents straight away to
improve satisfaction. Through negative and positive
perspectives, we can confirm finding of the critical
incidents that influence satisfaction in E-learning.
Result of this study and its further development will
contribute to the evaluation and improvement of
E-learning environment.
ACKNOWLEDGEMENT
This research is supported by the NSC under the
contract: NSC91-2511-S-110-004.
REFERENCES
Al-gahtani, S. S. and King, M. , 1999. Attitudes,
satisfaction and usage: factors contributing to each in
the acceptance of information technology. Behaviour &
Information technology, 18(4), pp.277-297.
Bejou, D. and Edwardson, B. 1996. A critical incident
approach to examining the effects of service failures on
customer Source. Journal of Travel Research, 35(1), pp.
35-41.
Babin, B. J. and Darden, W. R. 1996. Good and bad
shopping vibes: spending and patronage satisfaction.
Journal of Business Research, 35, pp. 201-206.
Bagozzi, R. P., and Yi, Y. , 1988. On the evaluation of
structure equation models. Journal of the Academy of
Marketing Science, 16, pp.74-94.
Baker, D. A. & Crompton, J. L. 2000. Quality, satisfaction
and behavioral intentions. Annals of Tourism Research,
27(3), pp.785-804.
Barth, R. C. , 1975. Perceptions of volunteers and children
working in a second grade language-experience
reading program. Ed.D. dissertation, Lehigh
University.
Bharati, P. , 2003 .People and information matter: task
support satisfaction from the other side. Journal of
Computer Information Systems, Winter, pp. 93-102.
Biner, P. M., Dean, R. S., and Mellinger, A. E. , 1994.
Factors underlying distance learner satisfaction with
televised college-level courses. The American Journal
of DistancE-learning, 8(1), pp.60–71.
Bitner, M. J., Booms, B. H., Tetreault, M. S. , 1990. The
service encounter: diagnosing favorable and
unfavorable incidents. Journal of Marketing, 54(1),
pp.71-84.
Burnett, K. , 2001. Interaction and student retention,
success and satisfaction in web-based learning. 67th
IFLA Council and General Conference, pp.1-12.
Carter, G. L., JR. and Kohl, F. E. , 1968. A critical incident
study of the professional adult educator (extension
agricultural agent). National seminar on adult
education research, Chicago, pp. 11-13.
Chin, W. W. and Todd, P. , 1995. On the use, usefulness,
and ease of use of structure equation modeling in MIS
research: a note of caution. MIS Quarterly, 19(2),
pp.237-246.
Churchill, G. A., Jr. and Surprenant, C. , 1982 . An
Investigation Into the Determinants of Customer
Dissatisfaction. Journal of Marketing Research, 19,
pp.491-504.
Chute, A. G., Thompson, M. M., and Hancock, B. W. ,
1999. The McGraw-Hill handbook of
distancE-learning. New York: McGraw-Hill.
Compeau, D. and Higgins C. A. 1999. Social Cognitive
Theory and Individual Reactions to Computing
Technology: a Longitudinal Study. MIS Quarterly,
23(2), pp. 145-158.
Copas, Ernestine M. , 1984. Critical Requirements for
Cooperating Teachers. Journal of Teacher Education,
35(6), pp.49-54.
DeLone, W. H. and McLean, E. R. , 1992. Information
system success- the quest for the dependent variable.
Information system research, 3(1), pp.60-95.
Doll, W. Xia and Torkzadeh, G., 1992. A confirmatory
factor analysis of the end-user computer satisfaction
instrument. MIS Quarterly, 18, pp.453-461.
Edvardsson, B. , 1990. Management Consulting towards
a Successful Relationship. International Journal of
Service Industry Management, 1(3), pp. 4-19.
Edvardsson, B. , 1992 . Service Breakdowns: A Study of
Critical Incidents in an Airline. International
Journal of Service Industry Management, 3 (4),
pp.17-29.
Fisk, A. D. and Schneider, W. , 1984 . Memory as a
function of attention, level of processing, and
automatization. Journal of Experimental Psychology:
Learning, Memory, and Cognition, 10, pp. 181-197.
Flanagan, J. C. , 1954 . The critical incident technique.
Psychological Bulletin, 51, pp. 327-357.
Fornell, C. and Larcker, D. F. , 1981. Evaluating
structural equation models with unbearable and
ASSESSMENT OF E-LEARNING SATISFACTION FROM CRITICAL INCIDENTS PERSPECTIVE
33

measurement error. Journal of Marketing Research,
18, pp. 390-50.
Friman, M. and Garling, T. , 2001. Frequency of negative
critical incidents and satisfaction with public
transport services II. Journal of Retailing and
Consumer Services, 8, pp. 105-114.
Friman, M., Edvardsson, B., and Garling, T. , 2001.
“Frequency of negative critical incidents and
satisfaction with public transport services I,” Journal
of Retailing and Consumer Services, 8, pp. 95-104.
Govindasamy, T. , 2002. Successful implementation of
E-learning Pedagogical considerations. Internet and
Higher Education, 4, pp. 287–299.
Greene, R. L. , 1984. Incidental learning of event
frequency. Memory and Cognition, 12, pp. 90-95.
Grove, S. J. and Raymond [rho] Fisk , 1997. The Impact
of Other Customers on Service Experiences: A
Critical Incident Examination of Getting Along.
Journal of Retailing, 73(1), pp. 217-24.
Hair, Jr. F., Anderson, R. E. Tatham, R. L., and Black, W.
C. , 1998. Multivariate data analysis. 5
th
ed. New
York: Macmillan
Hastie, R., Park, B. , 1986. The relationship between
memory and judgment depends on whether the
judgment task is memory-based or on-line.
Psychological Review, 93 (3), pp. 258-268.
Iacobucci, D., Ostrom, A., and Grayson, K. ,
1995.Distinguishing Service Quality and Customer
Satisfaction: The Voice of the Consumer. Journal of
Consumer Psychology, 4(3), pp. 277-303.
Jiang, J. J., Klein, G. and Carr C. L. , 2002. Measuring
information system service quality: SERVQUAL
from the other side. MIS Quarterly, 26(2), pp.
145-161.
Jonides, J. Neveh-Benjamin, M. 1987. Estimating
frequency of occurrence, Journal of Experimental
Psychology: learning. Memory, and Cognition, 13 (2),
pp. 230-240.
Joreskog, K. G., and Sorbom, d. , 1992. LISREL: A guide
to the program and applications, 3
nd
ed. Chicago:
Scientific Software International, Inc.
Keaveney, S. M. , 1995. Customer Switching Behavior in
Service Industries: An Exploratory Study. Journal of
Marketing, 59, pp. 71-82.
Lin, K. M. and Chen N. S. , 2001. Exploring Learning
Problems of Cyber University. IEEE International
Conference on Advanced Learning Technologies, pp.
369-370.
Lin, K. M. and Chen N. S. , 2002. Exploring Learning
Problems of Cyber University. Information
Management Research, 4(2), pp. 65-86.
Mano, H. and Oliver, R. L. , 1993. Assessing the
dimensionality and structure of consumption
experience: evaluation, feeling and satisfaction.
Journal of Consumer Research, 20, pp. 451-466.
Meuter, M.L., A.L. Ostrom, R. I. Roundtree, M. J. Bitner,
2000. Self-Service Technologies: Understanding
Customer Satisfaction with Technology-Based
Service Encounters. Journal of Marketing, 64(3), pp.
50-65.
Parker, A. , 1999. Interaction in distance education: The
critical conversation. Educational Technology Review,
12, pp. 13-17.
Seddon, P. B. , 1997. A respecification and extension of
the Delone and Mclean model of IS success.
Information Systems Research, 8(3), pp. 240-250.
Stokes, S. P. , 2001. Satisfaction of college students with
the digital learning environment Do learners’
temperaments make a difference? Internet and Higher
Education, 4, pp. 31–44.
Tallman, F. D. , 1994. Satisfaction and completion in
correspondence study: the influence of instructional
and student-support services. The American Journal
of Distance Education, 8 (2), pp. 43–57.
Wong A. , 2003. A critical incident approach to the
examination of customer relationship management in
a retail chain: an exploratory study. Qualitative
Market Research, 6(4), pp. 248-262.
Woodley, Z. P. and Ellis, N. R. , 1989. Memory for
frequency occurrence: intelligence levels and retrieval
cues. Intelligence, 13, pp. 53-61.
ICEIS 2004 - HUMAN-COMPUTER INTERACTION
34
