
IMAGE CLASSIFICATION ACCORDING TO THE DOMINANT
COLOUR
A. Ait Younes
LERI, LAMSADE
rue des cray
`
eres BP 1035, 51687 Reims cedex 2, France
I. Truck
Labo IA
2 rue de la libert
´
e, 93526 Saint Denis cedex 2, France
H. Akdag
LERI, LIP6
8 rue du capitaine scott, 75015 Paris, France
Y. Remion
LERI
rue des cray
`
eres BP 1035, 51687 Reims cedex 2, France
Keywords:
Image classification, Human-Computer Interaction, Fuzzy membership functions, Colour spaces.
Abstract:
The aim of this work is to develop a user-friendly software allowing him to classify images according to their
dominant colour expressed through linguistic expressions. With this aim in view, images are processed and
stored in a database. The processing consists in assigning a profile to each image. To do this, we consider the
pixels of the images in the colorimetric space HLS and then a restricted number of colours classes are built.
These classes depend on the hue (H). For each colour class a certain number of subclasses depending on the
lightness (L) and the Saturation (S) are defined. Finally the profile is drawn using the pixels membership of
the classes and subclasses. Thus starting from a linguistic expression of a colour, the user can extract images
from the database.
1 INTRODUCTION
The classification of images by colour is of the great-
est importance in several fields and activities (Foul-
loy, 1990), (Le Saux, 2003), ... For example, Ham-
mami and al. use colour histogrammes to determine
whether an image contains a lot of skin texture or not
in order to classify the images and to finally detect
adult and sexual contents (Hammami et al., 2002).
In medical applications, the work we detail in this
article can be used to propose a general methodol-
ogy to classify medical images sets or sequences in
order to help medical expert forecasts and analysis,
like tumors detection, for example. In industrial ap-
plications such as cosmetics it can be interesting to
work on skin colour to help the make-up manufac-
ture. Another example lies in advertising where our
process can help the business man to find more easily
and quickly the image that corresponds to his selec-
tion criteria.
In the process we propose, profiles are assigned to
images and depend on the quantity of pixels that be-
long to colour classes.
The paper is organized as follows: section 2 ex-
plains about our choices for colour spaces while sec-
tion 3 is devoted to the problem of colour representa-
tion where fuzzy membership functions are used. In
section 4 we focus on the profile determination for
each new entry (image) in the database. Finally the
software we have developed is presented in section 5
with screen captures and section 6 concludes this ar-
ticle.
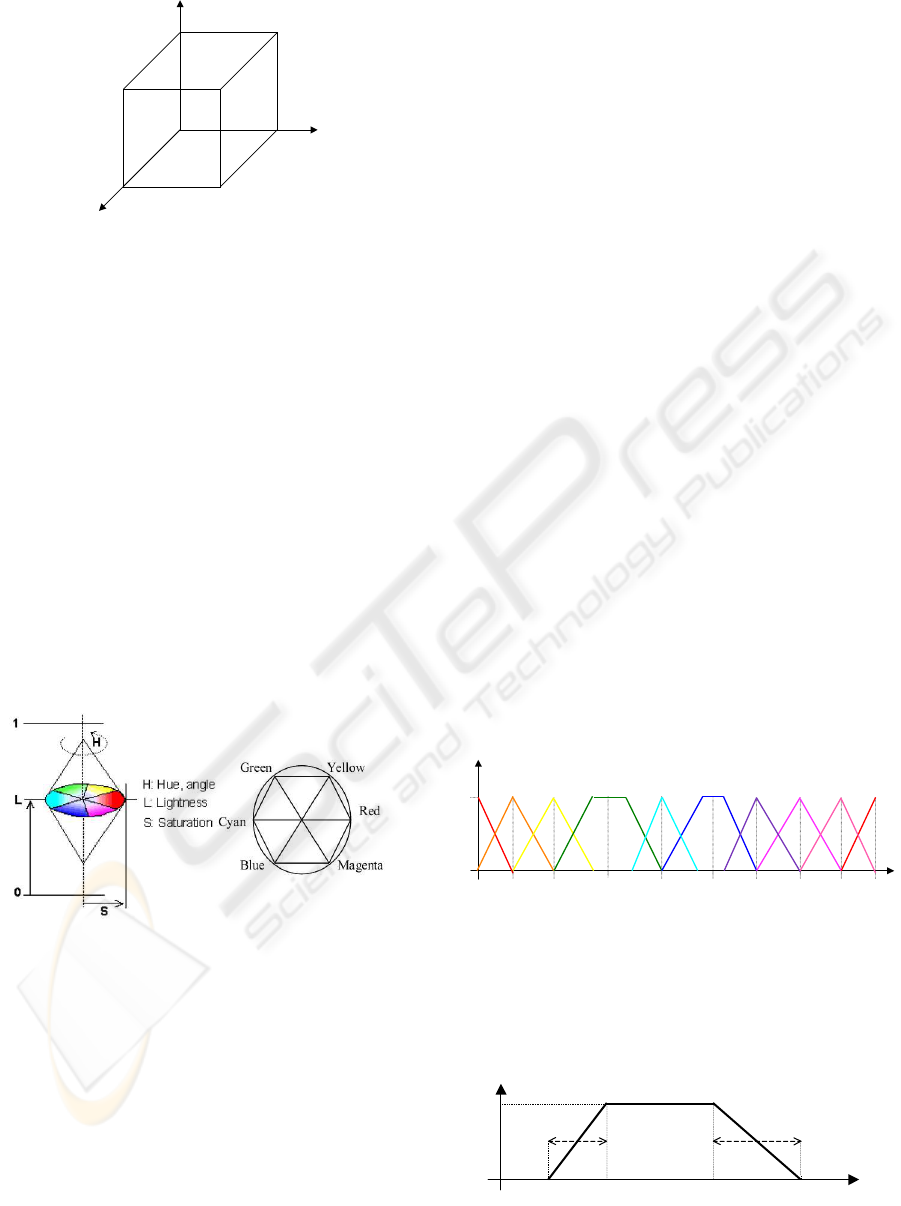
2 COLOUR SPACES
One of the spaces usually used to represent the colour
on a screen is the RGB space (Red, Green, Blue). It is
a three dimensional space representing the three pri-
mary colours that usually vary from 0 to 255. The
origin of this space (0,0,0) corresponds to the lack
of colour which represents the ”black” colour. On
the other hand the point (255,255,255) corresponds to
the maximum of colour which represents the ”white”.
The representation of the colours in this space gives
us a cube (cf. figure 1).
However this space is not appropriate for our prob-
lem because three dimensions (R, B and G) are nec-
essary to identify a colour. To facilitate the colour
identification we choose a space that allows us to
characterize a colour with only one dimension: its
505
Ait Younes A., Truck I., Akdag H. and Remion Y. (2004).
IMAGE CLASSIFICATION ACCORDING TO THE DOMINANT COLOUR.
In Proceedings of the Sixth International Conference on Enterprise Information Systems, pages 505-510
DOI: 10.5220/0002607005050510
Copyright
c
SciTePress
blue
magenta
red
yellow
green
cyan
white
black
Figure 1: The RGB space
hue. Indeed hue is enough to recognize the colour,
except when the colour is very pale or very somber.
This space is called HLS (Hue, Lightness, Satura-
tion) where saturation corresponds to the quantity of
”white” in the colour and lightness corresponds to the
light intensity of the colour. This space can be repre-
sented through a cylinder or a bi-cone (cf. figure 2).
H is defined as an angle but we can also represent it
in the interval [0,255] as the other components L and
S. The difference between H and the other compo-
nents is that its definition interval loops which means
that 0 and 256 are the same points. The ”pure” red
(represented in RGB space by the point (255,0,0))
corresponds to an angle equal to 0 for h, a saturation
s equal to 255 and a lightness l equal to 128.
Figure 2: The HLS space
For this problem, we limit ourselves to the nine fun-
damental colours defined by the set T representing a
good sample of colours (dimension H) :
T = {red, orange, yellow, green, cyan, blue, pur-
ple, magenta, pink}
This set corresponds to the seven colours of New-
ton (Roire, 2000) to which we have added colour pink
and colour cyan. Of course, this choice is not restric-
tive, we can modify the set of colours as desired.
3 COLOUR REPRESENTATION
As we have seen HLS space is convenient for our
problem but it is a non UCS (uniform colour scale)
space (Truck, 2002), (Herrera and Martinez, 2001).
Indeed our eyes don’t perceive small variations of hue
when colour is green (h = ±85) or blue (h = ±170)
while they perceive it very well with orange (h = 21)
for example.
Thus to model the fact that the distribution of
colours is not uniform on the circle of hues, Truck
and al. propose to represent them with trapezoidal or
triangular fuzzy subsets (Truck et al., 2001a).
For each colour of T they built a membership func-
tion varying from 0 to 1 (f
t
with t ∈ T ). If this func-
tion is equal to 1, the corresponding colour is a ”true
colour” (cf. figure 3).
These functions were built using colours definition
(www.poupre.com). For each fundamental colour, the
associated interval is defined according to linguistic
names of colours. For example to construct f
yellow
,
we can use colour ”mustard” whose hue is equal to 55
and whose membership to f
yellow
is equal to ±0.5.
For some colours, the result gives a wide interval.
It is the case for the colours ”green” and ”blue” which
are represented by trapezoidal fuzzy subsets.
For the construction of these functions, in this ar-
ticle we suppose that two functions representing two
successive colours have their intersection point value
equal to 1/2. It means that when h corresponds to an
intersection point it can be assigned to both colours
with the same weight.
H
f
21 43 85 128 170
191
213
234 255
0
1
re
d
orang
e
yellow gree
n
cya
n
blu
e
purpl
e
m agent
a
pin
k
re
d
Figure 3: The dimension H
As usual (Bouchon-Meunier, 1995) we denote
(a, b, α, β) a trapezoidal fuzzy subset (cf. figure 4).
When the kernel is reduced to only one point, it is a
triangular subset denoted by (a, α, β) since a = b.
a - α
a
b
b + β
1
α
β
Figure 4: Trapezoidal fuzzy subset
ICEIS 2004 - ARTIFICIAL INTELLIGENCE AND DECISION SUPPORT SYSTEMS
506
Now we can define the membership function of any
colour t :
∀t ∈ T , f
t
(h) =
1 if h ≥ a
∧ h ≤ b
0 if h ≤ a − α
∧ h ≥ b + β
h−(a−α)
α
if h > a − α
∧ h < a
(b+β)−h
β
if h > b
∧ h < b + β
For example, for t = orange we have a triangular
subset with (a = 21, α = 21, β = 22) :
f
orange
(h) =
0 if h ≥ 43
h
21
if h < 21
43−h
22
if h ≥ 21
For t = green we have a trapezoidal subset with
(a = 75, α = 22, b = 95, β = 33) :
f
green
(h) =
1 if h ≥ 75
∧ h ≤ 95
0 if h ≤ 43
∧ h ≥ 128
h−43
22
if h > 43
∧ h < 75
128−h
33
if h > 95
∧ h < 128
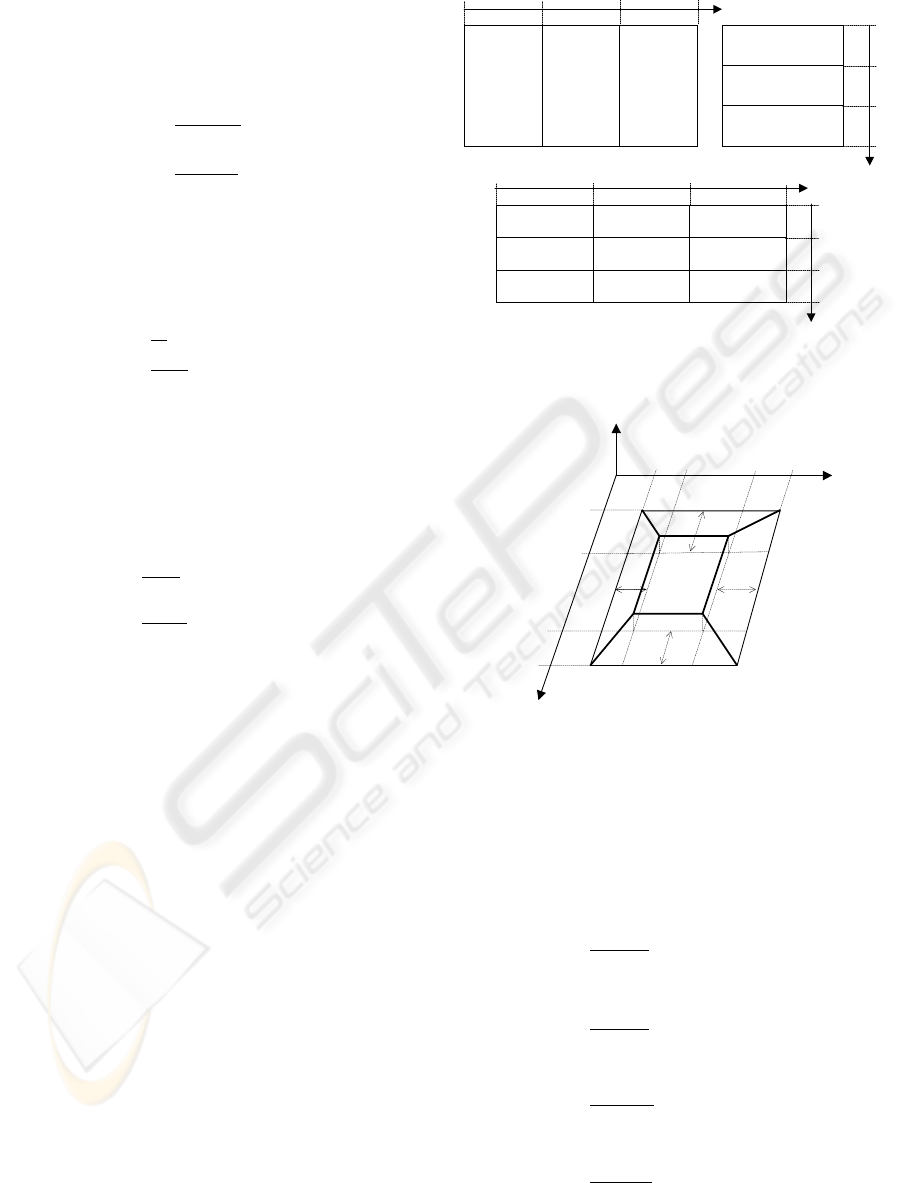
Moreover if we want to complete the modelisation,
it is necessary to take into account the two other di-
mensions (L,S). A scale representing the colorimetric
qualifiers is associated to each dimension. These two
intervals are divided into three: the first subinterval
corresponds to a low value, the second to an aver-
age value and the last to a strong value. This division
gives for saturation S: ”dull”, ”moderately dull” and
”saturated”; and for lightness L: ”gloomy”, ”heavy”
and ”pallid”.
These two scales are then aggregated to give nine
qualifiers for colours defined by the following set (cf.
figure 5) (Truck et al., 2001b):
Q = { somber, dark, deep, gray, medium, bright,
pale, light, luminous }.
Each element of the set Q is associated to a
membership function varying between 0 and 1 (
˜
f
q
with q ∈ Q). For these functions the intersection
point value is also supposed equal to 1/2 (cf. fig-
ure 7). Every function is represented through the set
(a, b, c, d, α, β, γ, δ) (cf. figure 6).
The membership function of any qualifier q is de-
fined below :
dull
m oderatel
y
saturated
saturated
gloom y
heavy
pallid
som ber
gray
pale light lum inous
m edium
dark
bright
deep
0
85 170
255
S
0
85
170
255
L
L
255
170
85
0
0
85 170
255
S
Figure 5: Fundamental colour qualifiers
L
S
c
-
γ
d +
δ
d
c
a
-
α
a
b +
β
b
f
β
α
δ
γ
Figure 6: Trapezoidal 3-D fuzzy subset
∀q ∈ Q,
˜
f
q
(l, s) =
1 if a ≤ s ≤ b
∧ c ≤ l ≤ d
0 if a − α ≥ s ≥ b + β
∨ c − γ ≥ l ≥ d + δ
l−(c−γ)
γ
if c − γ < l < c
∧ αl − γs ≤ αc − γa
∧ βl + γs ≤ βc + γb
(d+δ)−l
δ
if d < l < d + δ
∧ βl − δs > βd − δb
∧ αl + δs > αd + δa
s−(a−α)
α
if a − α < s < a
∧ αl − γs > αc − γa
∧ αl + δs ≤ αd + δa
(b+β)−s
β
if b < s < b + β
∧ βl + γs > βc + γb
∧ βl − δs ≤ βd − δb
IMAGE CLASSIFICATION ACCORDING TO THE DOMINANT COLOUR
507
For example, for q = somber we have (a = α =
0, b = 43, β = 84, c = γ = 0, d = 43, δ = 84) :
˜
f
somber
(l, s) =
1 if s ≤ 43
∧ l ≤ 43
0 if s ≥ 127
∨ l ≥ 127
127−l
84
if 43 < l < 127
∧ l > s
127−s
84
if 43 < s < 127
∧ l ≤ s
255
212
127430
0
43
127
212
255
S
L
f
1
Figure 7: Dimensions L and S
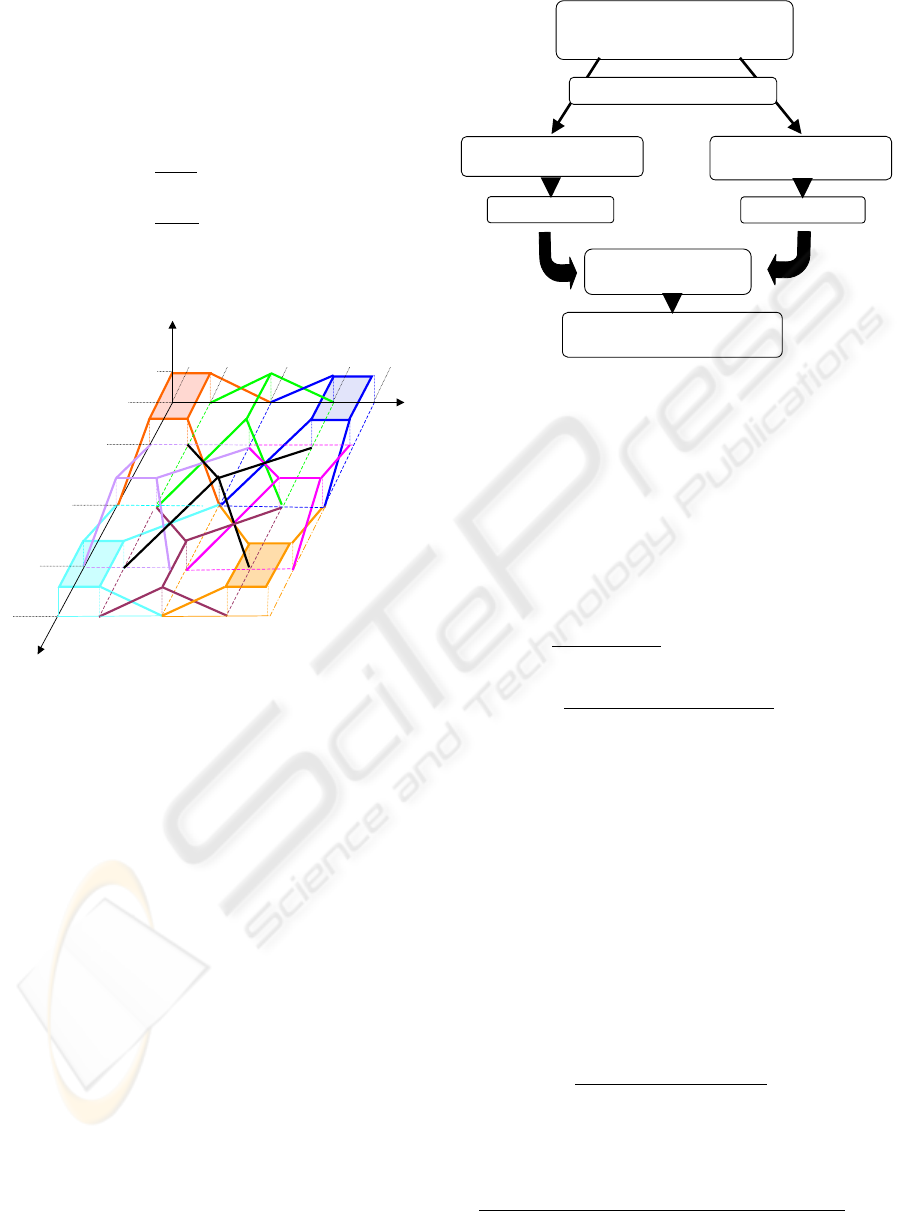
4 IMAGE PROCESSING
The image processing aims at determining a profile
corresponding to the various categories: the nine fun-
damental colours and the nine colour qualifiers (cf.
figure 8). For each pixel of the image we can de-
termine the values taken by the various membership
functions of the categories. For each category the
value obtained corresponds to the ratio between the
sum, on all the pixels of the image, of the member-
ship functions values and the number of pixels, which
gives a quantity between 0 and 1. This quantity is the
membership degree of an image to the given class.
The membership degree of an image to a certain
class is defined as follow:
Let I be an image.
Let P be the set representing the pixels of I, except
pixels more or less white or black.
H LS spac
e
H ue,Lightness,Saturation
9 classes
Every im ageisrepresente
d
through a profile
Every im ageisassigned to oneor
severalclasses
Fundam entalcolours
qualifiers(L,S)
9
s
u
b
-
classe
s
Fuzzy representatio
n
9 fundam entalcolours(H )
Figure 8: Image processing
Each element p of the set P is defined by its colour
coordinates (h
p
, l
p
, s
p
). p can be one pixel or a set
of pixels. We can calculate the functions f
t
(h
p
),
˜
f
q
(l
p
, s
p
) for t ∈ T and q ∈ Q.
Let F
t
and
e
F
t,q
be the following functions, repre-
senting the membership degree of I to the classes t
and (t, q):
• F
t
(I) =
P
p∈P
f
t
(h
p
)
|P|
∀t ∈ T
•
e
F
t,q
(I) =
P
p∈P
˜
f
q
(l
p
, s
p
) × g
t
(h
p
)
|P|
∀(t, q) ∈ T × Q
with g
t
(h
p
) =
½
1 if f
t
(h
p
) 6= 0
0 else
Example 1 Let us consider only 2 pixels p
0
and p
1
to
simplify.
p
0
:
(
h
p
0
= 178
l
p
0
= 50
s
p
0
= 100
, p
1
:
(
h
p
1
= 173
l
p
1
= 255
s
p
1
= 128
• f
blue
(h
p
0
) = f
blue
(178) = 0.9
˜
f
somber
(l
p
0
, s
p
0
) =
˜
f
somber
(50, 100) = 0.34
• f
blue
(h
p
1
) = 1,
˜
f
somber
(l
p
1
, s
p
1
) = 0
So, for class ”blue” the value shall be:
F
blue
(I) =
f
blue
(h
p
0
) + f
blue
(h
p
1
)
2
= 0.95
And for class ”somber” from ”blue”, the value
shall be:
˜
f
somber
(l
p
0
, s
p
0
) × 1 +
˜
f
somber
(l
p
1
, s
p
1
) × 1
2
e
F
blue,somber
(I) = 0.17
ICEIS 2004 - ARTIFICIAL INTELLIGENCE AND DECISION SUPPORT SYSTEMS
508
Every image is defined by a profile of 90 elements
(|T | + |T × Q| = 9 + 81). A profile can be presented
as follows :
[ F
t
(I),
e
F
t,q
(I)]
Im age (I)
F
red
(I)
F
orange
(I)
F
red,som ber
(I) F
red ,dark
(I)
… …
…
~ ~
Figure 9: Profile representing an image
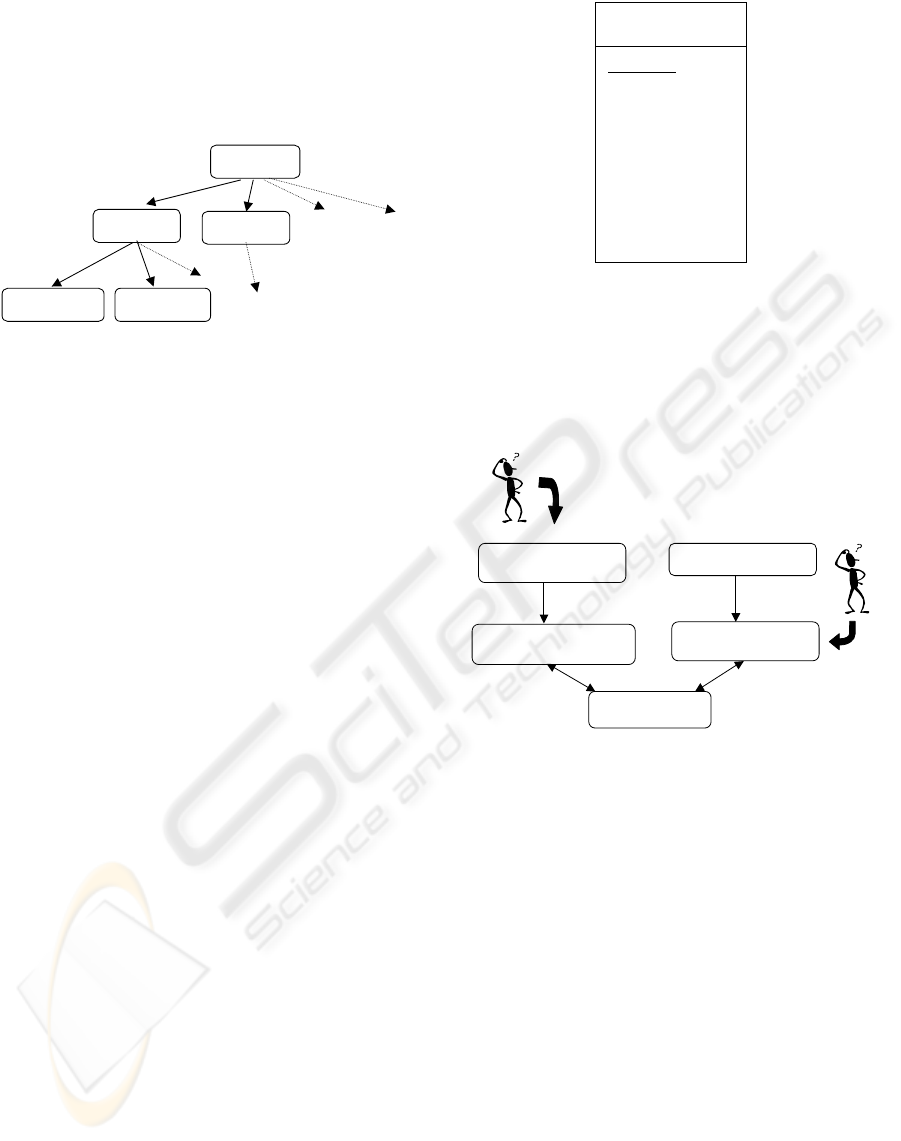
An image can be assigned to several classes, there
are 90 classes, 9 principal : C
t
with t ∈ T , and 81
subclasses which correspond to a refinement of the
research:
e
C
t,q
with (t, q) ∈ T × Q.
As shown in figure 9 the classes can be represented
through a tree with father-son relationship, the classes
C
t
with t ∈ T can be considered as fathers and the
classes
e
C
t,q
with (t, q) ∈ T × Q as their sons. For
example the father class of class
e
C
red,somber
is C
red
.
let us denote:
• F
∗
(I) = max
t∈T
(F
t
(I))
•
e
F
∗
t
(I) = max
q∈Q
(
e
F
t,q
(I)) ∀t ∈ T
An image I will be assigned to:
• The classes C
t
if F
t
(I) ≥ F
∗
(I) − λ.
with λ a tolerance threshold.
• The classes
e
C
t,q
if F
t
(I) ≥ F
∗
(I) − λ and
e
F
t,q
(I) ≥
e
F
∗
t
(I) − λ.
An image can be assigned to several classes, and it
can be assigned to a subclass only if it is also assigned
to its father class. For example, an image cannot be
assigned to ”red, bright” class (
e
C
red,bright
) if it is not
assigned to the ”red” one (C
red
).
5 PRESENTATION OF THE
SOFTWARE
Information concerning the images are stored in a
database (cf. figure 10). That helps us to optimise the
exploitation of these information. Each image will be
represented through its profile previously defined.
The software is divided into two sections, the first
one corresponds to the treatment and the insertion of
Image
Image Id
Name
Size
F
red
(I)
F
orange
(I)
…
F
red, somber
(I)
F
red, dark
(I)
…
…
~
~
Figure 10: Database
the images in the database, the second one to the ex-
ploitation of this database through requests with lin-
guistic terms (cf. figure 11).
N ew im agein the
databas
e
Im ageprocessing and
determ ining itsprofile
D atabase
Searching forim ages
D efinition ofthe search
criteri
a
Figure 11: human-computer interaction
The image processing aims at building its profile.
In the first section, a window allows us to select and
display the image to be inserted in the database. Once
the image is inserted the software displays all the
stored images.
In the second section, the user of the software will
have the possibility of carrying out research on two
levels. The first one corresponds to the nine funda-
mental colours (dimension H), the second one to the
nine colour qualifiers. For example, the images whose
dominant colour is ”blue” for the first case and the im-
ages whose dominant colour is ”luminous blue” for
the second (cf. figures 12 and 13).
Once the Hue is selected, the user has the possibil-
ity to refine his request by specifying a colour quali-
fier. For that, it is enough for him to choose one pro-
posed in the list, or to click on the corresponding zone
in the image.
IMAGE CLASSIFICATION ACCORDING TO THE DOMINANT COLOUR
509
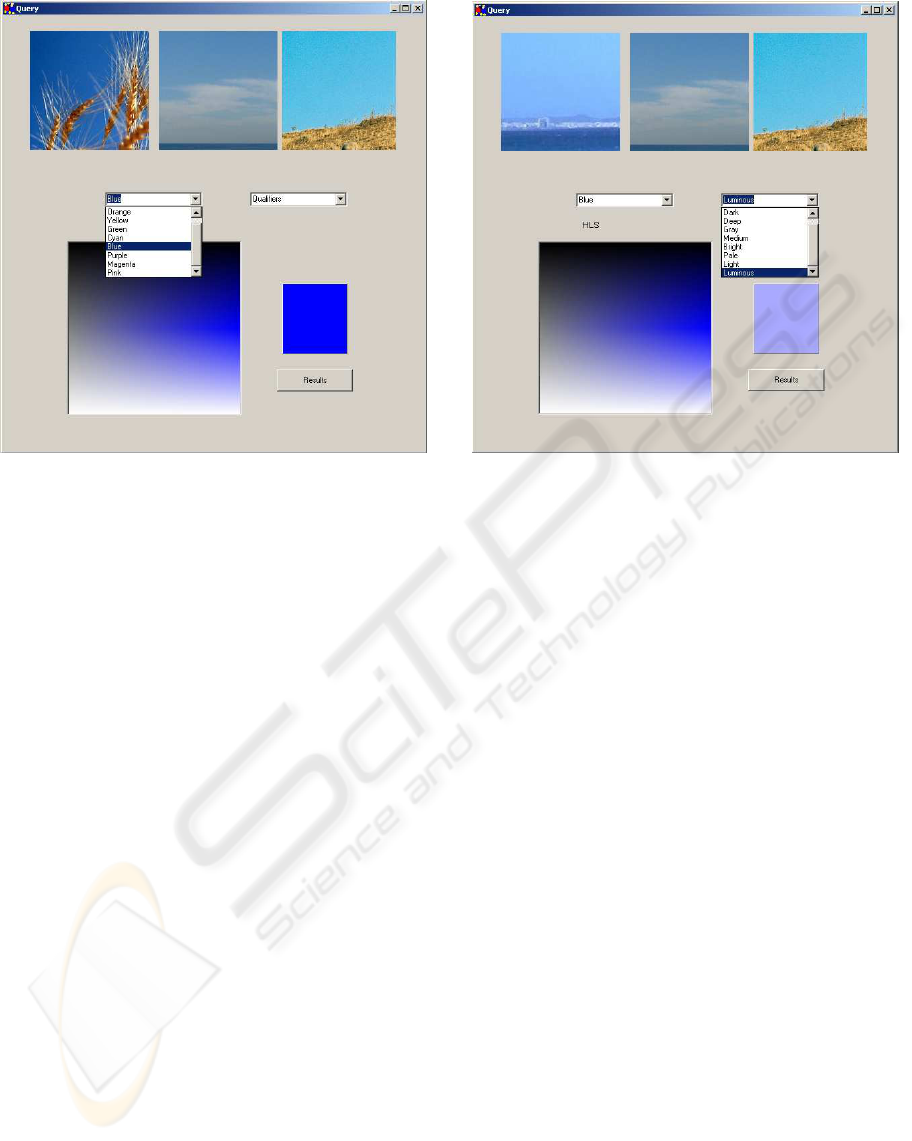
Figure 12: Query with only a color.
6 CONCLUSION
We developed in this work an approach allowing us
to classify images according to their dominant colour.
We limited ourselves to fundamental colours and nine
colour qualifiers; those can be widened without mod-
ifying the approach, we only have to make few modi-
fications in the software. Moreover, as we have seen,
black and white pixels have not been treated yet: the
next perspective is to add two other classes for these
special ”colours”.
For the image extracting from the database, it is not
necessary to browse all the 90 classes defined in sec-
tion 4. We can make a first selection through the nine
fundamental colours and then look at the correspond-
ing sons classes to refine the query.
In the database images are stored with their pro-
files, thus we can extend this approach to look for
images which don’t have a given colour or a set of
colours.
REFERENCES
Bouchon-Meunier, B. (1995). La Logique Floue et ses Ap-
plications. Addison-Wesley.
Foulloy, L. (1990). Du controle symbolique des processus
: demarche, outils, exemples. Phd thesis, Universit
´
e
Paris XI, France.
Hammami, M., Chen, L., Zighed, D., Song, Q., and Louis,
R. (2002). D
´
efinition d’un mod
`
ele de peau et son
Figure 13: Query with a color and a qualifier.
utilisation pour la classification des images. In Pro-
ceedings of the Journ
´
ees Francophones d’Acc
`
es Intel-
ligent aux Documents Multim
´
edias sur l’Internet, Me-
diaNet’2002, pages 187–198, Sousse, Tunisie.
Herrera, F. and Martinez, L. (2001). A model based on lin-
gustic two-tuples for dealing with multigranularity hi-
erarchical linguistic contexts in multiexpert decision-
making. In IEEE, Transactions on Systems, Man and
Cybernetics. Part B, pages 227–234.
Le Saux, B. (2003). Classification non exclusive et person-
nalisation par apprentissage : Application
`
a la nav-
igation dans les bases d’images. Phd thesis, INRIA,
France.
Roire, J. (2000). Les noms des couleurs. Pour la science,
hors s
´
erie, n
¦
27 edition.
Truck, I. (2002). Approches symbolique et floue des mod-
ificateurs linguistiques et leur lien avec l’agr
´
egation.
Phd thesis, Universit
´
e de Reims Champagne-Ardenne,
France.
Truck, I., Akdag, H., and Borgi, A. (2001a). A symbolic ap-
proach for colorimetric alterations. In Proceedings of
the 2nd International Conference in Fuzzy Logic and
Technology, EUSFLAT 2001, pages 105–108, Leices-
ter, England.
Truck, I., Akdag, H., and Borgi, A. (2001b). Using
fuzzy modifiers in colorimetry. In Proceedings of the
5th World Multiconference on Systemics, Cybernetics
and Informatics, SCI 2001, pages 472–477, Orlando,
Florida, USA.
ICEIS 2004 - ARTIFICIAL INTELLIGENCE AND DECISION SUPPORT SYSTEMS
510
