
VIEW VISUALISATION FOR ENTERPRISE ARCHITECTURE
From conceptual framework to prototype
Maria-Eugenia Iacob, Diederik van Leeuwen
Telematica Instituut, Drienerlolaan 5, 7500AN Enschede, The Netherlands
Keywords: Enterprise architecture, View, Viewpoint, Model, Graph layout, Visualisation
Abstract: In this paper we address the problem of visualisation
of enterprise architectures. To this purpose a
framework for the visualisation of architectural views and the design of a visualisation infrastructure are
presented. Separation of concerns between storage, internal representation and presentation is the main
requirement for setting up this framework, since it will allow us to select and subsequently present
differently the same content (models) to different types of stakeholders. Our approach has resulted in an
operational prototype that has been tested in a pilot case, also presented in what follows.
1 INTRODUCTION
Enterprise architecture (EA) is a coherent whole of
principles, methods and models that are used in the
design and realisation of the enterprise’s
organisational structure, business processes,
information systems, and infrastructure (Bernus et
al., 2003). However, these domains are not
approached in an integrated way, which makes it
difficult to judge the effects of proposed changes.
Every domain speaks its own language, draws its
own models, and uses its own techniques and tools
for visualisation. Communication and decision
making across domains is seriously impaired.
One of the goals of the ArchiMate (see the
acknowledgement) p
roject is to provide the
enterprise architect with instruments that support
and improve the disclosure and visualisation of
enterprise architecture without being obstructed by
the narrowness of specific domains.
Views and viewpoints are essential elements of
th
e disclosure of enterprise architecture descriptions.
Following (IEEE, 2000), viewpoints are templates
for view creation that define the addressed
stakeholder, his concerns and the information he
needs for understanding the enterprise from his
perspective and for taking responsibility for his
decisions.
This paper presents the creation of a viewpoint-
dri
ven visualisation prototype. Starting point for this
prototype is the ArchiMate conceptual framework
for enterprise architecture visualisation, which
establishes the integration of heterogeneous content
(models) and the differentiation of this content
towards stakeholders (Section 2). From the
conceptual framework a visualisation infrastructure
is derived (Section 3), which realises the desired
integration and differentiation. Finally the
visualisation infrastructure serves as a template for a
visualisation prototype (Section 4).
2 CONCEPTUAL FRAMEWORK
In this section we present a framework for the
disclosure and visualisation of enterprise
architectures. Separation of concerns (Dijkstra,
1976) between storage, internal representation and
presentation is the main requirement for setting up
this framework, since it will allow us to select and
subsequently present the same information (models)
to different types of stakeholders. The challenge for
such a framework is to facilitate the visual
presentation without having to change the
underlying infrastructure every time a new type of
stakeholder is added or the information need of an
existent stakeholder changes.
Visualisation of enterprise architecture is
conce
rned with the presentation of views that may
contain models, text and other types of content to
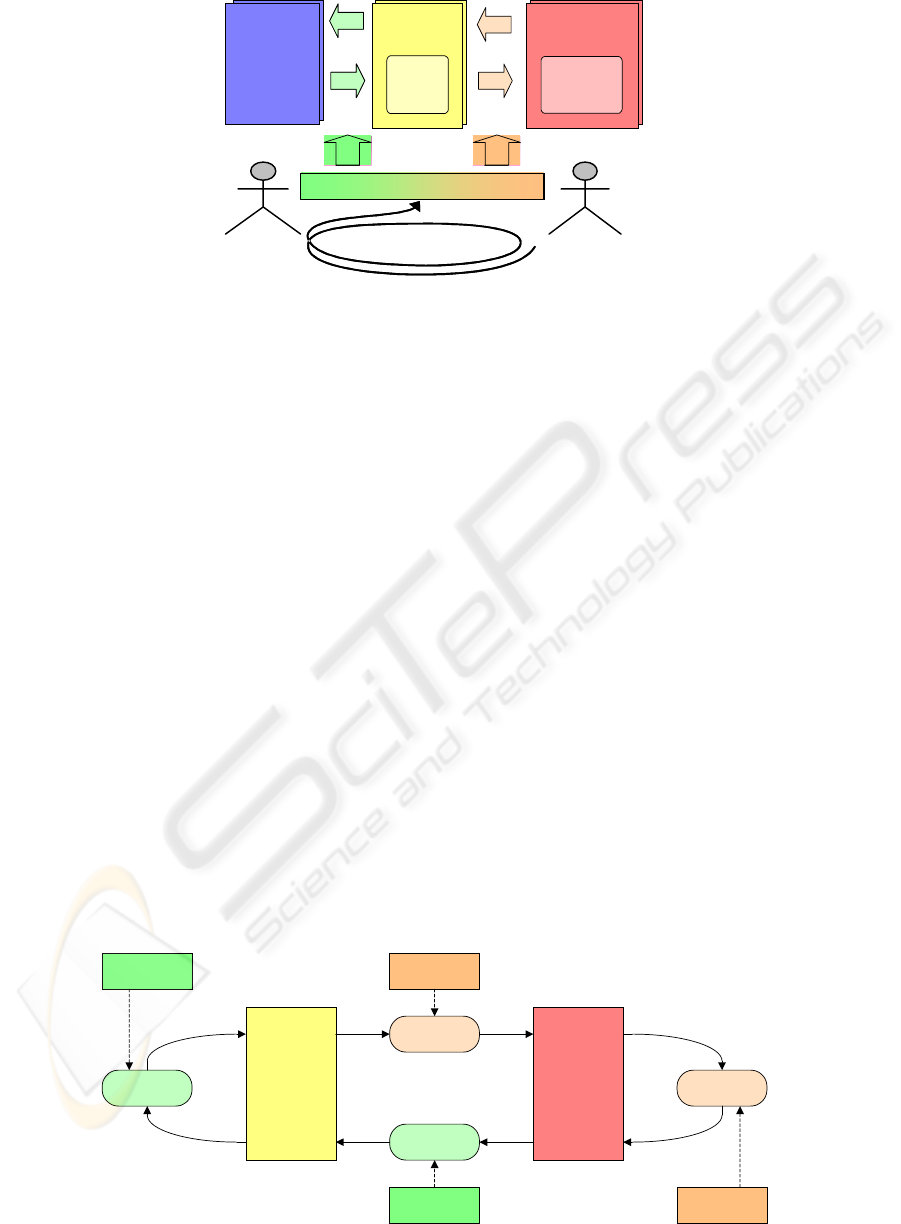
different types of stakeholders. Figure 1 expresses
the conceptual architecture that underlies our
approach to visualisation (based on ideas from
Schönhage, B. & A. Eliëns, 1997). We assume the
existence of a repository of models, describing the
architecture. The view content is a selection from the
629
Iacob M. and van Leeuwen D. (2004).
VIEW VISUALISATION FOR ENTERPRISE ARCHITECTURE - From conceptual framework to prototype.
In Proceedings of the Sixth International Conference on Enterprise Information Systems, pages 629-634
DOI: 10.5220/0002610606290634
Copyright
c
SciTePress
Presentation
Presentation
Viewpoint
Viewpoint
Models
Models
Model
View
presentation
View
content
select
derive
select
derive
visualise
updateupdate
update
content
space
presentation
space
ViewpointViewpoint
Architect
Stakeholder
Architect
Stakeholder
Figure 1: Information objects in the viewpoint architecture.
models stored in this repository, possibly augmented
with analysis results and subjected to operations
such as abstraction and refinement.
The view content is expressed in terms of
modelling concepts, stakeholders, and concerns. The
view content can be presented in different ways.
This presentation is expressed in terms of a
presentation space, containing e.g. edges, nodes,
text and/or charts and tables.
Editing operations on this presentation can lead
to updates of the view content and consequently of
the underlying model.
The separation between content and visualisation
is essential to obtain an easily adaptable architecture.
Arguments sustaining this statement one can also
find in the Model/ View/ Controller design pattern
of Gamma et al., 1995, and the work of Pattison et
al. 2001 and Schönhage et al. 1998. Thus, if the set
of model concepts is changed, or if a new form of
presentation is added, the impact of these changes
can be kept local. Only the relations between model
concepts and visualisation concepts need to be
updated.
2.1 Viewpoints
According to the IEEE-1471 standard, the
architecture stakeholders have viewpoints that result
in views containing models that feed the
stakeholders’ information presentation needs. A
viewpoint establishes the purposes and audience for
a view and the techniques or methods employed in
constructing the view (IEEE, 2000). We have
adopted this approach as basis for the understanding
and use of the viewpoint concept in our visualisation
infrastructure. Furthermore, we do not strive for a
fixed set of viewpoints. Instead, we assume that the
architect and stakeholder should be provided with
the means to construct their own viewpoints from
basic elements. Since the idea of viewpoints
revolves around selecting the right content from a
set of (possibly large) models and choosing a
suitable presentation for this selection, we opt for a
rule-based solution. Viewpoint rules are the basic
building blocks of a viewpoint. First, they describe
which content is selected (according to selection
rules) from the model (or another view) and how it
is presented (according to presentation rules), and
secondly, they are used to map (according to
interpretation rules) edit operations (executed
according to interaction rules) on the view
presentation back into the model.
In Figure 1, things were simplified a bit. In
practice, a viewpoint consists of different types of
rules, governing the content and presentation of
View
presentation
Presentation
rules
Interaction
rules
Present
Interact
View content
Selection
rules
Interpretation
rules
Interpret
Select
Fi
g
ure 2: View data flow.
ICEIS 2004 - INFORMATION SYSTEMS ANALYSIS AND SPECIFICATION
630

views, and controlling the interaction with and
interpreting changes to the view presentation.
Furthermore, a view might itself be based on another
view, leading to a chain of views instead of a single
step from a model to the view content. Since this
view content is expressed in the same concepts as
the model (Figure 1), the distinction between model
and view content is immaterial. This leads us to the
data flow picture of Figure 2, which basically
describes the cyclic process behind the interaction of
a user (or stakeholder) with models (or views).
3 VISUALISATION
INFRASTRUCTURE
In this section the conceptual ideas of Figure 1 and
2, are translated into a more concrete visualisation
infrastructure design. In doing so, we distinguish
between the specification and the use of viewpoints.
As opposed to the conceptual view, a tool
infrastructure requires a distinction between models
and view content. Although models and view
content are expressed using the same concepts, they
may be stored differently (in terms of location,
duration and format). Models, view content and
view presentations serve different purposes and have
different life durations and cycles. While models
preserve, describe and document the architecture at
several moments in its existence, the generation of
view content is used as a work instrument.
Whenever an architectural change or architecture
information retrieval is needed view content that can
be altered or annotated is generated out of the
models. This does not necessarily mean that the
original models will be also altered. Sometimes the
purpose is to interactively change or analyze data.
Sometimes the purpose is just to look at an overview
or a cross-section of complex data. Therefore,
compared to models, view content has a provisional
existence. In what concerns view content
visualisations the perishable character is even more
obvious. Multiple visualisations of the same view
content can be created to serve the visual
preferences of one individual or the information
needs of various stakeholders.
Therefore, all these different purposes and uses
impose different tools for their presentation,
manipulation or query. Because of the variety of
tools on the content side and of tools on the
presentation side, a monolithic tool bringing together
all functionality would harm the reusability and
extensibility of the visualisation infrastructure.
Therefore we propose a component-based
infrastructure with clear interfaces between
components (Figure 3).
The shapes outside the view content manager
and the view presentation manager in Figure 3 (e.g.
model, model manager, user, user interactions)
represent things that are assumed to be already
present. This includes the selection rules,
presentation rules, interaction rules and
interpretation rules, which together embody the
viewpoint specification.
In order to allow both data retrieval and data
manipulation, the infrastructure provides two main
flows: from model to user and from user to model.
Not all user interactions need to be translated back to
the model. Temporary changes serving an impact
analysis might propagate back no further than to the
view content. Personal preferences concerning the
layout of a presentation may even cause user
interactions to propagate no further then the
presentation itself. Note that this behaviour induces
the creation of different view content versions and
view presentation versions that need to be managed.
To allow content tools and presentation tools to
operate independently, we divide the infrastructure
into two main parts: the view content manager and
the view presentation manager.
The view content manager incorporates two
components:
Selector – The selector uses selection rules from
View presentation manager
View
presentation
Presentation
rules
Interaction
rules
Presenter
Interactor
View content manager
View content
Selection
rules
Interpretation
rules
Model
Model
manager
Interpreter
User
interactions
View content
operations
Model
operations
Selector
Symbol
Library
Fi
g
ure 3: Visualisation infrastructure desi
g
n.
VIEW VISUALISATION FOR ENTERPRISE ARCHITECTURE - From conceptual framework to prototype
631

a viewpoint specification to select and/or transform
data from either a model or view content into view
content.
Interpreter – The interpreter uses interpretation
rules from a viewpoint specification to interpret view
content operations and update a model or view
content accordingly. This is where ambiguous
operations like ‘decrease the average value of …’
may be translated into unambiguous operations like
‘decrease all values with a percentage equal to …’.
The view presentation manager incorporates
again two components:
Presenter – The presenter uses presentation
rules from a viewpoint specification to present view
content into a view presentation. This is where
symbols are associated with view content items and
where layout is associated with view content
structure. To associate symbols with content items,
the presentation rules may use a symbol library.
Interactor – The interactor uses interaction rules
from a viewpoint specification to translate user
interaction into view content operations and/or
changes to the view presentation. This is where user
actions like ‘add’, ‘update’ and ‘delete’ are
translated into view content operations.
The view content manager and the view
presentation manager are no all-embracing tools, but
they should rather be seen as super-types of different
realisations serving different purposes. For instance
the selector or interpreter could be specifically
developed for a single repository (e.g. ASG Rochade
or Oracle); a presenter or interactor could be
specifically developed for a single graphical editing
environment (e.g. Microsoft Visio or Rational Rose).
4 VISUALISATION PROTOTYPE
In this section the visualisation infrastructure is
partially validated by means of a case study
performed within a large Dutch financial institution
(DFI). For the sake of confidentiality this institution
will be left anonymous here. First the case essentials
are introduced. Then the visualisation prototype is
discussed.
4.1 Case essentials
One of the domains at DFI is the operational system
architecture, which describes all of the operational
software components and their dependencies (e.g.
input-output dependencies and hierarchical
dependencies). DFI already has a complete
description of their operational system architecture
stored as a database and even has built a web portal
on top of it, but what’s missing is a graphical
presentation of the systems and their dependencies.
Such presentations were created in the past
manually. However this requires considerable effort,
and therefore DFI has recognised their need for a
tool that automatically generates these graphical
presentations. Besides, DFI has formulated a number
of quantitative requirements: thousands of diagrams
(i.e. view visualisations), some of them containing
hundreds of objects, must be generated and
published on the web portal on a daily base.
DFI requested two viewpoints: (1) a viewpoint
focusing a system’s (internal) hierarchy and (2) a
viewpoint focusing a system’s (external) context.
Furthermore, DFI wants to be able to add other
viewpoints or other presentations of the same
viewpoints with minimal effort. All viewpoints are
examples of information retrieval do not incorporate
information manipulation.
4.2 Prototype
The visualisation infrastructure presented in Section
3, distinguishes two main processing flows.
However, since the requested viewpoints only
concern information retrieval, the prototype only
implements the flow from the model to the user
(Figure 4).
The prototype consists of 2 components: the DFI
selector and the DFI presenter. The prefix DFI
illustrates that these realisations are DFI-specific.
DFI’s operational architecture description is
stored in a relational database called system
Microsoft Visio 2002
Visio drawing
Presentation
rules in XML
DFI Presenter
Microsoft Visual Basic
View content
in XML
System
Architecture
DFI Selector
DFI Symbols
Visio stencil
Fi
g
ure 4: Protot
yp
e desi
g
n.
SQL Views
ICEIS 2004 - INFORMATION SYSTEMS ANALYSIS AND SPECIFICATION
632
architecture. The DFI selector uses a set of SQL
views to select view content from that relational
database. The view content is expressed using a
simple but generic XML format designed to store
objects and relations between them:
<?xml version="1.0" encoding="UTF-8"?>
<viewContent name="VP1">
<object id="1" type="System" name="A"/>
<object id="2" type="Subsystem" name="1"/>
<object id="3" type="Subsystem" name="2"/>
<object id="4" type="System" name="B"/>
<object id="5" type="Subsystem" name="1"/>
<relation id="6" type="ChildParent" from="2" to="1"/>
<relation id="7" type="ChildParent" from="3" to="1"/>
<relation id="8" type="ChildParent" from="5" to="4"/>
<relation id="9" type="InputOutput" from="3" to="1"/>
</viewContent>
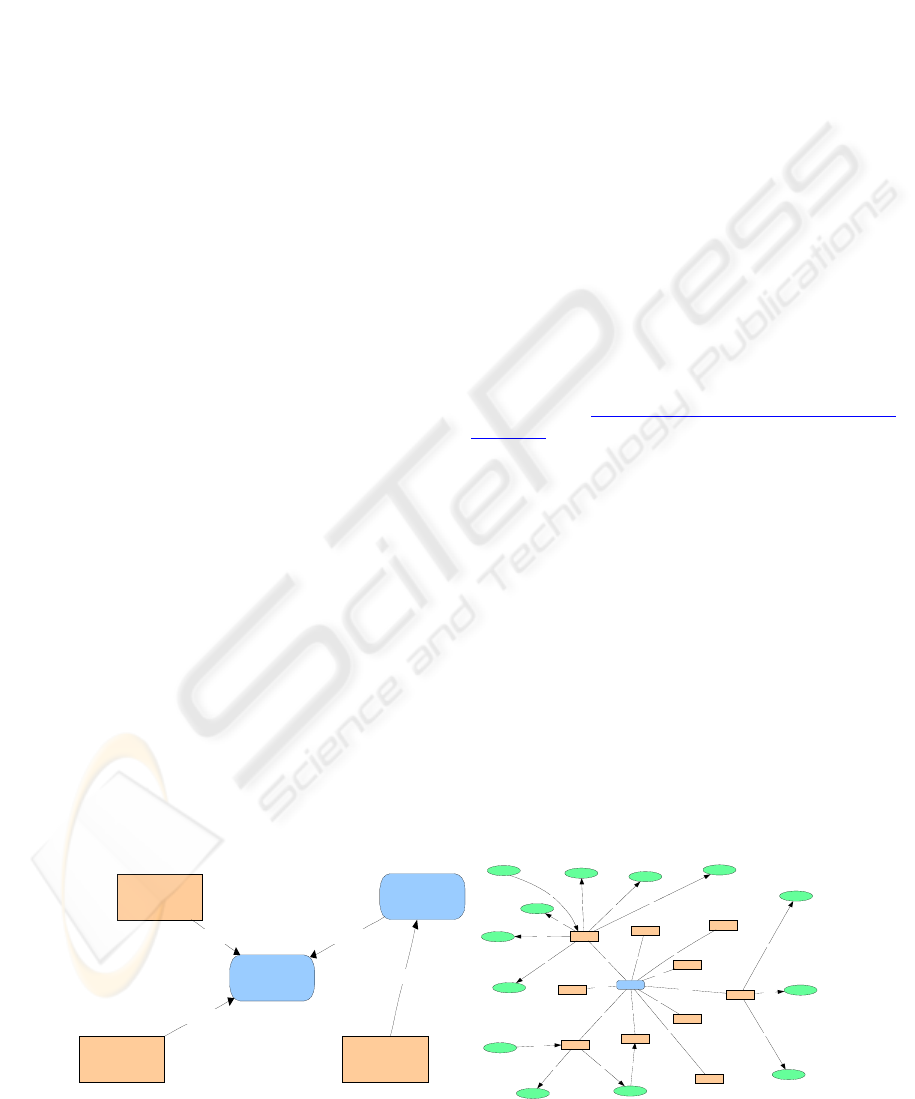
Subsequently the DFI presenter takes this view
content and uses the presentation rules to generate
the Visio Drawing depicted in Figure 5 (left). The
DFI Presenter uses Microsoft Visio to create the
drawings. The argument for selecting Visio was its
powerful API. However, any other similar
environment can fulfil this role.
The presentation rules are expressed using a
simple XML format designed to specify a symbol
library, a layout algorithm and a mapping between
object types and symbols:
<?xml version="1.0" encoding="UTF-8"?>
<presentationRules name="PR1">
<symbolLibrary name="DFI Symbols"/>
<layoutAlgorithm name="Force-directed"/>
<object id="*" type="System" name="*" symbol="1"/>
<object id="*" type="Subsystem" name="*" symbol="2"/>
<relation id="*" type="ChildParent" name="*" symbol="3"/>
<relation id="*" type="InputOutput" name="*" symbol="4"/>
</presentationRules>
The symbol library specified in these
presentation rules refers to the DFI Symbols Visio
stencil. This Microsoft Visio Stencil contains
symbols that are already used by DFI to manually
express their operational system architecture.
At DFI, visualisation of views boils down to
drawing graphs, using special shapes for the nodes
or edges. Therefore, the final display of an
architectural view can be very well controlled with
appropriate graph layout algorithms. The selection
of a particular layout technique is essential because
it ensures the visual specificity of the view content:
For the particular situation of DFI, our choice was to
use a force-directed layout algorithm (Figure 5,
right), which is currently supported by the DFI
presenter. Such algorithms use a physical model to
determine the final drawing. The graph is seen as a
system of forces acting on the vertices. The aim is to
find a drawing where the net force acting on each
vertex is zero. Heuristics are used to bring them to a
state of equilibrium. These algorithms produce very
good layouts for most of the graphs and reveal
symmetries (see the Spring Embedder Model -
Eades, 1984, Kamada and Kawai, 1989,
Fruchterman and Reingold, 1991). We refer to
Herman et al., 2000 and Di Battista et al., 1999 for
extensive surveys of graph drawing algorithms and
other related results. The DFI presenter uses
GraphViz (
http://www.research.att.com/sw/tools/
graphviz/) to layout graphs. GraphViz is an open
source toolkit, which supports a wide range of graph
layout algorithms. Nevertheless, like the choice for
Visio, the choice for GraphViz is arbitrary.
5 CONCLUSION
We have presented a conceptual framework and an
infrastructure for visualization of architecture views.
The main idea behind our framework is the
separation of the visualisation of a view from the
internal representation of its content in such a way
that retrieval and update of models can be
accommodated through arbitrary visualisations. The
separation has two directions. The forward direction
from models to user is straightforward, however the
backward direction from user to models is highly
nontrivial and therefore subject to further research.
DUAS
DUAS_ALGEMEEN
DUAS_BASISREGIST
RATIE
DUAS_BRUTO/NETTO
DUAS_EIV
DUAS_FINANCIEEL_A
FHANDELEN
DUAS_INFO.VOORZIE
NING
DUAS_MIS
DUAS_RDH
DUAS_STANDAARD_
QUERIES
DUAS_ZIE_CLUSTER
S
AANLEVERING_VAN_
VC_ZOETERMEER
CLIENTGEGEVENS_M
_INKOMST EN_V_U
CLIENTGEGEVENS_T
BV_NICOS
EIGEN_BEDRIJF/
FREELANCE_GEGEVE
FB01_/
_INTERFACE_NAAR_S
AP-R3
GEG._OVER_AANGEM
AAKTE_INFO._FO
INTERFACE_NAAR_S
UU
INTERFACE_NSP
NEVENINKOMSTEN_G
EGEVENS_TBV._N
SPONTANE_MELDER
S_NR_V CZ
SPONTANE_MELDER
S_VCZ
VCG-TBV-CVS-
REGULIER_RIJK
ZOETERMEER__-_BIV
EIGENAAR
EIGENAAR
EIGENAAR
EIGENAAR
EIGENAAR
EIGENAAR
EIGENAAR
EIGENAAR
EIGENAAR
EIGENAAR
UITVOER
UITVOER
UITVOER
INVOER
UITVOER
UITVOER
UITVOER
INVOER
UITVOER
UITVOER
UITVOER
INVOER
UITVOER
UITVOER
Fi
g
ure 5: Two view
p
resentations.
Subsystem 1Subsystem 2
System B
System A
Subsystem 1
ChildParent
ChildParent
ChildParent
InputOutput
VIEW VISUALISATION FOR ENTERPRISE ARCHITECTURE - From conceptual framework to prototype
633

The visualisation infrastructure that we have adopted
assumes that the view presentation manager is
ignorant of modelling concepts and semantics; when
it receives events that indicate modifications of the
view content, it will propagate these events to the
view content manager on the basis of a viewpoint’s
interpretation rules. On this foundation and in order
to validate our ideas in an operational environment
we have built a visualisation prototype. This
prototype allows easy adaptations to the view
presentations that have been realised: specifying a
different symbol library, a different layout algorithm
or a different mapping between objects and symbols
results in a completely different view presentation.
Furthermore, adding a new viewpoint does not
involve changes to the prototype infrastructure: the
prototype only needs a new set of SQL views, a new
file containing the presentation rules and a Visio
stencil containing the desired symbols.
In the near future we will extend the prototype to
present views based on more than one domain.
Nevertheless, a complete validation of the
visualisation infrastructure requires further
investigation, especially into the flow from user to
models.
At this point of our research we foresee a
number of issues that need further investigation:
– Viewpoint specification language – A viewpoint
specification language is needed to be able to
express selection rules, presentation rules,
interaction rules and interpretation rules.
– Automatic layout – Automatic layout of views and
diagrams is essential for generation of views for
different types of stakeholders. In the future
versions of the prototype, presentation rules will
support choosing layout algorithms and strategies
from a library.
– Multi-modal presentations - How can the view
presentation manager generate and manage view
presentations that contain multiple modalities (e.g.
an important combination is that of diagrams and
explaining text or comments)? How are relations
between modalities specified in presentation and
interaction rules?
ACKNOWLEDGEMENT
This paper is supported by the ArchiMate project
(
http://archimate.telin.nl/), a research initiative that
aims to provide concepts and techniques to support
enterprise architects in the visualisation,
communication and analysis of architectures. The
ArchiMate consortium consists of ABN AMRO,
Stichting Pensioenfonds ABP, the Dutch Tax and
Customs Administration, Ordina, Telematica
Instituut, Centrum voor Wiskunde en Informatica,
Katholieke Universiteit Nijmegen, and the Leiden
Institute of Advanced Computer Science.
REFERENCES
Bernus, P., Nemes, L. and Schmidt, G., 2003. Handbook
on Enterprise Architecture, Springer.
Dijkstra, E.W., 1976, A Discipline of Programming,
Prentice-Hall.
Di Battista, G., Eades, P., Tamassia, R. and Tollis, I.G.,
1999, Graph Drawing: Algorithms for the
Visualization of Graphs, Prentice Hall, 1999, ISBN: 0-
13-301615-3.
Eades, P., 1984, An Heuristic for Graph Drawing,
Congressus Numerantium, vol. 42, 149-160, 1984.
Fruchterman T.M.J. and. Reingold, E.M., 1991, Graph
Drawing by Force-Directed Placement, Software -
Practice & Experience, 21, pp. 1129-1164, (1991).
Gamma, E., R. Helm, R. Johnson and Vlissides, J., 1995,
Design Patterns – Elements of Reusable Object-
oriented Software, Addison-Wesley, 1995.
Herman, I., Melaçon, G. and Marshall, M.S., 2000, Graph
Visualisation and Navigation in Information
Visualisation: A Survey, IEEE Transactions on
Visualization and Computer Graphics, 6(1), pp. 24-43,
2000.
IEEE, Architecture Working Group, 2000. IEEE Std 1471-
2000, IEEE Recommended Practice for Architectural
Description of Software-Intensive Systems. IEEE.
USA.
Kamada, T. and Kawai, S., 1989, An Algorithm for
Drawing General Undirected Graphs, Information
Processing Letters, 31, pp. 7-15, (1989).
Pattison, T., Vernik, R. and Phillips, M. 2001. Information
visualisation using composable layouts and visual
sets. Research Report DSTO-RR-0216, Defence
Science & Technology Organisation,
www.dsto.defence.gov.au/corporate/reports/DSTORR
-0216.pdf.
Schönhage, S.P.C., Bakker, P.P. and Eliens, A., 1998, So
Many Users - So Many Perspectives. In Proceedings
of "Designing effective and usable multimedia
systems", 9-10 September 1998, Fraunhofer Institute
IAO, Stuttgart, Germany. IFIP.
Schönhage, B. & Eliëns, A., 1997, A flexible architecture
for user-adaptable visualization, in D. S. Ebert & C.
K. Nicholas (eds.), Workshop on New Paradigms in
Information Visualization and Manipulation ’97,
Conference on Information and Knowledge
Management, 1997, Las Vegas, USA, ACM Press.
ICEIS 2004 - INFORMATION SYSTEMS ANALYSIS AND SPECIFICATION
634
