
STRATEGIC ANALYSIS OF THE ENVIRONMENT
A DSS FOR ASSESSING TECHNOLOGY ENVIRONMENTS
Giovanni Camponovo, Samuel Bendahan, Yves Pigneur
University of Lausanne, Switzerland
Keywords: Decision support system, environmental scanning, strategy alignment
Abstract: Assessing the external environment is an important component of organizations' survival and success.
Unfortunately, a huge amount of information must be collected and processed in order to obtain a thorough
and comprehensive representation of the environment. A decision support system can be very useful in
helping decision makers to organize and analyze this information efficiently and effectively. This paper
outlines a conceptual proposition helping to design such a system by presenting an ontology of the relevant
information elements (actors, issues and needs) and a set of tools to analyze them. This paper also illustrates
a prototype version of one of these tools which supports the analysis of the actors and issues perspectives.
1 INTRODUCTION
Assessing the environment of an organization can be
defined as a search for information about events and
relationships in a company's outside environment,
the knowledge of which can help its top
management to plan the company's future course of
action (Aguilar 1967). Organizations scan their
environment in order to understand the external
forces of change that may affect their future position
so that they can develop effective responses.
Researches from different disciplines recognize
that understanding their own environments and
consequently adapting their strategies to it is highly
important to the organizations' survival and success.
From a systems theory perspective, companies
are seen as complex social open systems (Boulding
1956), which are involved in a variety of exchanges
with a larger system which is globally referred to as
their environment. These exchanges are considered
of primary importance as they are the source of the
input resources required by the organization and the
destination of its output (Katz and Kahn 1966).
The importance of obtaining a thorough
perception of the environment has also been
acknowledged by numerous prominent authors in
strategic management, as shown in the following
paragraphs. In particular, the alignment between the
organization’s strategy and its environment is seen
as essential for performance.
Indeed, one of the fundamental models that lies
at the core of modern strategic management, the so-
called Harvard normative model, makes its essential
contribution by stating that organizations must craft
their strategies based upon the prior identification of
the present and future opportunities and threats in
the environment and the match between these and
the organization's unique strengths and weaknesses
stemming from corporate resources and
competencies (Learned, Christensen et al. 1965).
Many other renowned researchers are proponents
of theories supporting the importance of monitoring
the environment and achieving alignment with
organizational strategy, structure, and performance
(Dill 1958; Bourgeois 1980; Andrews 1987). Some
further advise firms to proactively influence their
environment to attain more favorable conditions
(Porter 1980; Godet 2001).
Additional support can be found in the disruptive
technologies literature. It suggests that established
firms often fail to cope with a changing environment
due to their focus on current customers. This hinders
them from perceiving and dealing with change that
does not initially affect their mainstream market but
can later disrupt it (Christensen and Bower 1996).
A few empirical studies support the importance
of environmental scanning and suggest a positive
relationship with organizational performance (Choo
2001). For instance it has been found that higher-
performing firms are characterized by more frequent
scanning and by more careful tailoring of scanning
122
Camponovo G., Bendahan S. and Pigneur Y. (2004).
STRATEGIC ANALYSIS OF THE ENVIRONMENT A DSS FOR ASSESSING TECHNOLOGY ENVIRONMENTS.
In Proceedings of the Sixth International Conference on Enterprise Information Systems, pages 122-129
DOI: 10.5220/0002614401220129
Copyright
c
SciTePress
to perceived strategic uncertainty (Daft, Sormunen et
al. 1988) and that firms having advanced
environment monitoring systems exhibited higher
growth and profitability than firms that did not have
such systems (Subramanian, Fernandes et al. 1993).
Research has shown that environmental analysis
becomes even more essential in industries which are
characterized by disruptive, uncertain and complex
environments. These are commonly considered as
the major drivers of environmental scanning (Daft,
Sormunen et al. 1988; Boyd and Fulk 1996).
Ironically, these characteristics that increase the
value of scanning also make it more difficult and
costly. Such environments usually characterize
technologically intensive industries such as the
mobile business, e-business and software industries.
Unfortunately, while the development of
knowledge has produced many techniques to deal
with parts of the problem, there is no easy
methodology allowing for a systematic assessment
of the environment (Andrews 1987, p. 39).
Moreover, due to the huge amount of information to
be collected and processed, decision makers should
be assisted by decision support systems providing
them the tools to systematically take advantage of
the information at their disposal (Aguilar 1967).
The main objective of this paper is to provide
conceptual foundations which aim to facilitate the
development of an environmental decision support
system. In particular, the paper provides an ontology
indicating the relevant elements to monitor and their
relationships. This ontology, presented in section 2,
provides insights on how to structure the collected
information. In addition, the paper provides a set of
complementary analytic and visualization tools (see
section 3) which allow users to analyze this
information from different perspectives, thus
providing a complete image of the environment.
A prototype tool is presented in section 4 in
order to give a preliminary idea of the usefulness of
an environmental DSS. At the time of writing, this
tool integrates only a subset of the proposed
elements, but it will be extended in future work.
2 ENVIRONMENT ONTOLOGY
This section presents a conceptual framework
intended to facilitate the collection and organization
of the relevant information by indicating the
elements to monitor and their relationships.
Although the relevant elements to observe
essentially depend on the specific context under
study, it is possible to describe a set of sufficiently
abstract elements that should be assessed in any
environment analysis. In a concrete case, these
elements can be instantiated so as to match the
particularities of the context under study.
In order to identify these elements, the literature
was reviewed to identify and compare the elements
proposed by the various existing approaches. In fact,
there is a variety of complementary approaches
which are focused on different environmental
dimensions and have different scopes such as the
competitor, competitive, business, technology and
market intelligence, environment scanning, actors-
issues models etc. (Choo 1999).
From the analysis of these approaches, three
elements show up as highly relevant: the market, the
actors and the issues. The market is the key element
proposed by the business and market intelligence,
but is at least mentioned by all other approaches.
Analysis of the actors is advised by actor-issues
methods, competitor, competitive and business
intelligence. Finally, issues are the key proposal of
actor-issues methods and environmental scanning.
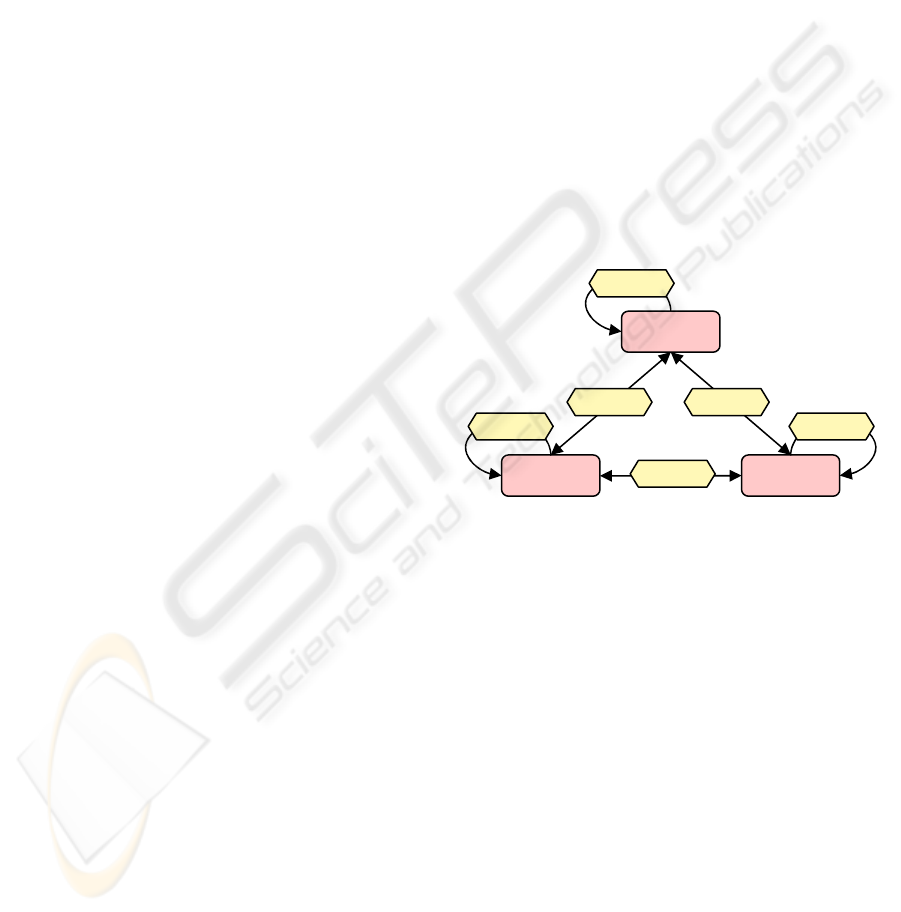
These elements are intertwined by a series of
influence relationships as depicted in Figure 1
The market or use perspective represents the
demand side of the organization's environment.
According to Kotler (Kotler 2003, p. 11), assessing
the market basically implies investigating the end
user needs and how they are translated into wants
(desires to buy specific products to satisfy these
needs) and demands (capacity and willingness to pay
for these products). It is also important to understand
how customers value the various elements of the
value propositions (a sets of benefits embodied in a
combination of products and services that satisfies
certain needs) and choose the solution to adopt.
Research in marketing has shown that the market
is not a homogeneous group, but that buyers tend to
have individual needs, behaviors and preferences. A
process of segmentation is commonly used to
identify "groups of customers that have similarities
in characteristics or needs that are likely to exhibit
similar purchase behavior" (Smith 1956). It is vital
to gather information about the customers (i.e. in
terms of socio-demographic, psychographic and
ACTORS
MARKET
ISSUES
Influence
Influence
Influence
Influence
Influence
Influence
Figure 1: environmental ontology
STRATEGIC ANALYSIS OF THE ENVIRONMENT: A DSS FOR ASSESSING TECHNOLOGY ENVIRONMENTS
123

behavioral variables) that compose each segment.
Knowledge of customers' needs, wants, demands
and segments allows firms to conceive more
attractive value propositions and to gain substantial
competitive advantage. Actually, some firms try to
integrate their customers in the value proposition
design (i.e. through mass customization).
The actors perspective represents the supply side
of the environment. The relevant actors are those
that have the power of directly or indirectly
influence the organization's performance.
Among these actors, a prominent place is taken
by the different players that contribute to satisfy the
same end-user needs. As illustrated by Porter (Porter
1980), these players principally include not only the
organization's existing direct competitors, but also
the players in adjacent industries along the value
system such as suppliers, distributors, new entrants
and substitute product producers.
However, other influential players in diverse
environmental areas must be taken into account. It is
indeed suggested to consider all the actors which can
influence the evolution of the environment (Godet
2001). In particular, it is worth considering players
in the less immediate environment such as
regulatory authorities and technology suppliers.
Finally, issues can be defined as open and
debatable questions, events or other forthcoming
developments whose realization can significantly
influence the future conditions of the environment
and, consequently, the ability of the organization to
achieve its objectives (Ansoff 1980). Issues can arise
in different environmental areas such as the market,
technology, regulatory, economic and social areas.
Issues are an important element of environmental
analysis. While the two other elements provide a
good picture of the current conditions, they are not a
sufficient basis for guiding decisions which deploy
their effect in a relatively distant future. In changing
environments, companies must continually look
beyond the current environmental state and assess its
future prospects. Due to the high uncertainty of
future developments, this often leads to establishing
a number of scenarios rather than a single forecast.
In this respect, issues are a good mechanism to
reflect on possible disruption of current conditions
and trends, allowing the development of a broader
set of scenarios. Particularly interesting issues are
those that are open to dispute and upon which actors
have diverging positions and means of influence.
Notice that these elements are consistent with the
observations of Porter, which asserts that industries
with rapidly changing and complex environments
experience significant uncertainties about demand,
strategy and technology (Porter 1980). The proposed
elements cover the mentioned uncertainties: the
market deals with demand uncertainties, actors cope
with supply and its related strategic uncertainties,
and issues cover environmental factors which
include technology (Camponovo and Pigneur 2003).
These elements are inextricably intertwined and
interact through influence relationships. While this
concept is generic, relationships between a particular
pairs of elements have an adapted meaning.
The market and actors are linked by a market
relationship: by adopting certain value propositions
as an expression of their needs, end users influence
the type of products that are offered by the different
actors and hence determine their relative power;
conversely actors can often shape and even create
user needs by offering innovative value propositions.
Market and issues are linked by an adoption
relationship in the sense that the realization of issues
can affect end user needs and, consequently, the
solutions they adopt. Conversely, the adoption of
certain solutions may affect positively or negatively
the probabilities of realization of certain issues.
Actors and issues are linked by a position
relationship. Actors can influence the realization of
certain issues by strategically positioning themselves
on them. On the other hand, the realization of issues
constrains the strategic possibilities open to actors.
Finally influence relationships also exist between
the instances of issues, actors and needs. Actors are
linked by pressure relationships (Porter 1980), issues
by dependency relationships (Arcade, Godet et al.
1999) and needs by a contribution relationships.
These relationships can create a complex
network of indirect relationships between elements.
For instance, the pressure relationships between
actors can potentially change as a result of the
realization of certain issues or shifts in user needs.
3 ANALYSIS TOOLS
This section presents a selection of methods and
tools to collect analyze and visualize information
about the different elements of the previous section.
Before illustrating these methods, it is useful to
remind that there is a wide variety of information
sources that may convey useful information. They
have been categorized by the internal vs. external,
personal vs. impersonal and verbal vs. written
dimensions (El Sawy 1985). For instance, personal
sources include external actors (i.e. competitors,
customers, experts, suppliers, consultants etc.) as
well as internal employees, staff and managers at all
levels. Impersonal sources include internal reports
and enterprise information systems, as well as
external publications such as trade journals, research
reports, the mass media and online sources (El Sawy
1985; Choo 1994).
ICEIS 2004 - ARTIFICIAL INTELLIGENCE AND DECISION SUPPORT SYSTEMS
124

3.1 Market
A good starting point in analyzing the market
perspective is to exploit the wealth of internally
available information. In fact, through customer
interaction, an organization knows a lot about its
market. In addition to the opinions of the various
employees (e.g. sales force, staff, managers,...),
enterprises commonly have sophisticate internal
record systems (e.g. transaction histories, sales
reports, customers databases) which can be exploited
through a variety of data mining techniques. Seldom,
companies also possess market intelligence systems
and internal market research departments.
It is imperative to complement this internal point
of view on the market with external information in
order to avoid overemphasizing current visions,
beliefs and assumptions about the market.
External secondary data consist in market
reports, various business, governmental or academic
studies and publications and published statistics
(demographics, economics, industry...). This data
has a lower cost and is readily available and should
therefore be used first.
Primary data should then be used to gather
complementary information and get fresh insight
into original aspects of the market. Many research
instruments can be used to collect primary data.
The traditional way of investigating end user
needs is by directly asking users to elicit their needs.
There is a variety of quantitative and qualitative
methods including surveys, interviews, customer
visits and focus groups (McQuarrie 1996). Alas,
they are better suited for descriptive research than to
discover actual user needs. Reasons are that users
are hardly conscious of their real needs and are
prone to reporting bias.
An alternative consists in focusing on the user's
behavior. There is a multitude of methodologies
from different research disciplines such as diffusion
studies (studying the link between the characteristics
of an innovation and its diffusion process), adoption
studies (focusing on the individual user's decision to
adopt a particular service), uses and gratification
studies (studying the gratifications sought in
adopting a new service), domestication studies
(studying the societal consequence of domestication
of everyday life technology), observational research
(ethnography, participant, indirect observation,
usability studies) and experimental methodologies
(e.g. simulated shopping experience in a controlled
environment) (Pedersen and Ling 2002; 2003).
Companies must also understand the possible
market evolution. There is a multitude of forecasting
methods, such as various extrapolation techniques,
probabilistic forecast, scenarios, expert opinion,
delphi, buyers' intentions survey,... (Martino 2003).
An interesting approach is to assess the
disruptiveness of emerging value propositions by
comparing them to the ordinary ones on a number of
dimensions (Rafii and Kampas 2002).
3.2 Actors
Understanding the roles of the different actors
participating in a business system is essential
because of their central role in shaping the future
environment state by partly influencing some of the
forces that govern its evolution.
For assessing the role of the key players, it is
recommended to briefly but clearly describe their
business models. This essentially implies describing
the organization's value proposition, its target
customers, its infrastructure (activities and
partnership network) and its financial aspects
(Osterwalder and Pigneur 2002).
Based on the business model of the different
actors, it is also possible to assess the relationships
and interactions among them. The well-known value
chain framework (Porter and Millar 1985), which
defines the value system as composed by a series of
interconnected value-adding activities performed by
the various enterprises along the supply chain, can
be seen as the integration of the participants’
business models. While this framework is adapted to
manufacturing, there are extensions suited to service
providers and brokering activities (Stabell and
Fjeldstad 1998).
While these methods enable us to assess the
relations between entities stemming from exchanges
of value, there are important indirect relationships
between actors that must be taken into account, too.
These have been brilliantly illustrated by Michael
Porter’s five-forces framework (Porter 1980), which
advocates the important effect on the firm by the
pressure of existing competitors, suppliers, buyers,
new entrants and substitute products producers. This
framework can be extended to include other
categories of players in the regulation (Rugman and
Verbeke 2000) and technology areas.
3.3 Issues
Since the main goal of environment analysis is to
anticipate the potential changes that occur in it, it is
argued that the company must look beyond the
current market state and assess the most important
future prospects of its environment. This can be
done by identifying and assessing the major issues
and trends that may affect the environment.
While trends indicate the most likely evolution,
issues determine possible departures from these
STRATEGIC ANALYSIS OF THE ENVIRONMENT: A DSS FOR ASSESSING TECHNOLOGY ENVIRONMENTS
125

trends towards alternative futures. Both elements
must be obviously considered. Issues can be seen as
forthcoming developments which are likely to have
an important impact on the ability of the
organization to achieve its objectives (Ansoff 1980).
Identification of the relevant issues is a difficult
task and is mostly a matter of judgment. It often
must rely on the opinion of a group of experts. A
number of methods can help by fostering creativity
(e.g. brainstorming, assumption reversal, and
analogies), consensus (e.g. delphi, nominal groups)
and collaboration (e.g. group support systems).
Godet proposes a systematic method for
identifying, classifying and prioritizing issues. This
method, called MICMAC, is based on the concept of
influence and dependence between issues and
classifies issues as dominant, relay, dominated and
autonomous (Arcade, Godet et al. 1999).
An interesting category of tools are actor-issues
methods. These basically consider the environment
as a game between multiple actors that try to
influence the factors (i.e. the issues) that govern its
evolution either by mobilizing their resources to
influence the issues outcome directly or indirectly by
influencing (i.e. negotiating with) other actors.
There are a few actor-issue methods which stem
from various disciplines and provide different
information. The MACTOR method (Arcade, Godet
et al. 1999) originates from a systemic perspective
and provides an aggregate overview of the system
under study through a number of computations on
several input matrices. Allas and Georgiades (Allas
and Georgiades 2001) developed a simpler model to
support negotiators, which essentially consists in a
set of graphs that provide strategic information.
Other methods tackle the same problem based on
game theory using expected utility calculations
(Bueno de Mesquita and Stokman 1994).
4 A PROTOTYPE: MASAM
Based on the previous considerations, we conceived
a prototype tool called MASAM based on previous
actor-issues methods so as to integrate the actor and
issue perspectives. It provides a preliminary insight
on the usefulness of a more elaborate system. This
prototype will be extended in forthcoming work to
include the market perspective. In the meantime, this
perspective can be regarded as a particular case of
issues (e.g. social, demographic and economic issues
affecting user needs, wants and demand) and actors
(customers, consumer groups).
MASAM is a tool based on the multi actor-issue
models proposed by Godet (Arcade, Godet et al.
1999) and Allas (Allas and Georgiades 2001).
Actually, it integrates both models, corrects some of
their flaws and adds new features as described in
(Bendahan, Camponovo et al. 2003).
This tool is intended to assist decision makers in
analyzing situations involving multiple actors that
have divergent interests on multiple issues. It helps
them to devise a suitable strategy which takes into
account the interests and potential actions of other
actors as well as the potential disruptive effects of
the realization of certain issues on the environment.
In particular, it can be used to support the selection
of multiparty negotiation strategies or as part of a
more ambitious scenario planning approach.
MASAM is a tool which is based on the
collection of the opinion of a number of experts
about the organization's environment (section 4.1). It
fundamentally consists in a series of transformations
that aggregate and analyze these opinions and
generate valuable information that would be hardly
obtainable from an unassisted analysis of the inputs
(section 4.2). A visualization tool (section 4.3) has
been developed specifically for MASAM (Monzani,
Bendahan et al. 2004), allowing a graphical
representation of this information, providing a
means to easily and intuitively interpret it.
4.1 The inputs
MASAM is a tool which is based on the collection,
aggregation and computation of the opinion of a
number of experts about certain aspects of the
organization's environment.
The first input is a list of the relevant actors and
issues, as defined in sections 3.2 and 3.3. All actors
which have a stake in the current situation and can
influence its outcome, either by influencing issues
directly or by influencing the other actors, should be
considered. As well, it is worth including all issues
which may disrupt the current environmental
conditions, especially those upon which actors have
sensibly diverging positions and means of influence.
The rest of the input consists in matrices that
take into account the influence relationships between
actor and issues or between pairs of actors. The
concepts used to link these elements are called
position, salience, clout and influence.
Position (Pos
a,i
) represents the preferred outcome
of an issue "i" to an actor "a". It is formalized as a
linear continuum between two extreme values on
which actors position themselves.
Salience (Sal
a,i
) denotes the importance of an
issue to an actor. It is measured by the relative utility
that the actor loses if the outcome is not close to
their position. Actors with high salience lose a lot of
utility, while less salient actor are less affected.
Clout (Clo
a,i
) represents the power that an actor
ICEIS 2004 - ARTIFICIAL INTELLIGENCE AND DECISION SUPPORT SYSTEMS
126

has to influence an issue's outcome. The clout value
can be seen as the actual part of control of the issue.
It is supposed that the actors have, altogether, the
power to influence the issue's outcome along the
continuum on which the positions are set. If they
cannot fully influence an issue, a fictive actor
enacting the environmental trends may be used.
Finally, influence (Inf
a,b
) represents the ability of
an actor "a" to influence the decision of another
actor "b". It corresponds to a relationship of power
between the two actors, formalized as the part of
control of one actor over the other. This means that
actors do not have full control on themselves, but
their actions are partly commanded by other actors
that have means of pressure on them. The freedom
that an actor has over its choice represents the actor's
auto-determination coefficient.
The input matrixes can be filled with values of
any scale. They are subsequently standardized so as
to contain values ranging from 0 to 1.
The quality of the input is fundamental. For that
reason, a careful choice of experts is essential to
ensure input quality. In particular, it is suggested to
select experts who are representative of the different
actors’ opinions. Furthermore, it is suggested to use
some methods which can help fostering creativity
(e.g. brainstorming), consensus (e.g. Delphi surveys)
and collaboration (e.g. group support systems).
4.2 The transformations
MASAM proposes a set of transformations of the
input data that provide valuable information for
formulating strategic recommendations. The key
ones are presented below with the corresponding
equations: these allow users to assess indirect
influence, analyze the issues' outcomes and
disagreements, the actors’ true power repartition and
their proximity. Notice that MASAM extends the
Godet’s and Allas’ methods and can thus also
perform the same transformations proposed by them.
Indirect influence of order n (Inf(n)
a,b
) can be
calculated using the following formula to take into
account the fact that actors can not only influence
other actors directly, but also indirectly through
chains of influence passing through third parties.
The user can specify the order of indirect influence,
which defines the maximum length of these chains,
according to the chances that parties have to bargain.
The issues analysis allows the estimation of the
expected outcome (Outcome
i
) for all issues, which
can be calculated using different hypothesis such as
a pure vote based only on clout or integrating direct
or indirect influences. By comparing the actors’
positions with this outcome, it is possible to identify
the divergence of actors (Divergence
a,i
) so as to
identify the actors that may want to challenge the
outcome and how they want to change it.
The actors analysis enables to estimate the
true repartition of power (Power
a
) among actors
considering their clout on the different issues, as
their influence on other actors and the importance of
the different issues. Actors are also compared to
each other by looking at their general agreement on
the different issues: a proximity coefficient can be
calculated to illustrate potential conflicts and
coalitions.
4.3 Output analysis
Thanks to the visualization tool, the user can
obtain an intuitive representation of the output data
which clearly brings to light the key elements. The
most interesting graphs are illustrated thereafter
using data taken from a study of the Public Wireless
LAN industry in Switzerland. The study analyzed
seven actors. Due to lack of space, this example is
not described in this paper, but a description of the
study as well as the visualization tool can be found
in (Bendahan, Camponovo et al. 2003; Monzani,
Bendahan et al. 2004).
The influence graph (Figure 2) summarizes the
influence relationships between actors and their
relative power. Each horizontal bar represents an
actor. The height of this bar is proportional to the
actor's true power, while its length shows who
controls the subject actor. Actors that have a high
()
()
ba,ba,
c
bc,ca,ba,
c
bc,ca,ba,ba,
InfInf(0)
ba cb1)-Inf(n 1)-Inf(n Inf(n)
ba 1)-Inf(n 1)-Inf(n 1)-Inf(n Inf(n)
=
≠∀≠∀⋅=
=∀⋅+=
∑
∑
()
(
)
∑
∑
⋅⋅=
ic
c,ib,iba,a
SalClo Inf(N) Power
()
(
)
()
∑
∑
∑
⋅=
⋅⋅=
a
ia,iia,ia,
a
ba,ib,bia,i
SalOutcome - Pos Divergence
Inf(n) CloPos Outcome
Mobile Network
Operators
Wireline
ISP
Venues
Communities
Telephony
Informatics
Regulator
Mobile
Network
Operators
Wireline ISP
(currently
highlighted)
Venues
Communities
Telephony
Informatics
Regulator
Figure 2: Influence graph
STRATEGIC ANALYSIS OF THE ENVIRONMENT: A DSS FOR ASSESSING TECHNOLOGY ENVIRONMENTS
127

surface are therefore the most influent actors. This
graph can be helpful to view the different means of
pressure that actors can use in their negotiations. In
particular it can help to spot actors which can be
influenced to gain their support as well as consider
defensive strategies to prevent being influenced.
The issues analysis graph (Figure 3) shows the
issues’ expected outcome and the dissatisfaction of
actors on these issues. Each issue is represented as a
bar. The middle of the bar represents the issue’s
expected outcome. On this bar, the actors are placed
according to their dissatisfaction, which depends on
the actor’s position and salience. This graph can help
to identify the actors that are more likely to defend
or challenge the expected outcome: the more an
actor is far from the center, the more it is likely to
exhibit a strong will to challenge the expected
outcome. Actors can also spot their possible allies
and enemies on the different issues.
The relative power of actors is approximately
shown in the influence graph. However, a more
precise vision of the repartition of power can be
obtained from the power repartition graph (Figure
4) which shows how each issue is controlled. The
principle of the graph is similar to the influence
graphs: issues are represented as horizontal bars that
are divided according to the repartition of clout of
actors. The vertical sizes of the bars represent the
issues’ importance (average salience of actors).
Additional indications can be obtained from the
brightness of the surfaces, which is proportional to
the actor’s salience. Actors with large and bright
surfaces are very interesting negotiation parties, as
they can be easily convinced to make concessions
and have the power to influence the outcome.
Finally, the proximity map (Figure 5) places the
actors on a 2D graph giving an overview of the
relative proximity of actors. Actors are positioned
according to their proximity coefficient, showing
how similar are their position on salient issues. This
graph can be used to spot the likely alliances and
conflicts: geographically compact groups of actors
will more likely form alliances, while far away ones
will more likely combat each other on a large
number of issues.
5 CONCLUSIONS
Environmental analysis is a hard task, because it
requires a huge amount of information which is hard
to identify and collect. Many different elements have
to be assessed and integrated to give strategists a
solid base upon which make their decision. For these
reasons, a decision support system is very valuable.
This paper intends to facilitate environmental
analysis by proposing an ontology of the relevant
elements to consider (i.e. markets, actors and issues)
and by suggesting a selection of tools to analyze and
visualize the information in these different
perspectives. In the longer term, we hope that these
elements will support and stimulate the development
of various decision support systems for assessing an
organization’s environment in a comprehensive and
systematic manner.
The usefulness of such systems was illustrated
by a prototype tool that proposes a partial analysis of
the global situation by integrating the issues and
actors perspectives. This tool is a first step towards
the conception and development of an integrated
system which assists the extensive analysis of the
environment from the three mentioned perspectives.
Finally, we also envision to devise a modified
scenario planning methodology which would take
advantage of the results of this environmental
analysis to possible to develop more grounded and
coherent future scenarios (Godet 2001).
Figure 5: Proximity map
Figure 3: Issue analysis graph
Mobile Network
Operators
Wireline
ISP
Venues
Communities
Telephony
Informatics
Regulator
Mobility
Device
Issues
Wide Area
WLAN
networks
Free
Networks
(currently
highlighted)
Loose
Regulation
Figure 4: Power repartition graph
ICEIS 2004 - ARTIFICIAL INTELLIGENCE AND DECISION SUPPORT SYSTEMS
128

ACKNOWLEDGEMENTS
The work presented in this paper was supported by
the National Competence Center in Research on
Mobile Information and Communication Systems
(NCCR-MICS), a center supported by the Swiss
National Science Foundation under grant number
5005-67322.
REFERENCES
Aguilar, F. J. (1967). Scanning the business environment.
Macmillan.
Allas, T. and N. Georgiades (2001). New tools for
negociators. McKinsey Quarterly. 2: 86-97.
Andrews, K. R. (1987). The concept of corporate strategy.
Dow Jones-Irwin.
Ansoff, H. I. (1980). "Strategic Issue Management."
Strategic Management Journal 1(2): 131-148.
Arcade, J., M. Godet, et al. (1999). Structural analysis
with the MICMAC method & Actor's strategy with
MACTOR method. CNAM: 70.
Bendahan, S., G. Camponovo, et al. (2003). "Multi-issue
actor analysis: tools and models for assessing
technology environments." To be published in Journal
of Decision Systems 12(4).
Boulding, K. E. (1956). "General Systems Theory - The
Skeleton of Science." Management Science 2(3): 197-
208.
Bourgeois, L. J. I. (1980). "Strategy and Environment: A
Conceptual Integration." Academy of Management
Review 5(1): 25-39.
Boyd, B. K. and J. Fulk (1996). "Executive Scanning and
Perceived Uncertainty: A Multidimensional Model."
Journal of Management 22(1): 1-21.
Bueno de Mesquita, B. and F. N. Stokman (1994).
European Community decision making models,
applications and comparisons. Yale University Press.
Camponovo, G. and Y. Pigneur (2003). Business Model
Analysis Applied to Mobile Business. ICEIS 2003.
Choo, C. W. (1994). "Perception and Use of Information
Sources in Environmental Scanning." Library &
Information Science Research 16(1): 23-40.
Choo, C. W. (1999). "The Art of Scanning the
Environment." Bulletin of the american society for
information science 25(3).
Choo, C. W. (2001). "Environmental scanning as
information seeking and organizational learning."
Information Research 7(1).
Christensen, C. M. and J. L. Bower (1996). "Customer
Power, Strategic Investment and the Failure of
Leading Firms." Strategic Management Journal 17:
197-216.
Daft, R. L., J. Sormunen, et al. (1988). "Chief Executive
Scanning, Environmental Characteristics and
Company Performance: An Empirical Study."
Strategic Management Journal 9(2): 123-139.
Dill, W. R. (1958). "Environment as an Influence on
Managerial Autonomy." Administrative Science
Quarterly 2(4): 409-443.
El Sawy, O. A. (1985). "Personal Information Systems for
Strategic Scanning in Turbulent Environments: Can
the CEO Go On-Line?" MIS Quarterly 9(1): 53-60.
Godet, M. (2001). Manuel de prospective stratégique.
Dunod.
Katz, D. and R. L. Kahn (1966). The social psychology of
organizations. Wiley.
Kotler, P. (2003). Marketing management. Prentice Hall.
Learned, E. p., C. R. Christensen, et al. (1965). Business
policy: text and cases. R. D. Irwin.
Martino, J. P. (2003). "A review of selected recent
advances in technological forecasting." Technological
Forecasting and Social Change 70(8): 719-733.
McQuarrie, E. F. (1996). The Market Research Toolbox:
A Concise Guide for Beginners, SAGE Publications.
Monzani, J. S., S. Bendahan, et al. (2004). Decision and
Visualization for Negotiation. HICSS, Hawaii.
Osterwalder, A. and Y. Pigneur (2002). An e-business
model ontology for modelling e-business. 15th Bled
Electronic Commerce Conference, Bled.
Pedersen, P. E. and R. Ling (2002). Mobile end-user
service adoption studies: A selective review. Working
Paper, Agder University College and Telenor R&D.
Pedersen, P. E. and R. Ling (2003). Modifying adoption
research for mobile Internet service adoption: Cross-
disciplinary interactions. HICSS, Hawaii.
Porter, M. E. (1980). Competitive strategy : techniques for
analyzing industries and competitors. The Free Press.
Porter, M. E. and V. E. Millar (1985). "How information
gives you competitive advantage." Harvard Business
Review 64(4): 149-160.
Rafii, F. and P. J. Kampas (2002). "How to identify your
enemies before they destroy you." Harvard Business
Review 80(11): 115-+.
Rugman, A. M. and A. Verbeke (2000). "Six cases of
corporate strategic responses to environmental
regulation." European Management Journal 18(4):
377-385.
Smith, W. (1956). "Product Differentiation and Market
Segmentation as Alternative Marketing Strategies."
Journal of Marketing 21: 3-8.
Stabell, C. and D. Fjeldstad (1998). "Configuring value for
competitive advantage: on chains, shops, and
networks." Strategic Management Journal (19): 413-
437.
Subramanian, R., N. Fernandes, et al. (1993).
"Environmental scanning in U.S. companies: their
nature and their relationship to performance."
Management International Review 33(3).
STRATEGIC ANALYSIS OF THE ENVIRONMENT: A DSS FOR ASSESSING TECHNOLOGY ENVIRONMENTS
129
