
APPLYING DATA MINING TO SOFTWARE DEVELOPMENT
PROJECTS: A CASE STUDY
Jacinto Mata, Jos
´
e Luis
´
Alvarez
Dpto. Ingenier
´
ıa Electr
´
onica, Sistemas Inform
´
aticos y Autom
´
atica
Universidad de Huelva, Spain
Jos
´
e Crist
´
obal Riquelme, Isabel Ramos
Dpto. Lenguaje y Sistemas Inform
´
aticos
Universidad de Sevilla, Spain
Keywords:
Software Development Project, Knowledge Discovery in Databases, Association Rules.
Abstract:
One of the main challenges that the project managers have during the building process of a software develop-
ment project (SDP) is to optimise the values of the parameters that measure the viability of the final process.
The accomplishment of this task, something that was not easy at the beginning, was helped with the appearance
of dynamic models and simulation environments. The application of data mining techniques to the managing
of Software Development Projects (SDP) is not an uncommon phenomenon, as in any other productive process
that generates information in the way of input data and output variables. In this paper, we present and analyze
the results obtained from a tool, developed by the authors, based on a Knowledge Discovery in Databases
(KDD) technique. One of the most important contributions of these techniques to the software engineering
field is the possibility of improving the management process of an SDP. The purpose is to provide accurate
decision rules in order to help the project manager to take decisions during the development.
1 INTRODUCTION
Since the development of software projects began on
a great scale, one of the main concerns for the man-
agers has been to optimize the attributes that measure
the viability of the final process. At the beginning,
such task was not easy to realize, since the manager
himself was who, basing on his own experience, es-
timated the values where the attributes (management
policies) that affect the development process had to
move. The main problem was the amount of attributes
that had to be estimated, since a wrong estimation in
some of them could provoke that the final result did
not fulfil the expectations.
A quite significant advance in the management of
Software Development Projects (SDP) was achieved
thanks to the appearance of dynamic models (Abdel-
Hamid and Madnick, 1991), since they model the pro-
cess carried out in the management of such projects.
So, by means of the simulation, the manager can ad-
justs the attributes or input parameters in order that
the output variables, delivery time, cost and quality,
take those values that are considered as optimum for
the process and final product.
The application of data mining techniques to the
software engineering field is not very much spread.
Nevertheless, these techniques offer great advantages
to managers of SDP. One of the most important con-
tributions of these techniques to the software engi-
neering field is the possibility of improving the man-
agement of the SDP process. The aim of data mining
techniques is to provide the SDP manager knowledge
to estimate which are the most suitable values of the
attributes that influence in the project to optimize the
values that estimate the viability of the project.
In this paper we try to contribute to the software
engineering field applying a data mining technique
to a set of software development project databases
generated by a project simulator based in a dynamic
model. We have used the algorithm GAR (Genetic
Association Rule) to carry out our work because of
its efficiency to discover association rules (Agrawal
et al., 1993) in databases with attributes both discrete
and continuous. Our final goal is to provide the expert
with the knowledge induced from our databases, in
this case in the way of association rules, which show
the different associations that are produced among
the input values in order that the output variables can
be considered as goods. For example, we can obtain
rules like:
54
Mata J., Luis Álvarez J., Cristóbal Riquelme J. and Ramos I. (2004).
APPLYING DATA MINING TO SOFTWARE DEVELOPMENT PROJECTS: A CASE STUDY.
In Proceedings of the Sixth International Conference on Enterprise Information Systems, pages 54-60
DOI: 10.5220/0002628200540060
Copyright
c
SciTePress

if ASIMDY
1
∈ [5,8] and HIREDY
2
∈ [7,8] then SCHCDT
3
∈ [349,384] and ANERPT
4
∈ [0.23,0.35]
(support = 65%, confidence = 100%)
This rule shows that 65% of the projects that have
been developed and have obtained a result consid-
ered by the expert as good for time and quality, have
moved within values, as the ones shows in the rule
for the attributes ASIMDY and HIREDY. In this case,
the expert will be able to take into account this in-
formation to decide among which values must he to
estimate the attributes ASIMDY and HIREDY so that
the project can be considered as good.
The remainder of the paper is organized as follows:
In Section 2, we present a brief description about the
software engineering and dynamic systems and, in
Section 3, we present how data mining techniques can
be applied in software development projects. In Sec-
tion 4 we explain which are the adaptations we have
to do in order that the tool behave according to the
expectations of the experts. We present the results of
our experiments in Section 5. Finally, we offer con-
cluding remarks in Section 7.
2 SOFTWARE ENGINEERING
AND DYNAMIC SYSTEMS
As mentioned earlier, the use of dynamic models
for SDP together with strong simulation environment
(Stella, Vensim, iThink, PowerSim, etc.), has been of
great help for the management of SDP (Chichakly,
1993).
A software project simulator allows to realise the
following analysis: an a priori analysis of the project,
project monitoring and post-mortem analysis. There
is an important problem when using these simulators.
In the software development process there are many
parameters that affect the final result. In this way, the
project manager must carry out numerous simulations
and test with different values of the parameters that
affect the process. The use of data mining reduces in
part this problem and provides an alternative to help
the SDP managers in the decision-taking in order to
carry out a project with success.
1
Average assimilation (of new personnel) delay (days)
2
Hiring (of new personnel) delay (days)
3
Delivery time (days)
4
Quality (average number of errors per task)
3 DATA MINING APPLICATION
IN SDP
Dynamic models for SDP include a set of attributes
that allow us to define the management policies that
can be applied in such projects, both those related
with the project environment and those related with
the development organization and the maturity level
of the organization.
Once the attributes of the model are defined, the
project manager must decide which are the variables
that are going to be analyzed. The usual options are
the variables that define the project development: de-
livery time, cost, number of mistakes generated, num-
ber of mistakes corrected, average development pro-
ductivity, etc. So, the management policies that the
mining process can find will be those that relate at-
tribute values with the variables over whose influence
we want to establish rules. Data mining bases its
functioning on the withdrawing of information from
databases. So, a database with information about al-
ready realized SDP would be necessary to carry out
the mining process. The main problem is the non-
existence of these databases, so we will have to gen-
erate a database of projects realized with different val-
ues in the influential parameters by means of the sim-
ulators.
To generate a set of training cases for the mining
process, the project manager must choose a range of
values for the attributes of the model over which there
is some uncertainty level. For example, the project
manager does not know initially, if the average dedi-
cation of the technicians will be of 72% or 50%, but
he is sure that the value will be between 50% and
80%. Next, the simulation tool randomly generates
for every attribute, a value in each one of those in-
tervals. Then, to each tuple of attributes so defined
will correspond a tuple of values for the variables re-
sulting from the simulation. In this way, we generate
a record for the database with the values of the at-
tributes and the values obtained for the variables of
the project that we want to analyze, that is to say, a
specific scenario of the project. By repeating this pro-
cess a certain number of times we can obtain a train-
ing file that serves as base for the mining process.
4 APPLICATION OF GAR TO SDP
DATABASES
Before showing the results obtained by GAR, we will
explain which are the adaptations we have to do in
order that the tool should function according to the
expectations of the experts. GAR searches for all the
association rules that are in the database without tak-
ing into account the attributes that constitute the an-
APPLYING DATA MINING TO SOFTWARE DEVELOPMENT PROJECTS: A CASE STUDY
55

Table 1: Attributes used to generate the PDS database
Abbreviation Description Unit Initial value
Inputs
ADMPPS Average daily manpower per staff % 0.5
ASIMDY Average assimilation (of new personnel) delay days 20
DEVPRT Effort assumed needed for development % 0.85
HIREDY Hiring (of new personnel) delay days 30
INUDST Initial understaffing factor % 0.4
MXSCDX Maximum schedule completion date extension % 1.16
TRNSDY Time delay to transfer people out days 10
TRPNHR Number of trainers per new employee % 0.25
UNDEST Tasks underestimation fraction % 0.35
Outputs
JBSZMD Necessary effort to carry out the project technicians-days 1111
SCHCDT Delivery time days 320
ANERPT average number of errors per task errors/task 0
tecedent and the consequent. However, the project
manager is who, in this case, decides which are the
variables he wants to analyze. This means that such
variables are the only ones that can appear in the con-
sequent of the rules, while the rest of the attributes
that the manager has chosen as input attributes will
appear in the antecedent. What we have done, is to
adjust the tool so it can only search for rules that have
in the consequent the output variables.
The desire of the project managers is to find asso-
ciations among the input parameters when the output
variables are considered as good (low cost, accept-
able delivery time, etc.). Nevertheless, a discrete class
that shows when a project can be considered as good,
bad or of other categories is not defined in the train-
ing file but a tuple of continuous values. Thus, the
project manager must decide the intervals of the out-
put variables values that make a project to be good. In
this way, the manager defines the maximum percent-
ages that can reach the value of a variable initially
estimated in order to decide which are the values that
make a scenario to be good or correct.
For example, supposing that the initial value es-
timated for the attribute SCHCDT (delivery time)
is 320 days. If the manager decides that a project
can be considered as good if does not overcome a
10% of the estimated initial value, the value of the
variable SCHCDT must always been less than 352
days. In the same way, if the initial value esti-
mated for the attribute JBSZMD (necessary effort) is
1111 technicians-day and the maximum percentage
allowed is 20%, the projects considered as good must
not overcome 1333 technicians-day.
These maximum percentages has the name of cuts,
since they are the limits allowed by the manager to
consider that the scenario has been correct. So, and in
order to make easy the search process, we have also
adjust the tool to show only the associations rules with
the values of the consequent moving within the ranges
considered as good.
Departing from these accounts, GAR tool gives the
project manager a set of association rules with a cer-
tain level of support and confidence that relates value
intervals of the input parameters to value intervals of
the output variables when these move within a certain
range.
5 ASSOCIATION RULES
OBTAINED BY GAR
In this section we describe the databases generated
by the simulator and the goals we pretend to achieve.
Next, we show the rules obtained by the tool in two
databases using different management policies.
Once we have obtained the association rules (man-
agement rules), the project manager will be who de-
cide which rule or rules are the easiest to be applied
depending on the specific project and the software or-
ganization he is working on. He will also be who,
before beginning the development and once the at-
tributes that appear in the obtained management rules
are analyzed, decide which attributes can be moved
to keep them within the values that appear in the rules
and which not, in order to optimize the results of the
variables or set of variables of his concern. In any
case, he will also know that if he does not keep within
the obtained values he will not have guaranteed the
optimization of the results.
In this study we have focused on determining over
the variables of an already finished project, the in-
fluence that the management policies of hiring, ad-
equacy and personnel dismissal have, when there is
also initial restrictions on delivery time. That is to
say, we want to analyze the influence that the per-
sonnel management policies have on a project with
strong initial restrictions on delivery time, on the out-
ICEIS 2004 - ARTIFICIAL INTELLIGENCE AND DECISION SUPPORT SYSTEMS
56

Table 2: Intervals estimated for the attributes
Parameter CRCCRT GENERAL
ADMPPS - [0.5, 1.0]
ASIMDY [5, 15] [10, 120]
DEVPRT - [0.5, 0.95]
HIREDY [5, 10] [5, 40]
INUDST - [0.2, 1.0]
MXSCDX [1, 1.2] -
TRNSDY [5, 10] -
TRPNHR - [0.05, 0.4]
UNDEST - [0.05, 0.6]
put variables: necessary effort to carry out a project
(technicians-day), development time (days) and qual-
ity (average number of mistakes by task). Specifi-
cally, the attributes whose values we want to know
are: average delay in hiring, average delay in the
adaptation of new technicians, average delay to carry
out a dismissal and the maximum percentage of delay
allowed in delivery time.
5.1 Description of the Databases
To carry out a study with GAR, we have simulated
an already finished project, whose initial values are
in table 1, following two strategies and, therefore, we
have generated two databases. The first one, which
we will call CRCCRT, has been generated establish-
ing a fast hiring policy with initial restrictions on de-
livery time
5
.
The second one, which we will call GENERAL,
has been generated with a less restrictive policy, in
such a way that we have included in the simulation a
greater number of attributes to be estimated and we
have expanded the ranges of the values that indicate
that a project is good for the output variables.
In table 1, we show the input attributes and the out-
put variables used in the simulation together with a
brief description, the unit in which they are measured
and the initial value. In table 2, we show the intervals
used for each one of the attributes with some level
of uncertainty, for both databases. As can be seen,
in GENERAL the intervals for attributes ASIMDY
and HIREDY form all the possible range in the de-
velopment organization. This is so, since with GEN-
ERAL database we pretend to analyze the influence
that a greater number of attributes have on the project.
In table 3 we show the cut values, that is, the val-
ues considered as good for both databases, CRCCRT
and GENERAL, by the project manager. We have
defined a cut for CRCCRT and two cuts or percent-
5
Fast hiring implies that hiring (HIREDY), dismissal
(TRNSDY) and adaptation of new technicians (ASIMDY)
have to be realized quickly (MXSCDX), that is to say, in a
short period of time (see table 2)
ages for GENERAL, which generate certain values
for the output variables. These cuts are only applied to
some of the output variables (except for cut 1 in GEN-
ERAL, which is applied to the three variables). Each
one of these cuts establishes different correct scenar-
ios. These cut values indicate the goals we pretend
to cover. For example, the cut in CRCCRT has as
goal to obtain management rules that should permit
to maintain the delivery time and the quality of the
project below the indicated values, independently of
the value obtained by the effort necessary to carry out
the project.
Together with the cut value, we show the maximum
percentage, departing from the initial value estimated
by the manager of the project, that must not over-
come that variable in order to realise a project that
adjusts to the initial estimations. For example, in the
cut of CRCCRT we consider good values for deliv-
ery time those included between the initial estimation
(320 days) and a permitted margin of 10% over such
estimation (352 days), independently of the value ob-
tained for the cost of the project. In this same table,
we also offer information about the number of cases
that have been categorised as acceptable. As can be
seen, and as could be supposed from the very begin-
ning, the number of cases decreases as the restrictions
on the project increase. We can deduce, that too many
restrictions could cause a low probability of carrying
out an acceptable development project or even, that
the probabilities were non-existent. For example, the
fact of imposing a restriction on effort (JBSZMD) for
the database CRCCRT, would provoke that the num-
ber of cases were practically nothing.
5.2 Analysis of CRCCRT
The database CRCCRT has been generated by impos-
ing, in the simulation, restrictions on the attributes re-
lated to personnel hiring, making it to be fast, and,
besides, by imposing strong initial restrictions on de-
livery time.
With the strategy followed in the generation of this
database, we pretend to know the value of the at-
tributes related to personnel management that permit
to obtain good results for delivery time and to main-
tain acceptable levels in the project quality, indepen-
dently of the value obtained for the necessary effort to
carry out the project.
5.2.1 Time and Quality
This cut induces a set of rules on the input attributes
for this database, only fulfilling restrictions on deliv-
ery time (SCHCDT) and quality (ANERPT), accord-
ing to the cuts established in table 3.
The association rules discovered, where the con-
sequent is formed by the intervals of the variables
APPLYING DATA MINING TO SOFTWARE DEVELOPMENT PROJECTS: A CASE STUDY
57
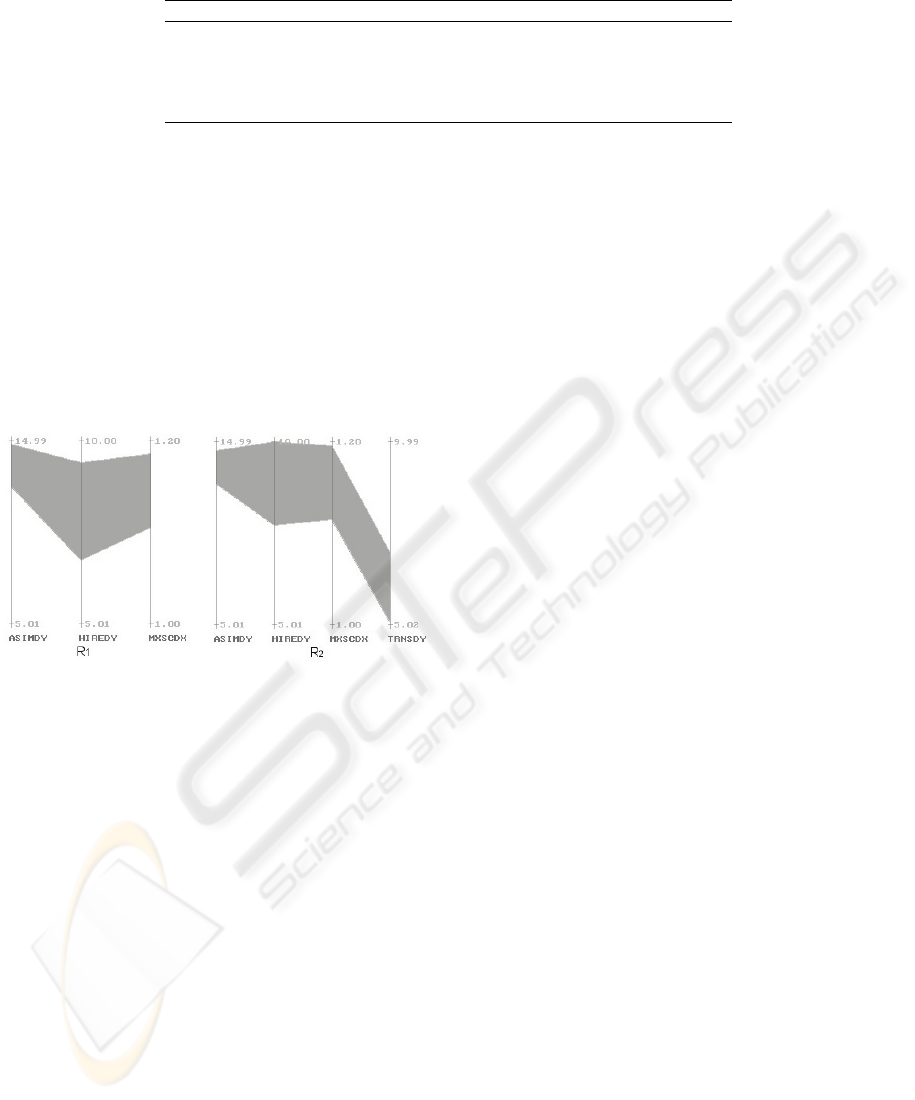
Table 3: Values and percentages of the output variables considered as good by the project manager
Cuts JBSZMD SCHCDT ANERPT #cases
CRCCRT
Cut - ≤ 352 (10%) ≤ 0.45 (12.5%) 45
GENERAL
Cut 1 ≤ 2092 (90%) ≤ 387 (20%) ≤ 0.40 (0%) 48
Cut 2 ≤ 2092 (90%) ≤ 387 (20%) - 221
SCHDT [320,352] and ANERPT [0,0.45], that is to
say, the management rules that would have permit-
ted to obtain good results simultaneously for delivery
time and project quality, are the following ones:
• R
1
: ASIMDY ∈ [12.4,14.6] and HIREDY ∈ [6.7,9.3]
and MXSCDX ∈ [1.10,1.18]
(sup=7%, conf=91.3%, #cases=21)
• R
2
: ASIMDY ∈ [12.5,14.4] and HIREDY ∈ [7.6,9.9]
and MXSCDX ∈ [1.11,1.19] and TRNSDY ∈ [5,7]
(sup=3%, conf=100%, #cases=10)
Figure 1: Rules obtained by GAR in CRCCRT.
The quantitative interpretation we can withdraw
from the rules discovered by GAR is the following:
the support indicates the number of cases (percent-
age) where the conjunction of values of the rules is
produced. The confidence shows the percentage of
cases that fulfil such conjunction and besides, fulfil
the values of the consequent. Together with this in-
formation, we show the number of cases that fulfil the
rule in a correct way (#covered cases) and the num-
ber of cases that also belong to other rules (#rc). This
interpretation will be applicable to the rest of the ex-
amples that are shown next.
In this particular case, rule R
1
shows that 7% of the
cases (21) fulfil the conjunction of values ASIMDY
∈ [12.4,14.6], HIREDY ∈ [6.7,9.3] and MXSCDX ∈
[1.10,1.18] with the correct consequent, that is to say,
with the values of the variables within the range es-
tablished by the manager. The confidence value of
91.3% shows that in the database there are 23 cases
that fulfil the antecedent, but that 2 of them do not
fulfil the consequent. Rule R
2
shows that 3% of the
cases (10) fulfil the antecedent and the consequent.
Besides, a 100% of confidence for this rule, means
that all the cases (10) that fulfil the antecedent, also
fulfil the consequent. We also want to show that 7
of the cases covered by this rule are also covered by
other rules (#rc=7).
In figure 1 we show the graphic representation of
these rules. We can check that the average delay in
the incorporation of new technicians to the project and
their adequacy are attributes that appear in all the ob-
tained rules. In all of them, such attributes take val-
ues from medium to high within the interval defined
as fast personnel management. Facing the results ob-
tained, R
1
would have been the easiest to be applied
since we would have only to modify the values of
ASIMDY and HIREDY.
5.3 Analysis of GENERAL
The database GENERAL has been generated with a
less restrictive policy than the previous one, in such
a way that we have expanded both the number of at-
tributes to estimate and the cut percentage that estab-
lishes when the development of a project is good.
Given that the real values of this project for time
and effort were of 387 days and 2092 technicians-day
respectively, what we are searching for in this anal-
ysis, are the management rules that would have im-
proved the final values of this project, keeping, at the
same time, the quality within acceptable levels, as it is
shown in table 3. We can check again, the same than
in the previous section, that if we limit the goals, that
is to say, if we only want to obtain, in a global way,
good results for time and effort, independently of the
values obtained for the project quality, the number of
suitable scenarios considerably increases (goes from
48 to 221).
5.3.1 Cut 1: Time, Effort and Quality
The first cut for this database is the only one that
establishes restrictions on the three output variables.
Therefore, the rules that are induced on the attributes
must fulfil the three restrictions simultaneously, ac-
cording to the cuts shown in table 3.
The association rules discovered, where the conse-
quent is formed by the intervals of the variables JB-
SZMD ∈ [1111,2092] and SCHCDT ∈ [320,387] and
ICEIS 2004 - ARTIFICIAL INTELLIGENCE AND DECISION SUPPORT SYSTEMS
58
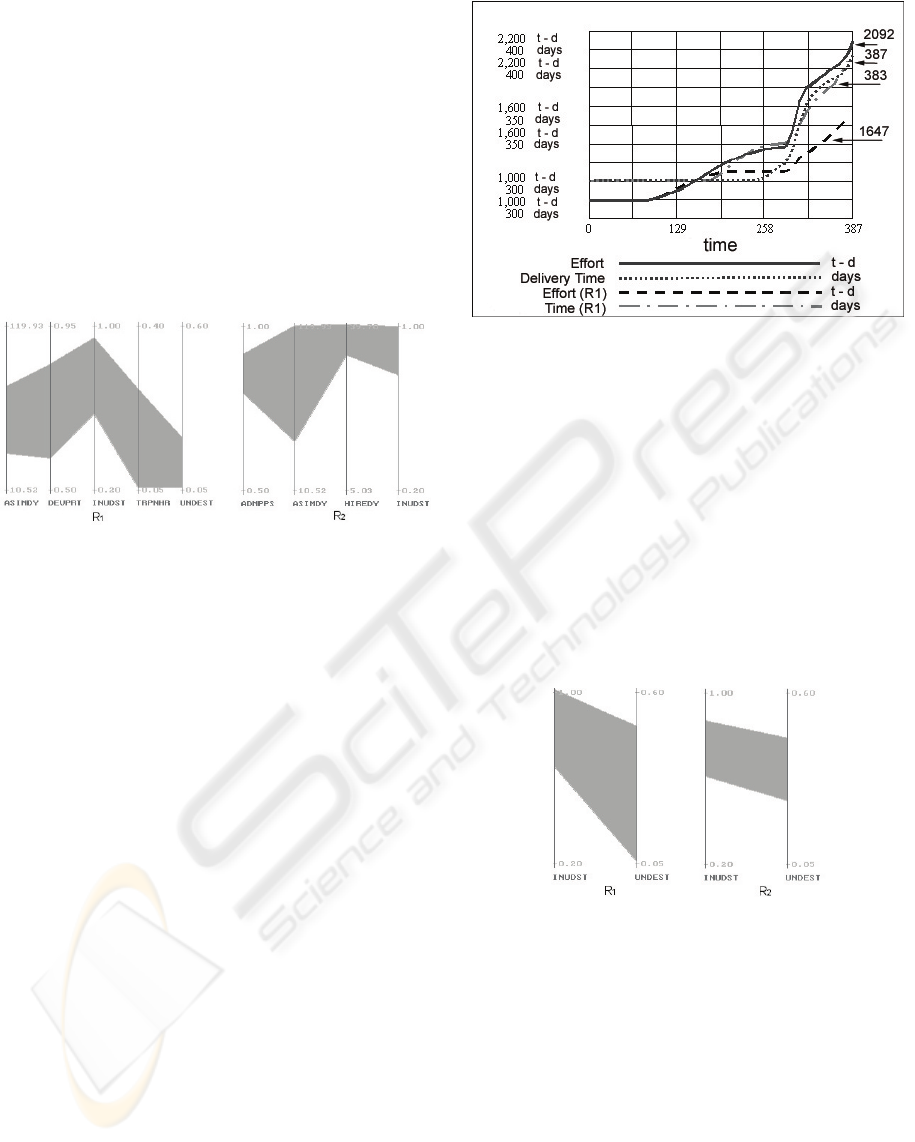
ANERPT ∈ [0,0.40], that is, the management rules
that would have permitted to obtain, simultaneously,
good results for delivery time, effort and project qual-
ity, are the following ones:
• R
1
: ASIMDY ∈ [33.2,78.3] and DEVPRT ∈
[0.58,0.84] and INUDST ∈ [0.57,0.93] and
TRPNHR ∈ [0.05,0.26] and UNDEST ∈ [0.05,0.22]
(sup=2.2%, conf=84.62%, #cases=11)
• R
2
: ADMPPS ∈ [0.79,0.91] and ASIMDY ∈
[41.6,119.2] and HIREDY ∈ [33.1,39.6] and IN-
UDST ∈ [0.75,0.99]
(sup=2.2%, conf=84.62%, #cases=11)
Figure 2: Rules obtained by GAR in GENERAL with cut 1.
Figure 2 shows the graphic representation of the
discovered rules. In this case, R
1
is the chosen rule
for being realizing a post mortem analysis of the
project. This rule, although involves 5 attributes (one
more than rule R
2
), is the one that is closer to the
estimations realized for this project. That is to say,
we would have improved the obtained results if we
had improved the initial estimations on the size of the
project (UNDEST), if we had increased the average
delay of adequacy of the new technicians (ASIMDY)
and if we had increased the number of technicians
at the beginning of the project (INUDST). Rule R
2
would imply the modification of the four attributes
since, the estimated values for each one of them are
not in the range of the values indicated in the rule.
In figure 3 we compare the project nominal evo-
lution with the evolution we would have obtained
if we had applied the rule R
1
. The value obtained
for delivery time was 383, while for effort was 1647
technicians-day.
5.3.2 Cut 2: Time and Effort
As the goals of the project are less ambitious, we can
check in this case that a larger number of possible sce-
narios have been found and that the attributes that we
have to control in order to fulfil the goals of the project
are smaller.
The association rules discovered, where the con-
sequent is formed by the intervals of the variables
Figure 3: Comparison between the nominal simulation with
the one of the project for R1.
JBSZMD ∈ [1111,2092] and SCHCDT ∈ [320,387],
that is, the management rules that would have permit-
ted to obtain, simultaneously, good results for deliv-
ery time, and effort, are the following ones:
• R
1
: INUDST ∈ [0.64,0.99] and UNDEST ∈
[0.05,0.48]
(sup=32%, conf=93.02%, #covered=160)
• R
2
: INUDST ∈ [0.59,0.86] and UNDEST ∈
[0.25,0.44]
(sup=11%, conf=100%, #covered=54)
Figure 4: Rules obtained by GAR in GENERAL with cut 2.
In figure 4 we show the graphic representation of
the rules discovered by GAR. Following the criteria
proposed by the project manager, to apply these rules,
we only would have to modify an attribute in them,
since, the underestimation of the size of the project is
maintained within the levels initially established and
we would only have to modify the value of the per-
centage of technicians that begin the project. The se-
lection between R
1
and R
2
, will depend exclusively
on the project manager, as we have said before, ac-
cording to his knowledge on the possibility of main-
taining the implied attributes within the intervals pro-
vided by the rules.
APPLYING DATA MINING TO SOFTWARE DEVELOPMENT PROJECTS: A CASE STUDY
59

In all the rules obtained, both in cut 1 and in cut
2, we can notice the importance that the percentage
of technicians that begin the project has with regard
to the whole estimated. In all of them, this attribute
takes high values within the interval. This attribute is
of great importance in the development process, since
the greater its value is, the less the necessity of includ-
ing new technicians to the project once this has begun
will be. This implies a greater stability in the working
team, less time spent in training, etc.
6 CONCLUSIONS
Software project simulators permit to model the com-
plex behaviour of the software development process
and to generate different scenarios for a same project.
One of the most important advantages of these simu-
lators lies in the fact that we can ”test”, without any
cost, the effect that the application or not of different
management policies will have on the project. Al-
though, one of the greatest disadvantages is that we
must estimate a great number of attributes (more than
60 in some of them) to know the project evolution.
This means that the project manager has the difficult
task of estimating not only the most suitable value
for each one of them but, also, the optimum com-
bination of such attributes. This obstacle has been
solved in recent works by means of the use of ma-
chine learning techniques and by databases generated
by a project simulator (Ramos et al., 2001)(Aguilar
et al., 2001). The obtained management rules are go-
ing to permit us to know within which intervals the
attributes about which we really have any uncertainty
can move. Thus, we can decrease the uncertainty we
have about certain management policies when we are
estimating the project and check, in already finished
projects, the accuracy of the realized assessments.
In this paper, we have presented GAR as a machine
learning technique to generate management rules that
help to the decision-taking in the SDP.
Finally, we want to indicate that, the application
of the machine learning techniques to real histori-
cal bases, would permit to obtain management rules
based on the experience of the work carried out to date
by the development organization. So, if this happens,
we can say that the experience acquire by a develop-
ment organization will be useful to the managers to
estimate and manage future projects and will not be
exclusive of only one person.
REFERENCES
Abdel-Hamid, T. and Madnick, S. (1991). Software Project
Dynamics: an integrated approach. Prentice-Hall.
Agrawal, R., Imielinski, T., and Swami, A. (1993). Min-
ing association rules between sets of items in large
databases. In Proceedings of the 1993 ACM SIGMOD
International Conference on Management of Data,
pages 207–216, Washington, D.C.
Aguilar, J., Ramos, I., Riquelme, J., and Toro, M. (2001).
An evolutionary approach to estimating software de-
velopment projects. Information and Software Tech-
nology, 43(14):875–882.
Chichakly, K. (1993). The bifocal vantage point: managing
software projects from a systems thinking perspective.
American Programmer, pages 18–25.
Ramos, I., Aroba, J., and Riquelme, J. (2001). Improve-
ments in the decision making in software projects. In
Third International Conference on Enterprise Infor-
mation Systems ICEIS’2001, pages 431–436, Setbal,
Portugal. Proceedings, Vol. 1, P. Miranda et al (Eds).
ICEIS 2004 - ARTIFICIAL INTELLIGENCE AND DECISION SUPPORT SYSTEMS
60
