
THE SCOPE AND INTENSITY OF DERIVED BENEFITS FROM
E-COMMERCE PENETRATION IN SMES
Louis-A. Lefebvre
(1)
, Elie Elia
(2)
, Élisabeth Lefebvre
(1)
, Onno Omta
(3)
(1)
École Polytechnique de Montréal,
Mathematics and Industrial Engineering, P.O. Box 6079, Centre-Ville Station, Montreal, Quebec, Canada, H3C 3A7
(2)
Université du Québec à Montréal,
ESG, Management and Technology, P.O. Box 8888, succ. Centre-ville, Montreal, Quebec, Canada, H3C 3P8
(3)
Wageningen University,
Faculty of Management & Organization, 6700 EW, Bode 77, Postbus 8130, Netherlands
Keywords: E-commerce, cumulative benefits, organizational learning, SMEs.
Abstract: This paper attempts to (i) to assess the relative importance of benefits related to the gradual unfolding of
business-to-business e-commerce (B-2-B e-commerce) penetration among manufacturing SMEs and (ii) to
demonstrate that the scope and intensity of these benefits increase in the later stages of e-commerce
penetration as organizational learning gradually takes place. Empirical evidence strongly suggests that these
benefits are cumulative and that organizational learning allows SMEs to reap these benefits.
1 INTRODUCTION
Electronic commerce (e-commerce) has raised
considerable interest from public policy makers.
Their efforts were mainly directed to accelerate its
penetration among organizations, especially small-
and-medium-sized enterprises (SMEs) and to create
a dynamic e-business environment (see for instance,
eEurope Action Plan, 2002; OECD 1998 and 2002;
US Department of Commerce, 2002a). But is e-
commerce more than technohype? Are the
expectations from e-commerce penetration
unrealistic in the context of SMEs? This paper
attempts to answer these questions but departs from
previous studies by pursuing the following two
objectives: (i) to assess the relative importance of
benefits related to the gradual unfolding of business-
to-business e-commerce (B-2-B e-commerce)
penetration among manufacturing SMEs and (ii) to
demonstrate that the scope and intensity of these
benefits increase in the later stages of e-commerce
penetration as organizational learning gradually
takes place. Our main goal is therefore to gain a
better understanding on how SMEs capitalize on the
potential of e-commerce.
2 RESEARCH FOCUS
2.1 Measuring E-commerce
Penetration from an Evolutionary
Perspective
B-2-B e-commerce continues to grow at a steady
pace, and its strategic impacts on organizations and
industries are increasing (OECD, 2002; Amit and
Zott, 2001). In this paper, B-2-B e-commerce is
defined broadly as “the use of Internet and related
technologies to support any activity that is necessary
for an organization to function effectively” (Magal
et al., 2001). E-commerce penetration in
organizations has been measured from different
perspectives. Some studies used measures of firms’
55
Lefebvre L., Elia E., Lefebvre É. and Omta O. (2004).
THE SCOPE AND INTENSITY OF DERIVED BENEFITS FROM E-COMMERCE PENETRATION IN SMES.
In Proceedings of the Sixth International Conference on Enterprise Information Systems, pages 55-61
DOI: 10.5220/0002637000550061
Copyright
c
SciTePress

budget allocation for Internet and communication
technologies (ICTs), connectivity and type of ICTs
in use (Dutta and Evrard, 1999; Grandon and
Pearson, 2003; Riquelme, 2002; US Department of
Commerce, 2002b; Van Beveren and Thomson,
2002). Statistical agencies and some governmental
organizations were more interested in measuring
electronic transactions in numbers and dollar
volumes (Industry Canada, 2002; OECD, 2002;
Statistics Canada, 2001). Other studies focused on
business issues related to e-commerce and measured
e-commerce penetration by the type of activities it
supported or the business solutions that were
adopted (Bertchek and Fryges, 2002; Daniel et al.,
2002; Mirchandani and Motwani, 2001, Varian et
al., 2002).
Although the above approaches for measuring e-
commerce penetration may be useful for their
respective research objectives, they are of little help
in highlighting how these organizations are profiting
from using e-commerce. To be able to measure e-
commerce unfolding in organizations and its related
benefits, we need to measure e-commerce
penetration at its locus of impact: business
processes. This approach fits with Kauffman and
Weill’s (1989) view which emphasized the
importance of choosing the technology’s locus of
impact as the primary level of value analysis in IT
research. The process oriented approach yielded
interesting results in research on IT penetration and
its related benefits (Kauffman and Weill, 1989;
Barua et al., 1995; Tallon et al. 2000) and has also
been used in e-commerce research in both industry
case studies (Subramaniam and Shaw, 2002) and
survey studies (Barua et al. 2001; Zhu and Kraemer,
2002; Lefebvre and Lefebvre, 2003). Zhu and
Kraemer (2002) focused on the dynamic capabilities
perspective and translated “net-enabled processes”
into “e-commerce capabilities”: information,
transaction, interaction and supplier integration.
More recently, Lefebvre and Lefebvre (2003) went
one step further and proposed an e-commerce
penetration trajectory model based on sequential
stages of e-commerce penetration. Their approach
draws on the evolutionary perspective (Nelson and
Winter, 1982) of the dynamic capabilities theory and
represents a useful starting point to better explore
the relationship between e-commerce penetration
levels and their derived benefits.
2.2 Manufacturing SMEs and
E-commerce
According to the US department of commerce
(2002b), manufacturing continues to lead other US
sectors in terms of electronic commerce shipments.
Some researchers have even related the productivity
growth in the US manufacturing sector, between
1995 and 2000, to the surge of the Internet and e-
commerce (McAfee, 2002). Manufacturing SMEs
continue to play a major economic role in all
industrialized economies (Stevenson and Lundström,
2001) and are increasingly pressured by big
manufacturers to adopt e-commerce. SMEs’ limited
financial and non-financial resources makes it more
crucial for them to adequately harness value from e-
commerce initiatives and render the trajectory
approach even more adequate.
2.3 E-commerce Benefits
From the literature review, we have divided the
benefits associated to B-2-B e-commerce (see for
instance, Turner, 2000; Hocque, 2003; Turban et al.,
2002) into four main areas which are considered as
crucial in the context of manufacturing SMEs:
(i) costs reductions by lowering transaction costs
and inventory levels or by gaining economies of
scale (through group buying or purchase
consolidation);
(ii) cycle time reductions with lower lead times,
faster product design or speedier ordering of parts
and components;
(iii) quality increases especially with improved
customer relationships; and
(iv) growth in revenues as e-commerce represents,
especially for the smaller firms, a low cost way to
expand markets and to effectively target market
segments.
Benefits associated with B-2-B e-commerce may
be even more compelling as they are derived from
collaboration between business partners but remain
an under-investigated issue (Gebauer and Shaw,
2002; Kendall et al., 2001).
3 METHODOLOGY
3.1 The E-survey
A systematic sample was drawn from an up-to-date
government list of all manufacturing SMEs
operating in one Canadian province which includes
basic information on each firm such as number of
employees, volume of sales, geographic location and
coordinates including the electronic address of the
CEO. SMEs are here defined as firms with less than
500 employees, a definition in accordance with
some governmental agencies such as the US Small
Business Administration. An electronic
ICEIS 2004 - SOFTWARE AGENTS AND INTERNET COMPUTING
56

questionnaire was sent to the Chief Executive
Officer (CEO) of each of the selected firms. The
total number of SMEs participating to the on-line
survey was 230 firms and the response rate reached
7.6% which is quite acceptable for this type of
survey. Non-response bias does not seem to exist
with respect to firm size as no significant differences
(goodness of fit tests) were found but there is a
slight positive bias towards urban areas.
Furthermore, the use of an e-survey may indeed
underestimate the number of non-adopters of e-
commerce. However, this later issue represents a
shortcoming that tends to disappear as smaller firms
have gained in the last few years a generalized
access to the Internet. In the case of Canadian SMEs
that are in a vast majority linked to the Internet, this
shortcoming appears minimal in comparison to the
cost effectiveness, efficiency and conviviality
offered by e-surveys (Couper, 2000; Rogelberg et
al., 2001; Dillman, 2000).
3.2 Research Variables
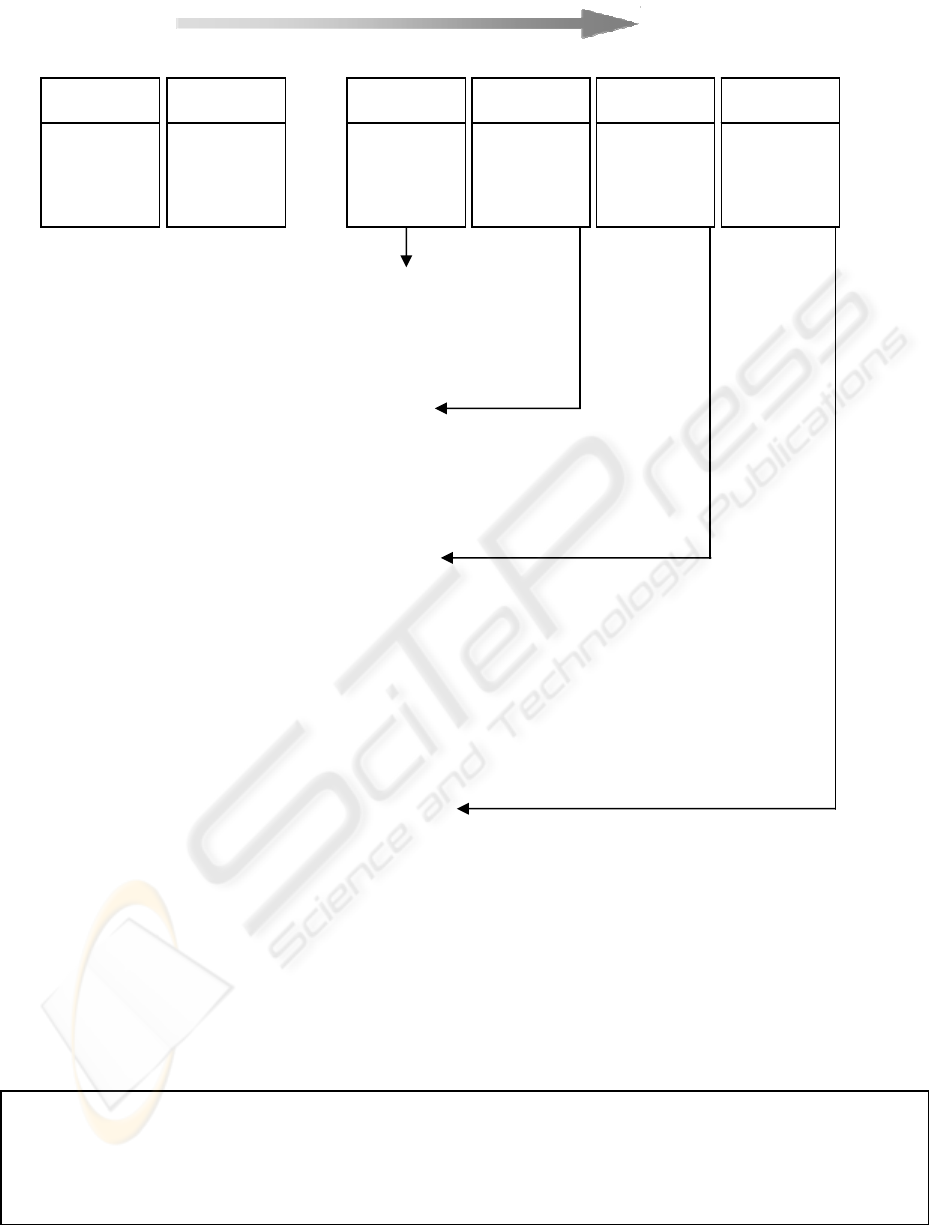
3.2.1 E-commerce Penetration
This article builds on previous work conducted by
Lefebvre and Lefebvre (2003) who proposed a six-
stage model that differentiates the non-adopters from
the adopters (upper part of figure 1). Stage 00 and
stage 0 correspond to non-adopters which are not the
focus of this paper. Stages 1, 2, 3 and 4 represent e-
commerce adopters. Stage 1 is limited to electronic
information search and content creation. Stage 2
represents simple e-transactions while stage 3
includes online transactions of increased complexity
such as conducting electronic auctions and
negotiating contracts online. Stage 4 considers a
wider range of e-commerce capabilities that support
e-collaboration activities with customers and
suppliers.
In order to capture different stages of B-2-B e-
commerce penetration (stages 1, 2, 3 and 4), we
have identified and validated 36 business processes
that could be supported electronically (middle part
of figure 1). These processes were also evaluated
with respect to their relative level of complexity by a
panel of 12 experts. Inter-rater reliability between
members of the panel proved to be excellent for
most business processes (ranging from 0.7 to 1.0)
and satisfactory for the remaining ones (r = 0.6).
The mean level of complexity for all stage 1
processes was 1.504, 2.829 for stage 2 processes,
3.547 for stage 3 processes and 4.698 for stage 4
processes. Thus, supporting the fact that complexity
increases with the stages.
The score of e-commerce penetration in one
particular firm simply represents the sum of business
processes that are carried out using electronic means
(
∑
=
36
1
BP
i
i ). To reflect e-commerce initiatives’
complexity, a weighted score could also be
derived:
∑
=
36
1
BP x c
i
ii (where BP
i
corresponds to the
business processes listed in figure 1 and c
i
= level of
complexity of each business process as rated by the
panel of 12 experts). These scores were thoroughly
validated (Lefebvre and Lefebvre, 2003; Elia et al.,
2004).
3.2.2 Derived Benefits
The benefits associated to e-commerce are all based
on perceptual measures using 7-point Likert scales.
They are derived from the literature review and
reflect the manufacturing environment in which
these firms operate. The exact wording was
validated through on-site interviews with the CEOs
of 15 SMEs
.
4 RESULTS
4.1 Profile of Responding Firms
As can be seen from the data presented in Appendix
1, firms in the different stages do not differ
significantly with respect to size although more
advanced firms tend to be larger. However, firms in
stage 3 and 4 do seem to be significantly
internationalized.
Scores of e-commerce penetration increase with
the stages as does the volume of e-transactions (p =
0.0000). These results further validate the stage
model.
4.2 The Scope and Intensity of
Derived Benefits
In order to evaluate the scope and intensity of
perceived benefits from e-commerce penetration,
CEOs were asked to evaluate on a seven point scale
(7 being the highest) ten potential benefits. Firms
belonging to each of the four stages of e-commerce
penetration were characterized according to the
benefits they derived from the utilization of e-
commerce business processes. It was decided to
retain only those benefits that ranked 3 or higher on
the 7 point-scale for each group of firms.
THE SCOPE AND INTENSITY OF DERIVED BENEFITS FROM E-COMMERCE PENETRATION IN SMEs
57
Business Processes (BP
i
):
Stage 1: Electronic information search & content creation
• Seek out new suppliers
• Seek out products/services
• Advertise the company and/or its products/services
• Seek out new customers
• Convert information on products/services into digital form
Stage 2: Electronic transactions
• Buy products/services using electronic catalogs
• Place and manage orders with suppliers
• Access suppliers’ product/service databases
• Sell products/services using electronic catalogs
• Receive and manage customer orders
• Access customers’ product/service databases
• Offer customers after-sales services
Stage 3: Complex electronic transactions
• Buy products/services by electronic auction
• Buy products/services by issuing electronic calls for tenders
• Negotiate contracts (price, volume, etc.) with suppliers
• Make electronic payments to suppliers
• Sell products/services by electronic auction
• Sell products/services by responding to electronic calls for tenders
• Negotiate contracts (price, volume, etc.) with customers
• Receive electronic payments from customers
• Allow customers to access the company’s inventories
• Access customers’ inventories
• Allow suppliers to access the company’s inventories
• Access suppliers’ inventories
Stage 4: Electronic collaboration
• Transfer documents and technical drawings to customers
• Transfer documents and technical drawings to suppliers
• Integrate software supporting product design (e.g. CAD/CAM, VPDM, PDM)
• Do collaborative on-line engineering with suppliers
• Do collaborative on-line engineering with customers
• Automate the production floor using a manufacturing execution system (MES)
• Integrate the MES into the management information system
• Ensure the management of quality assurance using the management information system
• Automate distribution/logistics using a logistics execution system (LES)
• Allow distribution/transportation partners to access the information they need (SKU, quantity, delivery turnaround, etc.) in order
to reduce time and costs related to distribution
• Optimize returns management (“reverse logistics”)
• Track products (purchased and sold) during transportation
Score of e-commerce penetration
∑
=
=
36
1
BP
i
i
; and weighted score of e-commerce penetration
∑
=
=
36
1
BP x ic
i
i
.
Where BP
i
corresponds to the Business Processes listed above (BP
i
=0 when BP
i
is not conducted in one particular firm
using electronic means and BP
i
=1 when it is) and c
i
= degree of complexity of each Business Process as rated by a panel of 12 experts.
Figure 1: Stage model for e-commerce penetration among manufacturing SMEs
Stage 00
Stage 0 Stage
1 Stage 2 Stage 3 Stage 4
Non-adopters
with no interest
in e-com
Non-adopters
with interest
in e-com
Electronic
information
search & content
creation
Electronic
transactions
Complex
electronic
transactions
Electronic
collaboration
Non adopters Adopters
ICEIS 2004 - SOFTWARE AGENTS AND INTERNET COMPUTING
58
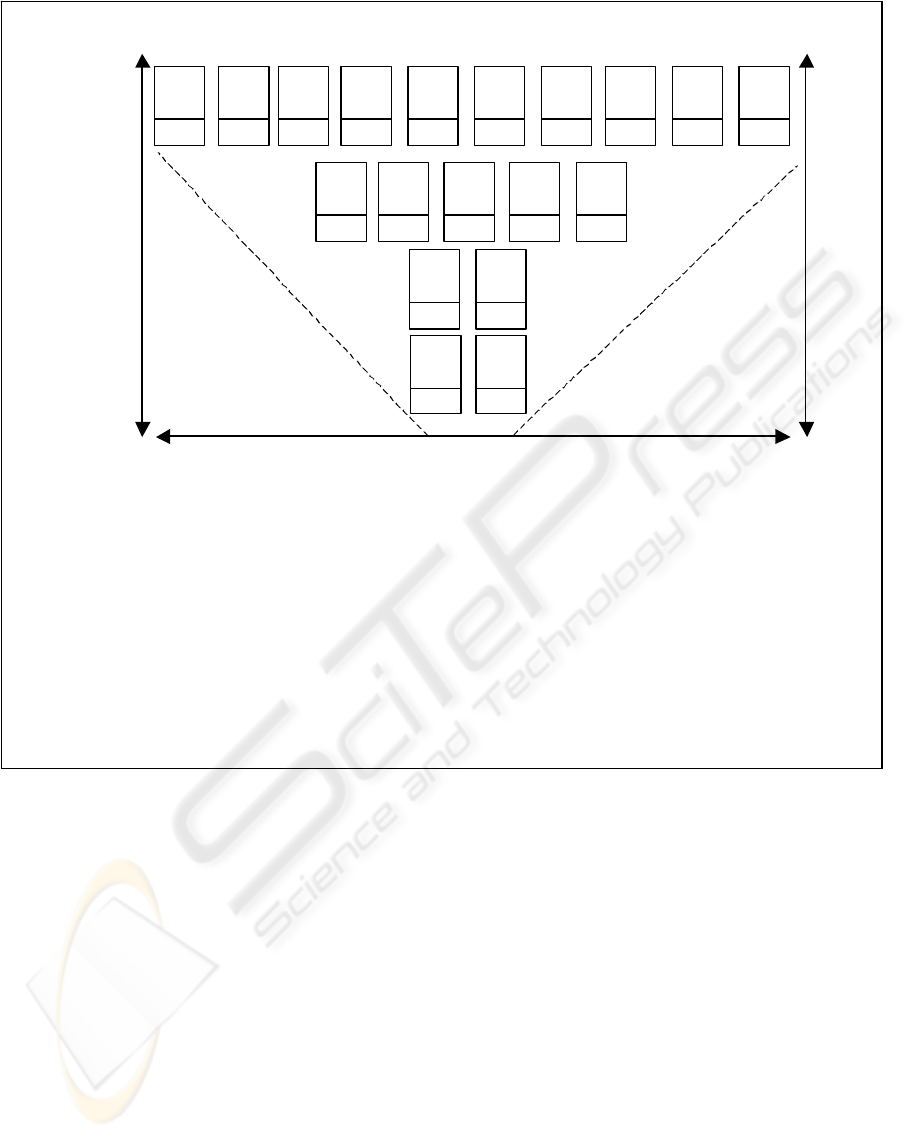
Where:
Q-CS = Increase in customer service quality.
C-M, S, AS = Reduction in marketing, sales and after-sales costs.
T-D = Reduction in delivery time (speed or dependability).
R-MS = Increase in market share.
R = Increase in revenues.
C-P = Reduction in procurement costs.
C-E = Reduction in engineering, product development and design costs.
C-M = Reduction in manufacturing and inventory costs.
T-M = Reduction in product manufacturing cycle time.
C-L = Reduction in logistics and distribution costs.
Intensity of derived benefits is captured by 7 point Likert scales (where 1= very low and 7= very high).
Figure 2: Scope and intensity of derived benefits
The results of this exercise are presented in figure
2. The corresponding analysis is conducted with
respect to both scope (number of concurrent
benefits that ranked 3 or higher) and intensity (the
level of the derived benefits on the 7 point-scale
for any one of the 10 benefits).
With respect to scope, it becomes generally
evident that the number of concurrent benefits
increases with the stages of e-commerce
penetration, although stages 1 and 2 share the same
benefits which are interestingly enough related to
customer service and cost reductions in client
related activities. The fact that the benefits in the
first two stages share a common focus may be
explained by the time lag required to achieve these
benefits and by unrealistic expectations with
respect to time and outcomes on the part of the
SMEs. In stage 3, firms tend to experience an
increase in the scope of benefits with other added
customer oriented activities like delivery time and
with increases in market share and revenues. Only
in stage 4 do firms derive benefits associated with
increases in engineering, manufacturing, and
overall logistics efficiency. This indicates that
these may be the most difficult to obtain and that
they are captured as a result of a rather long
learning process since they affect product related
creation, realization and distribution processes.
In terms of intensity, it is also observable from
appendix 1 that the level of intensity increases for
most of the benefits as SMEs progress in the later
stages of B-2-B e-commerce penetration: this
suggests again a learning process through which
firms evolve. This positive learning trajectory is
important as it stresses the fact that SMEs get
better over time and that the continued use of e-
commerce processes does translate into mounting
benefits with respect to both intensity and scope.
Scope of derived benefits
Stages of
e-
commerce penetration
Stage 4
Electronic
collaboration
Stage 3
Complex
electronic
transactions
Stage 2
Electronic
transactions
Stage 1
Electronic
information
search and
content
creation
T-D
Q-
CS
C-
M
,
S,
AS
R-
MS
R
Q-
CS
C-
M,S,
AS
Q-
CS
C-
M
,
S,
AS
Intensity of derived
benefits
3.37
3.51
3.26
3.91
3.35
3.00
4.17
3.67
3.67
3.45
3.26
3.31
3.78
3.78
3.90
4.68
4.103.97
3.63
C-P
C-E
T-D
Q-
CS
C-
M
,
S,
AS
R-
MS
R
C-M
T-M
C-L
THE SCOPE AND INTENSITY OF DERIVED BENEFITS FROM E-COMMERCE PENETRATION IN SMEs
59

5 CONCLUSION
This paper is an attempt to demonstrate how
benefits associated with e-commerce in SMEs
differ as the level of penetration of e-commerce
processes in firms increases. An e-commerce stage
model was presented with a spectrum ranging from
rather basic e-commerce processes such as
electronic information search (stage 1) to more
complex processes such as collaboration activities
with customers and suppliers (stage 4).
Furthermore, it was shown that the scope
(number of benefits) and intensity (number of
derived benefits) of these benefits also increases as
a firm moves up in the e-commerce stage model
indicating that there exists a learning process
which allows firms to reap increasing benefits over
time. This suggests the existence of an
evolutionary pattern with respect to both realized
e-commerce penetration and derived e-commerce
benefits in SMEs.
ACKNOWLEDGMENTS
The authors would like to thank the two reviewers
for their insightful comments and gratefully
acknowledge supports from FCAR and SSHRC.
REFERENCES
Amit, R. and Zott, C., 2001. Value creation in e-
business. Strategic Management Journal, Vol. 22,
No. 6/7, pp.493-520.
Barua, A., Kriebel, C.H. and Mukhopadhyay, T., 1995.
Information Technologies and Business Value: An
Analytic and Empirical Investigation. Information
Systems Research, Vol. 6, No. 1, pp. 3-21.
Barua, A., Konana, P., Whinston, A.B. and Yin, F.,
2001. Driving E-Business Excellence. MIT Sloan
Management Review, Vol. 43, No. 1, pp. 36-44.
Bertschek, I. and Fryges, H., 2002. The Adoption of
Business-to-Business E-Commerce: Empirical
Evidence for German Companies. Paper 02-05,
Centre for European Economic Research, Mannheim.
Couper, M.P., 2000. Usability Evaluation of Computer-
Assisted Survey Instruments. Social Science
Computer Review, Vol. 18, No. 4, pp. 384-396.
Daniel, E., Wilson, H. and Myers, A., 2002. Adoption of
E-Commerce by SMEs in the UK, Towards a Stage
Model. International Small Business Journal, Vol.
20, No. 3, pp. 253-270.
Dillman, D.A., 2000. Mail and Internet Surveys: The
Tailored Design. New York: John Wiley.
Dutta, S. and Evrard, P., 1999. Information Technology
and Organization within European Small Enterprises.
European Management Journal, Vol. 17, No. 3, pp.
239-251.
Elia, E., Lefebvre, L.A. and Lefebvre, É., 2004.
Typology of B-to-B E-comerce Initiatives and
Related Benefits in Manufacturing SMEs.
Proceedings of the 37th Hawaii International
Conference on Systems Sciences, Hawaii: IEEE.
Forthcoming.
eEurope, 2002. An Information Society for All, Action
Plan 2002 and 2005.
http://www.europa.eu.int/informationsociety/eeurope
/actionplan.
Gebauer, J., and Shaw, M.J., 2002. Introduction to the
Special Section: Business-to-Business Electronic
Commerce”, International Journal of Electronic
Commerce, Vol. 6, No. 4, pp. 7-17.
Grandon, E. E. and Pearson J.M., 2003. Perceived
Strategic Value and Adoption of Electronic
Commerce: An Empirical Study of Small and
Medium Sized Businesses. Proceedings of the 36th
Hawaii International Conference on System Sciences.
Honolulu: IEEE.
Hocque, F., 2000. E-enterprise: Business Models,
Architecture and Components. Cambridge
University Press, Cambridge.
Industry Canada, 2002. Key Indicators on ICT
Infrastructure, Use and Content. Report, Ottawa.
Kauffman, R. J., and Weill, P., 1989. An Evaluative
Framework for Research on the Performance Effects
of Information Technology Investment. Proceedings
of the Tenth International Conference on
Information Systems, Boston.
Kendall, J., Tung, L.L., Chera, K.H., Ng, C.H. and Tan,
S.M., 2001. Electronic Commerce adoption by
SMEs in Singapore. Proceedings of the 34th Hawaii
International Conference on Systems Sciences.
Honolulu: IEEE.
Lefebvre, É., and Lefebvre, L.A., 2003. E-commerce
Adoption Trajectories Among Manufacturing SMEs,
Proceedings of IADIS Conference,Portugal.
Magal, S.R., Feng, M. and Essex, P.A., 2001. An
Exploratory Study of Web-Based Electronic
Commerce Applications. Journal of Information
Technology Theory and Application, Vol. 3, No. 5,
pp. 139-149.
McAfee, A., 2002. The Impact of Enterprise Information
Technology Adoption on Operational Performance:
An Empirical Investigation. Production and
Operations Management
, Vol. 11, No. 1, pp. 33-53.
Mirchandani, A. and Motwani, J., 2001. Understanding
Small Business Electronic Commerce Adoption: An
Empirical Analysis. Journal of Computer
Information Systems, Spring 2001, pp. 70-73.
Nelson, R.R. and Winter, S., 1982. An Evolutionary
Theory of Economic Change. Cambridge, MA:
Harvard Business Press.
OECD, 1998. SMEs and Electronic Commerce. Paris:
Directorate for Science, Technology and Industry.
ICEIS 2004 - SOFTWARE AGENTS AND INTERNET COMPUTING
60

OECD, 2002. Measuring the Information Economy.
Paris: OECD Publications.
Riquelme H., 2002. Commercial Internet Adoption in
China: Comparing the Experience of Small, Medium
and Large Businesses. Internet Research, Vol. 12,
No. 3, pp. 276-286.
Rogelberg, S.G., Fisher, G.G., Maynard, D.C., Hakel
M.D. and Horvath, M., 2001. Attitudes Toward
Surveys: Development of a Measure and its
Relationship to Respondent Behavior.
Organizational Research Methods, Vol. 40, No. 1,
pp. 3-25.
Statistics Canada, 2001. Electronic Commerce and
Technology Use. Ottawa: Connectedness Series.
Stevenson, L. and Lundström, A., 2001. Patterns and
trends in entrepreneurship/SME policy and practice
in ten economies. Swedish Foundation for Small
Business Research, Stockholm.
Subramaniam, C., and Shaw, M.J., 2002. A Study of the
Value and Impact of B2B E-Commerce: The Case of
Web-Based Procurement. International Journal of
Electronic Commerce, Vol. 6, No. 4, pp. 19-40.
Tallon, P. P., Kraemer, L. K. and Gurbaxani, V., 2000.
Journal of Management Information Systems. Vol.
16, No. 4. pp. 145-173.
Turban, E., David King, J.L., Warkentin, J.L. and H.M.,
M., 2002. Chung, Electronic Commerce 2002: A
Managerial Perspective, Prentice-Hall, Upper
Saddle River, New Jersey.
Turner, C., 2000. The Information E-conomy, Kogan
Page, London.
US Department of Commerce, 2002a. Main Street in the
Digital Age: How Small and Medium-Sized
Businesses Are Using the Tools of the New Economy.
Washington DC: Economics and Statistics
Administration.
US Department of Commerce, 2002b. E-Stats 2000.
Washington DC: US Census Bureau.
Van Beveren, J. and Thomson, H., 2002. The Use of
Electronic Commerce by SMEs in Victoria,
Australia. Journal of Small Business Management,
Vol. 40, No. 3, pp. 250-253.
Varian, H., Litan, R.E., Elder A. and Shutter, J., 2002.
The Net Impact Study. Available at:
www.netimpactstudy.com.
Zhu, K. and Kraemer, K.L., 2002. E-Commerce Metrics
for Net-Enhanced Organizations: Assessing the
Value of E-Commerce to Firm Performance in the
Manufacturing Sector. Information Systems
Research, Vol. 13, No. 3, pp. 275-295.
APPENDIX 1
The stage model: SMEs’ characteristics, e-commerce adoption and benefits
Stage 1
(n=8)
Stage 2
(n=17)
Stage 3
(n=47)
Stage 4
(n=50)
p
(4)
SMEs’ characteristics
Size (annual sales in $CAN) 18.13M 23.34M 84.46M 139.19M NS
Level of exports (1) 11.95% 8.78% 17.12% 16.97% **
Level of imports (1) 12.14% 8.12% 20.61% 32.45% ***
E-commerce adoption
Score of e-commerce adoption (2) 1.88 3.88 6.55 10.58 ****’
Weighted score of e-com. Adoption (2) 2.79 8.22 15.66 31.93 ****’
Volume of e-transactions
% of e-sales (3) 0.00% 1.43% 9.29% 12.58% ****
% of e-procurement (3) 0.00% 0.98% 16.59% 21.27% ****
Benefits derived from e-commerce adoption
Increase in customer service quality 3.67 4.17 3.91 4.68 NS
Reduction in marketing, sales & after-sales costs 3.67 3.00 3.26 3.90 NS
Reduction in delivery time (speed/dependability) 2.33 2.58 3.35 4.10 *
Increase in market share 2.83 2.92 3.51 3.78 *
Increase in revenues 2.33 2.58 3.37 3.78 *
Reduction in procurement costs 2.83 2.67 2.91 3.63 NS
Reduction in eng., product develop. & design costs 2.00 2.25 2.24 3.97 ***
Reduction in manufacturing & inventory costs 2.00 2.00 2.15 3.31 **
Reduction in product manufacturing cycle time 2.17 2.42 2.38 3.26 NS
Reduction in logistics & distribution costs 2.50 2.50 2.68 3.45 NS
(1) Level of exports: ratio of sales realized in foreign markets over total sales. Level of imports: ration of purchases from foreign markets
over total purchases. (2) As defined in figure 1. (3) Ratio of e-sales over total sales. Ratio of e-procurement over total procurement. (4) p=
level of significance of the Kruskall Wallis Test (non-parametric ANOVA) * = p<0.10; ** = p<0.05 ; *** = p<0.01 ; **** = p<0.001.
THE SCOPE AND INTENSITY OF DERIVED BENEFITS FROM E-COMMERCE PENETRATION IN SMEs
61
