
TOWARDS HIGH DIMENSIONAL DATA MINING WITH
BOOSTING OF PSVM AND VISUALIZATION TOOLS
Thanh-Nghi Do, François Poulet
ESIEA Recherche, 38 rue des Docteurs Calmette et Guérin, 53000 Laval, France
Ke
ywords: Data mining, Classification, Machine learning, SVM, Incremental learning, Boosting, Visualization.
Abstract: We present a new supervised classification algorithm using boosting with support vector machines (SVM)
and able to deal with very large data sets. Training a SVM usually needs a quadratic programming, so that
the learning task for large data sets requires large memory capacity and a long time. Proximal SVM
proposed by Fung and Mangasarian is another SVM formulation very fast to train because it requires only
the solution of a linear system. We have used the Sherman-Morrison-Woodbury formula to adapt the PSVM
to process data sets with a very large number of attributes. We have extended this idea by applying boosting
to PSVM for mining massive data sets with simultaneously very large number of datapoints and attributes.
We have evaluated its performance on several large data sets. We also propose a new graphical tool for
trying to interpret the results of the new algorithm by displaying the separating frontier between classes of
the data set. This can help the user to deeply understand how the new algorithm can work.
1 INTRODUCTION
In recent years, real-world databases increase rapidly
(double every 9 months). So the need to extract
knowledge from very large databases is increasing.
Knowledge Discovery in Databases (KDD) can be
defined as the non-trivial process of identifying
valid, novel, potentially useful, and ultimately
understandable patterns in data (Fayyad et al., 1996).
Data mining is the particular pattern recognition task
in the KDD process. It uses different algorithms for
classification, regression, clustering or association.
Support Vector Machine (SVM) algorithms
proposed by (Vapnik, 1995) are a well known class
of classification algorithms using the idea of kernel
substitution. SVM solutions are obtained from
quadratic programming problems possessing a
global solution. Therefore, the learning task for large
data sets requires large memory capacity and a long
time. There is a need to scale up SVM algorithms to
handle massive data sets on personal computers. The
proximal SVM proposed by (Fung & Mangasarian,
2001) changes the inequality constraints to equalities
in the optimization problem, thus the training task
requires the solution of a system of linear equations,
so that PSVM is very fast to train. Furthermore,
PSVM can construct incrementally the model
without loading the whole data set in main memory.
The Sherman-Morrison-Woodbury formula (Golub
& van Loan, 1996) is used to adapt PSVM to a row-
incremental or column-incremental version (but not
both). The new boosting of PSVM algorithm we
present in this paper focuses on mining massive data
sets with simultaneously very large number of
datapoints and attributes. Some performances are
evaluated on UCI (Blake & Merz, 1998), Twonorm,
Ringnorm (Breiman, 1996), Reuters-21578 and Ndc
(Musicant, 1998) data sets. The results are compared
with LibSVM (Chang & Lin, 2003). However, for
many data mining applications, understanding the
model obtained by the algorithm is as important as
the accuracy. In this order, we also propose a
graphical tool for trying to explain the result of the
boosting of PSVM by displaying the separating
frontier between classes. This can help the end-user
to deeply understand how, why the algorithm works
so well.
We briefly summarize the content of the paper now.
In section 2, we introduce standard SVM and
proximal SVM algorithms. In section 3, we describe
row-incremental and column-incremental linear
PSVM. In section 4, we apply the boosting approach
to PSVM. In section 5, we present the visualization
tool for trying to explain the results. We demonstrate
numerical test results in section 6 before the
36
Do T. and Poulet F. (2004).
TOWARDS HIGH DIMENSIONAL DATA MINING WITH BOOSTING OF PSVM AND VISUALIZATION TOOLS.
In Proceedings of the Sixth International Conference on Enterprise Information Systems, pages 36-41
DOI: 10.5220/0002639500360041
Copyright
c
SciTePress
conclusion in section 7. Some notations are used in
this paper. All vectors will be column vectors unless
transposed to row vector by a T superscript. The 2-
norm of the vector x will be denoted by ||x||, the
matrix A[mxn]
will be m trained points in the n-
dimensional real space R
n
. The classes +1, -1 of m
trained points are denoted by the diagonal matrix
D[mxm] of +1, -1. e will be the column vector of 1.
w, b will be the coefficients and the scalar of the
hyper plan. z will be the slack variable and
ν
is a
positive constant. I denote the identity matrix.
2 PROXIMAL SVM
We briefly present a general linear classification task
of SVM and then we summarize proximal SVM
algorithm.
2.1 Linear SVM Classification
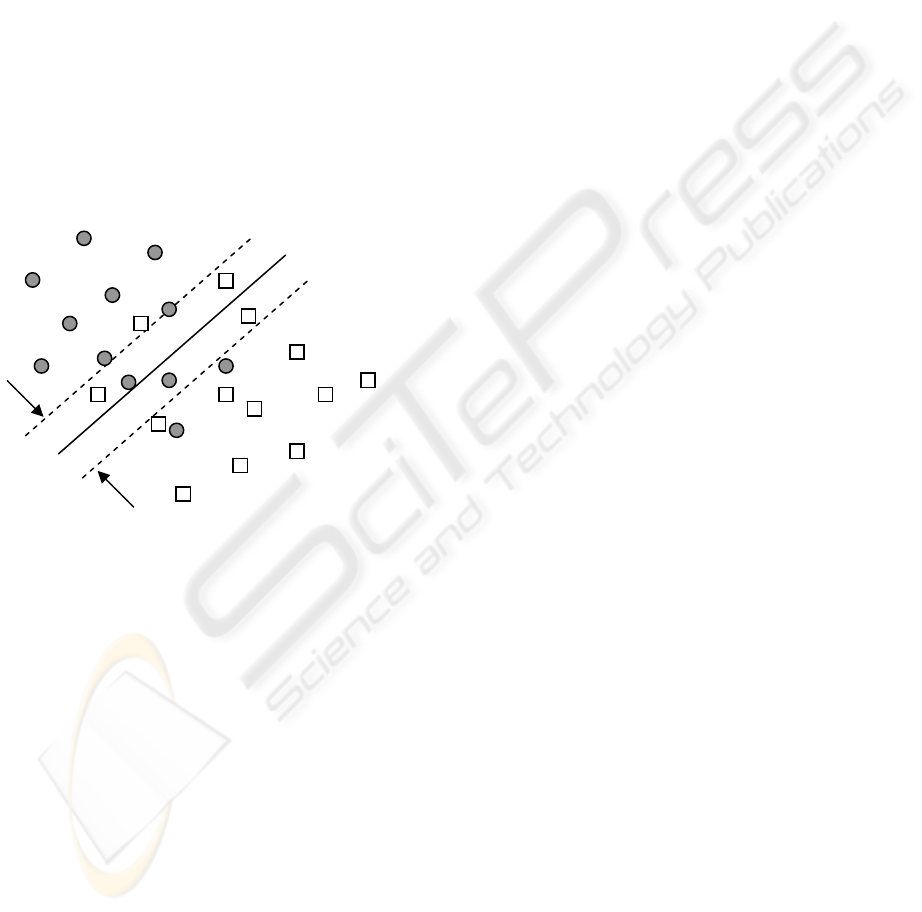
Let us consider a linear binary classification task, as
depicted in figure 1, with m data points in the n-
dimensional input space R
n
, represented by the mxn
matrix A, having corresponding labels ±1, denoted
by the mxm diagonal matrix D of ±1. For this
problem, the SVM try to find the best separating
plane, i.e. furthest from both class +1 and class -1. It
can simply maximize the distance or margin
between the support planes for each class (x
T
.w–
b=+1 for class +1, x
T
.w–b=-1 for class -1). The
margin between these supporting planes is 2/||w||.
Any point falling on the wrong side of its supporting
plane is considered to be an error. Therefore, the
standard SVM algorithm with linear kernel needs to
simultaneously maximize the margin and minimize
the error. This is accomplished through the
following quadratic program (1):
min f(z,w,b) = νe
T
z + (1/2)||w||
2
s.t. D(Aw - eb) + z ≥ e (1)
where the slack variable z ≥ 0 and
ν
is a positive
constant. The plane (w,b) is obtained by the solution
of the quadratic program (1). And then, the
classification function of a new data point x based on
the plane is: f(x) = sign(x.w – b) (2)
SVM can use some other classification functions, to
change from a linear to non-linear classifier, one
must only substitute a kernel evaluation in the
objective function instead of the original one. More
details about SVM and others based-kernel learning
methods can be found in (Cristianini & Shawe-
Taylor, 2000).
2.2 Proximal SVM classifier
The proximal SVM classifier proposed by (Fung &
Mangasarian, 2001) changes the inequality
constraints to equalities in the optimization problem
(1). However, besides adding a least squares 2-norm
error into the objective function f, it changes the
formulation of the margin maximization to the
minimization of (1/2)||w,b||
2
. Thus substituting for z
from the constraint in terms (w,b) into the objective
function f we get an unconstraint problem (3):
min f(w,b)= (ν/2)||e – D(Aw–eb)||
2
+ (1/2)||w,b||
2
(3)
Setting the gradient with respect to (w,b) to zero
gives:
[w
1
w
2
.. w
n
b]
T
= (I/ν + E
T
E)
-1
E
T
De (4)
where E = [A -e]
Therefore, the linear PSVM is very fast to train
because it expresses the training in terms of solving
a set of linear equations of (w,b) instead of quadratic
programming. The accuracy can be compared with
standard SVM. Note that all we need to store in
memory is the (m)x(n+1) training data matrix E, the
(n+1)x(n+1) matrix E
T
E and the (n+1)x1 vector d =
E
T
De. If the dimension of the input space is small
enough (less than 10
4
), even if there are millions
datapoints, PSVM is able to classify them on a
standard personal computer. For example, the linear
PSVM can easily handle large data sets as shown by
A
-
A+
x
T
.w – b = 0
x
T
.w
–
b = +1
x
T
.w
–
b =
-
1
margin = 2/||w||
Figure 1: Linear separation of the datapoints into two
classes
TOWARDS HIGH DIMENSIONAL DATA MINING WITH BOOSTING OF PSVM AND VISUALIZATION TOOLS
37

the classication of 2 million 10-dimensional points
in 15 seconds on a Pentium-4 (2.4 GHz, 256 Mb
RAM, Linux). In order to deal with very large (at
least one billion points) data sets, the incremental
version is extended from the computation of E
T
E
and d=E
T
De.
3 INCREMENTAL PSVM
3.1 Row-incremental PSVM
(Fung and Mangasarian,2002) have proposed to split
the training data set E into blocks of lines E
i
, D
i
and
compute E
T
E and d=E
T
De from these blocks : E
T
E =
∑ E
i
T
E
i
and d = ∑ d
i
= ∑ E
i
T
D
i
e. For each step, we
only need to load the (blocksize)x(n+1) matrix E
i
and the (blocksize)x1 vector D
i
e for computing E
T
E
and d=E
T
De. We only need to store in memory
(n+1)x(n+1) and (n+1)x1 matrices although the
order of the data set is one billion data points. The
authors have performed the linear classification of
one billion data points in 10-dimensional input space
into two classes in less than 2 hours and 26 minutes
on a Pentium II.
3.2 Column-incremental PSVM
The algorithm described in the previous section can
handle data sets with a very large number of
datapoints and small number of attributes. But some
applications (like bioinformatics or text mining)
require data sets with a very large number of
attributes and few training data. To adapt the
algorithm to this problem, we have applied the
Sherman-Morrison-Woodbury formula to the linear
equation system (4) to obtain:
[w
1
w
2
.. w
n
b]
T
= (I/ν + E
T
E)
-1
E
T
De
= νE
T
[De – (I/ν + EE
T
)
-1
EE
T
De] (5)
where E = [A -e]
The solution of (5) depends on the inversion of the
(m)x(m) matrix (I/ν + EE
T
) instead of the
(n+1)x(n+1) matrix (I/ν + E
T
E) in (4). The cost of
storage and computation depends on the number of
training data. This formulation can handle data sets
with very large number of attributes and few training
data. We have imitated the row-incremental
algorithm for constructing the column-incremental
algorithm able to deal with very large number of
dimensions. The data are split in blocks of columns
E
i
and then we perform the incremental computation
of EE
T
= ∑ E
i
E
i
T
. For each step, we only need to
load the (m)x(blocksize) matrix E
i
for computing
EE
T
. Between two incremental steps, we need to
store in memory the (m)x(m) matrix EE
T
although
the order of the dimensional input space is very
high. With these two formulations of the linear
incremental PSVM, we are able to deal with very
large data sets (large either in training data or
number of attributes, but not yet both
simultaneously). We have used them to classify bio-
medical data sets with interesting results in terms of
learning time and classification accuracy (Do &
Poulet, 2003). The parallel and distributed version of
the two incremental PSVM algorithms can be found
in (Poulet & Do, 2003) and (Poulet, 2003).
4 BOOSTING OF PSVM
For mining massive data sets with simultaneously
large number (at least 10
4
) of datapoints and
attributes, there are at least two problems to solve:
the learning time and the memory requirement. The
PSVM algorithm and its incremental versions need
to store and invert a matrix with size mxm (or nxn).
To scale PSVM to large data sets, we have applied
the boosting approach to the PSVM algorithm. We
briefly explain the mechanism of boosting of PSVM,
more details about boosting can be found in (Freund
& Chapire, 1999). Boosting technique is a general
method for improving the accuracy of any given
learning algorithm. The boosting algorithm calls
repeatedly a given weak or base learning algorithm k
times so that each boosting step concentrates mostly
on the errors produced by the previous step. For
achieving this goal, we need to maintain a
distribution weights over the training examples.
Initially, all weights are set equally and at each
boosting step the weights of incorrectly classified
examples are increased so that the weak learner is
forced to focus on the hard examples in the training
set. The final hypothesis is a weighted majority vote
of k weak hypotheses. Alternately, we consider the
PSVM algorithm as a weak algorithm thus at each
boosting step we can sample a subset of the training
set according to the distribution weights over the
training examples. Note that PSVM only classifies
the subset (less than the original training set). The
subset size is in opposite proportion to the number of
boosting steps. Row-incremental or Column-
incremental PSVM can be adapted to solve large
sizes of subset with high performances concerning
ICEIS 2004 - ARTIFICIAL INTELLIGENCE AND DECISION SUPPORT SYSTEMS
38
the learning time, the memory requirements and the
classification accuracy.
5 VISUALIZATION TOOL TO
EXPLAIN BOOSTING RESULTS
For many data mining applications, understanding
the model obtained by the algorithm is as important
as the accuracy, it is necessary that the user has
confidence in the knowledge discovered (model) by
data mining algorithms. This can help to reduce the
risk of wrong decisions or incorrect assumptions
made during the mining task. Although SVM and
boosting algorithms have been successfully applied
to a number of applications, they provide limited
information. Most of the time, the user only knows
the classification accuracy. It is difficult to really
explain or verify the constructed model or
understand why the SVM and boosting algorithms
are more efficient than the other ones. Information
visualization methods can be used to improve the
results comprehensibility. There are very few
research papers about the visualization of SVM
(Poulet, 2003a) or boosting results. So we have
developed a new method that can help the user to
understand the model constructed by our boosting of
PSVM algorithm. No single visualization method is
best for high-dimensional data mining. This implies
that we should design a visualization tool which
combines forces from an arsenal of visualization
methods. We propose to use data distribution
according to predictive value with 2D-scatterplot
matrices method. The understanding can be greatly
enhanced by visualizing the same information in
different ways. Each view provides the user with
useful information. While the classification task is
processed (based on the model obtained), we also
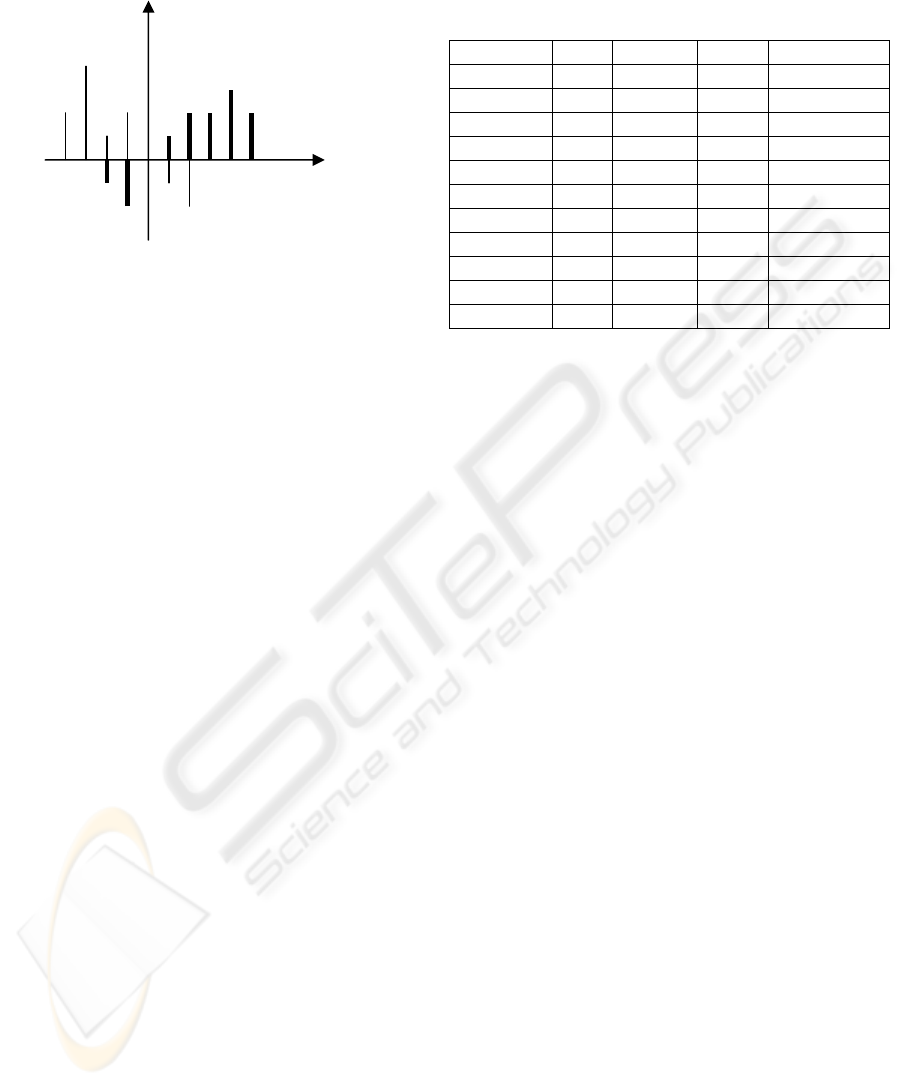
compute the distribution of the points according to
predictive value. For each class, the positive
distribution is the set of correctly classified data
points, and the negative distribution is the set of
misclassified data points as shown in figure 2.
Datapoints being near the frontier between classes
correspond to bar charts being near the origin. When
these bar charts are selected, the corresponding
datapoints are displayed in all possible pair wise
combinations of dimensions in 2D-scatterplot
matrices. The user can see approximative frontier
between classes. This can help the user to improve
the comprehensibility of the obtained model, his
confidence in the knowledge discovered is
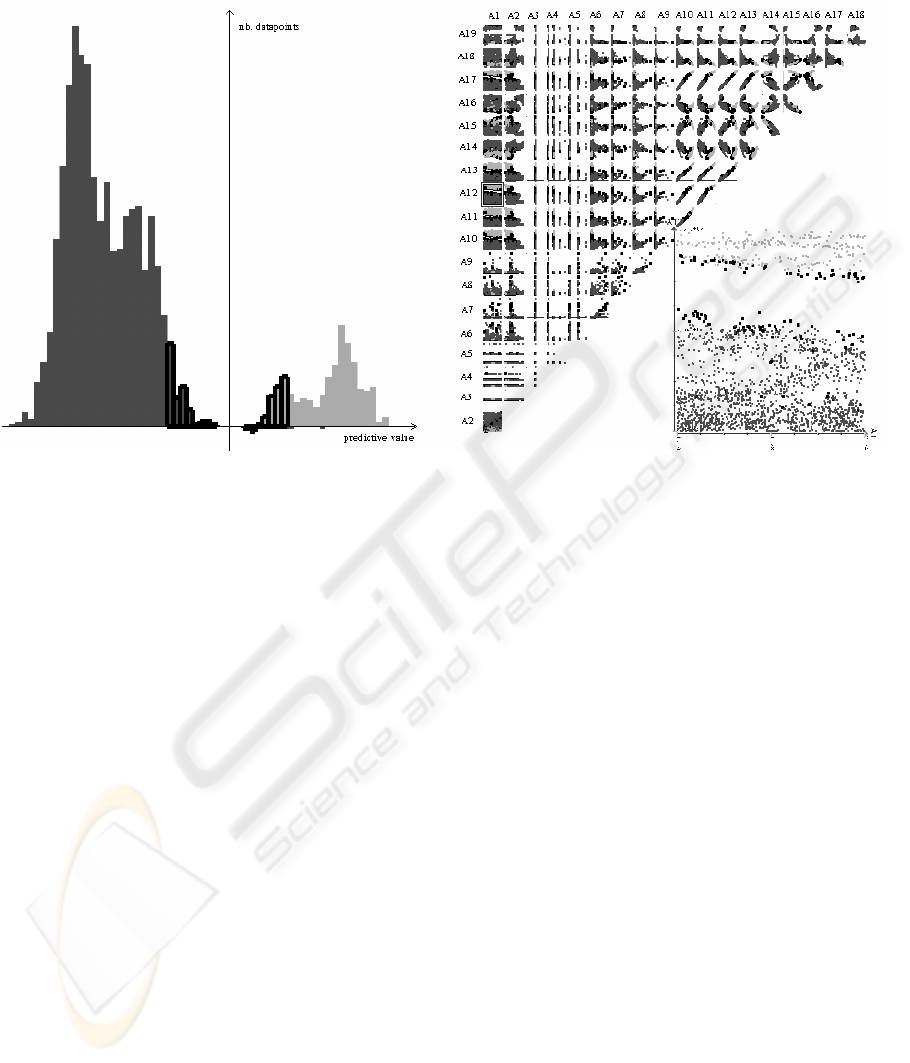
increased. The visualization tool has been applied to
the Segment data set of Statlog. This data set has
2310 datapoints, 19 attributes and 7 classes. We
consider the class 2 as +1 class and all others classes
are considered as -1 class. Our boosting of PSVM
algorithm is used to classify this data set. The
understanding of the result is enhanced in our
visualization tool as shown in the figure 3.
6 NUMERICAL TEST RESULTS
The software program is implemented in C/C++ on
PC (Linux). We are interested in the evaluation of
the performances concerning the learning time, the
accuracy and the memory requirements. We have
selected 3 synthetic data sets generated by
Twonorm, Ringnorm, NDC and 8 data sets from the
UCI repository. These data sets are described in
table 1. Nominal attributes from the Adult and
Mushroom datasets are converted into binary
attributes. We have used the new boosting of linear
PSVM (Boost-PSVM) and LibSVM with linear
kernel to classify data sets on a Pentium-4 machine,
2.4 GHz CPU, and 256 MB RAM. The first small
data sets are used to evaluate the classification
accuracy, learning time shown in table 2. Boost-
PSVM is outperforming LibSVM in six data sets on
Table 1: Data sets description
Class
Rows Attr. method
Twonorm 2 7400 20 300 / 7100
Ringnorm 2 7400 20 300 / 7100
Pima 2 768 8 10-fold
Bupa 2 345 6 10-fold
Ionosphere
2 351 34 10-fold
Mushroom
2 8124 22 10-fold
Tic-tac-toe
2 958 9 10-fold
Adult 2 48842 14 32561/16281
Reuters 135 10789 29406 7770 / 3019
Forest 8 581012 54 10-fold
Ndc 2 55000 20000 50000 / 5000
misclassification
nb. points
predictive value
–
1
correct classification
+1
Figure 2: Data distribution according to predictive value
TOWARDS HIGH DIMENSIONAL DATA MINING WITH BOOSTING OF PSVM AND VISUALIZATION TOOLS
39

classification correctness and four data sets on
learning time. Note that the training time of LibSVM
increases dramatically with the size of the training
data. For example for the Adult data set, Boost-
PSVM is a factor of 190 faster than LibSVM.
We have used the Bow software program
(McCallum, 1998) to pre-process the Reuters-21578
data. Each document is represented as a vector of
words. Thus we have obtained 29406 words
(attributes) without any feature selection. We have
classified the 10 largest categories. This data set has
more than 2 classes so we used the one-against-all
approach. The most popular measures are based on
Precision and Recall. The table 3 reports the average
of Precision and Recall (breakeven point). Boost-
PSVM has given the best accuracy on 9 of 10
categories. However, the learning time of Boost-
PSVM is twice as LibSVM one because the Boost-
PSVM needs many boost steps to achieve a good
classification correctness.
Two very large data sets are used to estimate the
execution time and memory requirements of the
algorithms. LibSVM loads the whole data set in the
memory so we have increased the capacity of RAM.
For Forest cover type data set, we have classified the
2 largest classes (Spruce-Fire: 211840 rows and
Lorgepole-Pine: 283301 rows with 54 attributes).
We have generated a large data set with 55000
points, 20000 attributes and 2 classes (about 4 GB)
with NDC. For both data sets, LibSVM has not
finished its learning task. For classifying Forest
cover type data, LibSVM was running during 21
days without any result. For the NDC data set,
loading the whole data in memory requires at least
4 GB RAM, so we could not obtain any result with
LibSVM. Our Boost-PSVM algorithm only needs
256 MB of RAM but it had to read data for each
boosting step (96 % of the time was spent to read
data from disk). Finally, the results in table 4 show
that Boost-PSVM is able to mine massive data sets
with simultaneously very large number of datapoints
and attributes on PCs in acceptable execution time.
7 CONCLUSION
We have developed a new boosting of PSVM able to
classify very large data sets on personal computers.
The main idea is to extend PSVM algorithms with
boostong for scaling data mining algorithms to
massive data sets. Numerical test results have shown
that the new boosting of PSVM algorithm is fast and
accurate. It was compared with LibSVM. For small
size data sets, it preserves learning speed and
classification correctness. The new algorithm has
also shown effectiveness concerning the execution
time, the memory requirement and the accuracy for
massive data sets with simultaneously very large
number of datapoints and attributes. We also
proposed a visualization tools for trying to interpret
the results of PSVM. A multiple views approach is
used to display the frontier between classes. This can
help the user to understand how and why the
algorithm works so well. This avoids using
automatic mining algorithm as a “black box”.
Forthcoming improvements will be to extend this
algorithm to build parallel and distributed algorithms
and to combine our method with other graphical
techniques (Fayyad et al., 2001), (Poulet, 2002) to
construct another kind of cooperation between SVM,
boosting and visualization tools.
Table 2
-
Performance of Boost
-
PSVM and
LibSVM on small data sets
Time (secs) Accuracy (%)
Boost
PSVM
Lib
SVM
Boost
PSVM
Lib
SVM
Twonorm 0,06
0,03 97,04
97,01
Ringnorm
0,14
0,23
75,07
73,82
Pima 0,088
0,085 77,50
76,82
Bupa 0,043
0,019 69,12
68,41
Ionosphere
0,106
0,044
88,00
88,32
Mushroom
1,528
3,75
100,00
100,00
Tic-tac-toe
0,089
0,323
65,63
65,34
Adult
12,86
2472 85,25
85,29
Table 4 – BoostPSVM results on large data sets
Table 3
-
Breakeven performance for the 10 largest
categories of Reuters-21578
Accuracy (%) Time(secs)
Boost
PSVM
LibSVM
Boost
PSVM
LibSVM
Earn
98.41
98.02
8,42
9,4
Acq
96.57
95.66
8,47
10,78
Money-fx
79.49
75.72 7,68
7,4
Grain
90.75
89.33 9,86
5,05
Crude
89.83
86.62 8,05
5,7
Trade
78.18
77.46 8,01
5,73
Interest
78.32
75.57 13,33
8,69
Ship
84.60
83.00 14,21
5,36
Wheat
86.38
85.58 14,10
3,54
Corn 88.97
88.99
6,28
3,79
RAM(MB) Accuracy (%) time (min)
Forest
19 77.41 23,2
Ndc 193 81,18 1491,2
ICEIS 2004 - ARTIFICIAL INTELLIGENCE AND DECISION SUPPORT SYSTEMS
40
Acknowledgements. Thanks to Jason Rennie for his
help with preparing Reuters-21578 text collection.
REFERENCES
Blake, C., Merz, C., 1998. UCI Repository of Machine
Learning Databases.
Breiman, L., 1996. Bias, Variance and Arcing Classifiers.
In Technical Report 460, Statistics Department,
University of California.
Chang, C-C., Lin C-J., 2003. A Library for Support Vector
Machines. http://www.csie.ntu.edu.tw/~cjlin/libsvm
Cristianini, N. and Shawe-Taylor, J., 2000. An
Introduction to Support Vector Machines and Other
Kernel-based Learning Methods. Cambridge
University Press.
Do, T-N., Poulet, F., 2003. Incremental SVM and
Visualization Tools for Bio-medical Data Mining. In
proc. of Workshop on Data Mining and Text Mining
in Bioinformatics, ECML/PKDD’03, Cavtat-
Dubrovnik, Croatia, pp. 14-19.
Fayyad, U., Grinstein, G., Wierse, A., 2001. Information
Visualization in Data Mining and Knowledge
Discovery. Morgan Kaufmann Publishers.
Fayyad, U., Piatetsky-Shapiro, G., Smyth, P., Uthurusamy,
R., 1996. Advances in Knowledge Discovery and Data
Mining. AAAI Press.
Freund, Y., Chapire, R., 1999. A Short Introduction to
Boosting. In Journal of Japanese Society for Artificial
Intelligence, 14(5), pp. 771-780.
Fung, G., Mangasarian, O., 2001. Proximal Support
Vector Machine Classifiers. In proc. of the 7
th
ACM
SIGKDD Int. Conf. on KDD’01, San Francisco, USA,
pp. 77-86.
Fung, G., Mangasarian, O., 2002. Incremental Support
Vector Machine Classification. In proc. of the 2
nd
SIAM Int. Conf. on Data Mining SDM'2002
Arlington, Virginia, USA, pp. 247-260.
Golub, G., van Loan, C., 1996. Matrix Computations. John
Hopkins University Press, Baltimore, Maryland, 3
rd
Edition.
McCallum, A., 1998. Bow: A Toolkit for Statistical
Language Modeling, Text Retrieval, Classification and
Clustering. http://www-2.cs.cmu.edu/~mccallum/bow
Musicant D., 1998. NDC : Normally Distributed Clustered
Data sets. http://www.cs.wisc.edu/~musicant/data/ndc/
Poulet, F., 2002. Full-View: A Visual Data Mining
Environment. In Int. Journal of Image and Graphics,
2(1), pp. 127-143.
Poulet, F., 2003. Multi-way Distributed SVM Algorithms.
In proc. of Workshop on Parallel and Distributed
Computing for Machine Learning, ECML/PKDD’03,
Cavtat-Dubrovnik, Croatia, pp. 59-70.
Poulet, F., Do, T-N., 2003. Mining Very Large Data sets
with Support Vector Machine Algorithms. In
Enterprise Information Systems V, Kluwer.
Vapnik, V., 1995. The Nature of Statistical Learning
Theory. Springer-Verlag, New York.
Figure 3: Visualization of the Boost-PSVM result on Segment dataset
TOWARDS HIGH DIMENSIONAL DATA MINING WITH BOOSTING OF PSVM AND VISUALIZATION TOOLS
41
