
INTRUSION DETECTION SYSTEMS
USING ADAPTIVE REGRESSION SPLINES
Srinivas Mukkamala, Andrew H. Sung
Department of Computer Science, New Mexico Tech, Socorro, U.S.A.
Ajith Abraham
Bio Inspired Grid (BIG) Lab, Department of Computer Science, Oklahama State University, Tulsa, U.S.A.
Vitorino Ramos
CVRM-IST, Instituto Superior Técnico,Technical University of Lisbon, Lisbon, Portugal
Keywords: Network security, intrusion detection, adaptive regression splines, neural networks, support vector machines
Abstract: Past few years have witnessed a growing recognition of intelligent techniques for the construction of
efficient and reliable intrusion detection systems. Due to increasing incidents of cyber attacks, building
effective intrusion detection systems (IDS) are essential for protecting information systems security, and yet
it remains an elusive goal and a great challenge. In this paper, we report a performance analysis between
Multivariate Adaptive Regression Splines (MARS), neural networks and support vector machines. The
MARS procedure builds flexible regression models by fitting separate splines to distinct intervals of the
predictor variables.
A brief comparison of different neural network learning algorithms is also given.
1 INTRODUCTION
Intrusion detection is a problem of great significance
to protecting information systems security,
especially in view of the worldwide increasing
incidents of cyber attacks. Since the ability of an
IDS to classify a large variety of intrusions in real
time with accurate results is important, we will
consider performance measures in three critical
aspects: training and testing times; scalability; and
classification accuracy.
Since most of the intrusions can be located by
examining patterns of user activities and audit
records (Denning, 1987), many IDSs have been built
by utilizing the recognized attack and misuse
patterns. IDSs are classified, based on their
functionality, as misuse detectors and anomaly
detectors. Misuse detection systems use well-known
attack patterns as the basis for detection (Denning,
1987; Kumar, 1994). Anomaly detection systems
use user profiles as the basis for detection; any
deviation from the normal user behaviour is
considered an intrusion (Denning, 1987; Kumar,
1994; Ghosh, 1999; Cannady, 1998).
One of the main problems with IDSs is the
overhead, which can become unacceptably high. To
analyse system logs, the operating system must keep
information regarding all the actions performed,
which invariably results in huge amounts of data,
requiring disk space and CPU resource.
Next, the logs must be processed to convert into
a manageable format and then compared with the set
of recognized misuse and attack patterns to identify
possible security violations. Further, the stored
patterns need be continually updated, which would
normally involve human expertise. An intelligent,
adaptable and cost-effective tool that is capable of
(mostly) real-time intrusion detection is the goal of
the researchers in IDSs. Various artificial
intelligence techniques have been utilized to
26
Mukkamala S., H. Sung A., Abraham A. and Ramos V. (2004).
INTRUSION DETECTION SYSTEMS USING ADAPTIVE REGRESSION SPLINES.
In Proceedings of the Sixth International Conference on Enterprise Information Systems, pages 26-33
DOI: 10.5220/0002649600260033
Copyright
c
SciTePress

automate the intrusion detection process to
reduce human intervention; several such techniques
include neural networks (Ghosh, 1999; Cannady,
1998; Ryan 1998; Debar, 1992a-b), and machine
learning (Mukkamala, 2002a). Several data mining
techniques have been introduced to identify key
features or parameters that define intrusions (Luo,
2000; Cramer, 1995; Stolfo, 2000; Mukkamala,
2002b).
In this paper, we explore Multivariate Adaptive
Regression Splines (MARS) (Steinberg, 1999),
Support Vector Machines (SVM) and Artificial
Neural Networks (ANN), to perform intrusion
detection based on recognized attack patterns. The
data we used in our experiments originated from
MIT’s Lincoln Lab. It was developed for intrusion
detection system evaluations by DARPA and is
considered a benchmark for IDS evaluations
(Lincoln Laboratory, 1998-2000).
We perform experiments to classify the network
traffic patterns according to a 5-class taxonomy. The
five classes of patterns in the DARPA data are
(normal, probe, denial of service, user to super-user,
and remote to local).
In the rest of the paper, a brief introduction to the
data we use is given in section 2. Section 3 briefly
introduces to MARS. In section 4 a brief
introduction to the connectionist paradigms (ANNs
and SVMs) is given. In section 5 the experimental
results of using MARS, ANNs and SVMs are given.
The summary and conclusions of our work are given
in section 6.
2 INTRUSION DETECTION DATA
In the 1998 DARPA intrusion detection evaluation
program, an environment was set up to acquire raw
TCP/IP dump data for a network by simulating a
typical U.S. Air Force LAN. The LAN was
operated like a real environment, but being blasted
with multiple attacks (Kris, 1998; Seth, 1998). For
each TCP/IP connection, 41 various quantitative and
qualitative features were extracted (Stolfo, 2000;
University of California at Irvine, 1999). Of this
database a subset of 494021 data were used, of
which 20% represent normal patterns. Attack types
fall into four main categories:
- Probing: surveillance and other probing
- DoS: denial of service
- U2Su: unauthorized access to local super user
(root) privileges
- R2L: unauthorized access from a remote machine.
2.1 Probing
Probing is a class of attacks where an attacker scans
a network to gather information or find known
vulnerabilities. An attacker with a map of machines
and services that are available on a network can use
the information to look for exploits. There are
different types of probes: some of them abuse the
computer’s legitimate features; some of them use
social engineering techniques. This class of attacks
is the most commonly heard and requires very little
technical expertise.
2.2 Denial of Service Attacks
Denial of Service (DoS) is a class of attacks where
an attacker makes some computing or memory
resource too busy or too full to handle legitimate
requests, thus denying legitimate users access to a
machine. There are different ways to launch DoS
attacks: by abusing the computers legitimate
features; by targeting the implementations bugs; or
by exploiting the system’s misconfigurations. DoS
attacks are classified based on the services that an
attacker renders unavailable to legitimate users.
2.3 User to Root Attacks
User to root exploits are a class of attacks where an
attacker starts out with access to a normal user
account on the system and is able to exploit
vulnerability to gain root access to the system. Most
common exploits in this class of attacks are regular
buffer overflows, which are caused by regular
programming mistakes and environment
assumptions.
2.4 Remote to User Attacks
A remote to user (R2L) attack is a class of attacks
where an attacker sends packets to a machine over a
network, then exploits machine’s vulnerability to
illegally gain local access as a user. There are
different types of R2U attacks; the most common
attack in this class is done using social engineering.
3 MULTIVARIATE ADAPTIVE
REGRESSION SPLINES (MARS)
Splines can be considered as an innovative
mathematical process for complicated curve
drawings and function approximation. To develop a
spline the X-axis is broken into a convenient number
INTRUSION DETECTION SYSTEMS USING ADAPTIVE REGRESSION SPLINES
27

of regions. The boundary between regions is also
known as a knot. With a sufficiently large number of
knots virtually any shape can be well approximated.
While it is easy to draw a spline in 2-dimensions by
keying on knot locations (approximating using
linear, quadratic or cubic polynomial etc.),
manipulating the mathematics in higher dimensions
is best accomplished using basis functions. The
MARS model is a regression model using basis
functions as predictors in place of the original data.
The basis function transform makes it possible to
selectively blank out certain regions of a variable by
making them zero, and allows MARS to focus on
specific sub-regions of the data. It excels at finding
optimal variable transformations and interactions,
and the complex data structure that often hides in
high-dimensional data (Friedman, 1991).
Given the number of records in most data sets, it
is infeasible to approximate the function y=f(x) by
summarizing y in each distinct region of x. For some
variables, two regions may not be enough to track
the specifics of the function. If the relationship of y
to some x's is different in 3 or 4 regions, for
example, the number of regions requiring
examination is even larger than 34 billion with only
35 variables (Steinberg, 1999). Given that the
number of regions cannot be specified a priori,
specifying too few regions in advance can have
serious implications for the final model. A solution
is needed that accomplishes the following two
criteria:
- judicious selection of which regions to look at
and their boundaries
- judicious determination of how many intervals
are needed for each variable.
Given these two criteria, a successful method
will essentially need to be adaptive to the
characteristics of the data. Such a solution will
probably ignore quite a few variables (affecting
variable selection) and will take into account only a
few variables at a time (also reducing the number of
regions). Even if the method selects 30 variables for
the model, it will not look at all 30 simultaneously.
Such simplification is accomplished by a decision
tree at a single-node, only ancestor splits are being
considered; thus, at a depth of six levels in the tree,
only six variables are being used to define the node.
3.1 MARS Smoothing, Spholines, Knots
Selection and Basis Functions
To estimate the most common form, the cubic
spline, a uniform grid is placed on the predictors and
a reasonable number of knots are selected. A cubic
regression is then fit within each region. This
approach, popular with physicists and engineers who
want continuous second derivatives, requires many
coefficients (four per region), in order to be
estimated. Normally, two constraints, which
dramatically reduce the number of free parameters,
can be placed on cubic splines: curve segments must
join, and continuous first and second derivatives at
knots (higher degree of smoothness).
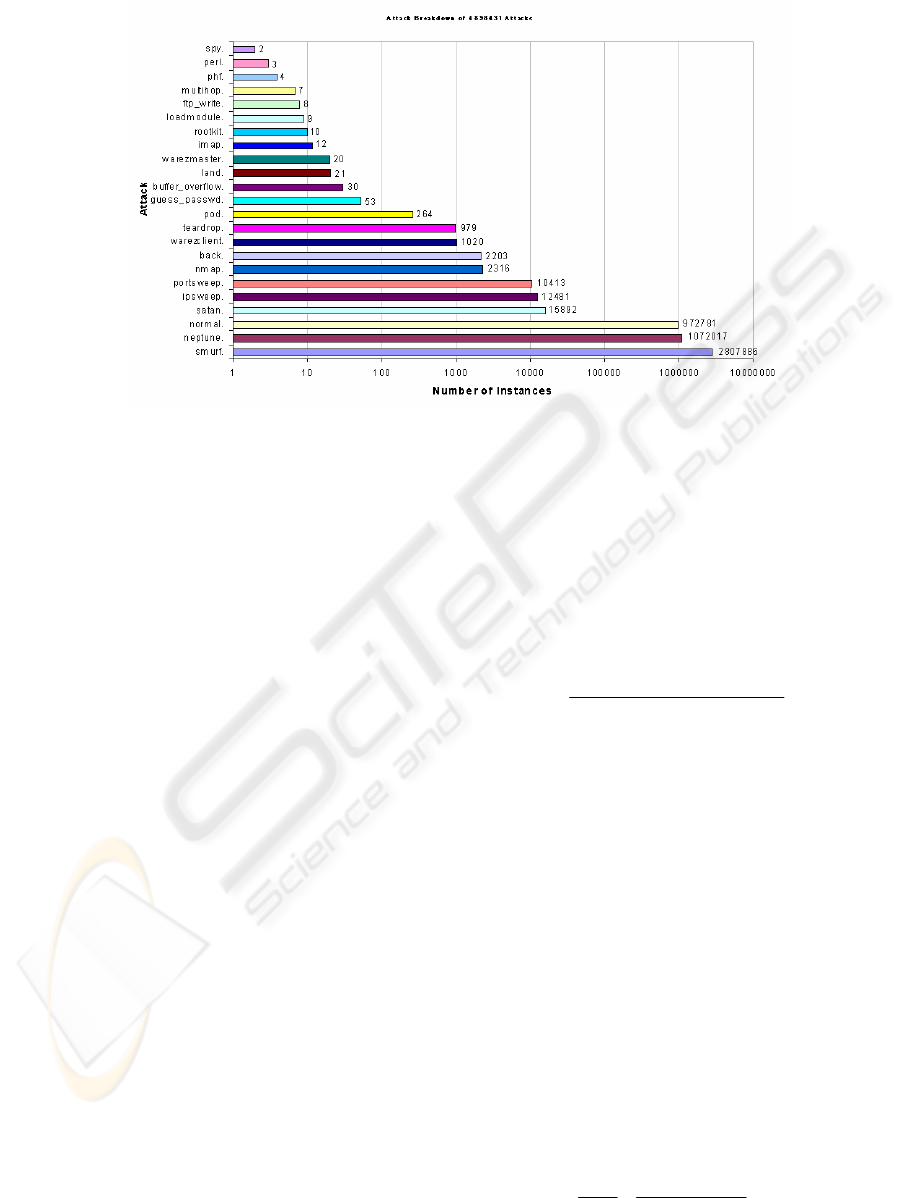
Figure 1 shows typical attacks and their
distribution while Figure 2 (section 5) depicts a
MARS spline with three knots (actual data on the
right). A key concept underlying the spline is the
knot. A knot marks the end of one region of data and
the beginning of another. Thus, the knot is where the
behavior of the function changes. Between knots, the
model could be global (e.g., linear regression). In a
classical spline, the knots are predetermined and
evenly spaced, whereas in MARS, the knots are
determined by a search procedure. Only as many
knots as needed are included in a MARS model. If a
straight line is a good fit, there will be no interior
knots. In MARS, however, there is always at least
one "pseudo" knot that corresponds to the smallest
observed value of the predictor (Steinberg, 1999).
Finding the one best knot in a simple regression is a
straightforward search problem: simply examine a
large number of potential knots and choose the
onewith the best R
2
. However, finding the best pair
of knots requires far more computation, and finding
the best set of knots when the actual number needed
is unknown is an even more challenging task.
MARS finds the location and number of needed
knots in a forward/backward stepwise fashion. A
model that is clearly over fit with too many knots is
generated first; then, those knots that contribute least
to the overall fit are removed. Thus, the forward
knot selection will include many incorrect knot
locations, but these erroneous knots will eventually
(although this is not guaranteed), be deleted from the
model in the backwards pruning step (Abraham,
2001; Steinberg, 1999).
ICEIS 2004 - INFORMATION SYSTEMS ANALYSIS AND SPECIFICATION
28
4 CONNECTIONIST PARADIGMS
The artificial neural network (ANN) methodology
enables us to design useful nonlinear systems
accepting large numbers of inputs, with the design
based solely on instances of input-output
relationships.
4.1 Resilient Back propagation (RP)
The purpose of the resilient backpropagation
training algorithm is to eliminate the harmful effects
of the magnitudes of the partial derivatives. Only the
sign of the derivative is used to determine the
direction of the weight update; the magnitude of the
derivative has no effect on the weight update. The
size of the weight change is determined by a
separate update value. The update value for each
weight and bias is increased by a factor whenever
the derivative of the performance function with
respect to that weight has the same sign for two
successive iterations. The update value is decreased
by a factor whenever the derivative with respect that
weight changes sign from the previous iteration. If
the derivative is zero, then the update value remains
the same. Whenever the weights are oscillating the
weight change will be reduced. If the weight
continues to change in the same direction for several
iterations, then the magnitude of the weight change
will be increased (Riedmiller, 1993).
4.2 Scaled Conjugate Gradient
Algorithm (SCG)
The scaled conjugate gradient algorithm is an
implementation of avoiding the complicated line
search procedure of conventional conjugate gradient
algorithm (CGA). According to the SCGA, the
Hessian matrix is approximated by
kk
k
kkkk
kk
p
wEpwE
pwE
λ
σ
σ
+
−+
=
)()(
)(
''
"
where E' and E" are the first and second derivative
information of global error function E (w
k
). The
other terms p
k
, σ
k
and λ
k
represent the weights,
search direction, parameter controlling the change in
weight for second derivative approximation and
parameter for regulating the indefiniteness of the
Hessian. In order to get a good quadratic
approximation of E, a mechanism to raise and lower
λ
k
is needed when the Hessian is positive definite
(Moller, 1993).
4.3 One-Step-Secant Algorithm (OSS)
Quasi-Newton method involves generating a
sequence of matrices G
(k)
that represents
increasingly accurate approximations to the inverse
Hessian (H
-1
). Using only the first derivative
information of E the updated expression is as
follows:
T(k)T
(k)T
(k)T(k)
T
T
(k)1)(k
uv)uG(v
vGv
Gvv)(G
vp
pp
GG +−+=
+
where
Figure1: Intrusion Detection Data Distribution
INTRUSION DETECTION SYSTEMS USING ADAPTIVE REGRESSION SPLINES
29

(k)1)(k
wwp −=
+
,
(k)1)(k
ggv −=
+
,
vGv
vG
u
(k)T
(k)
vp
p
T
−=
and T represents transpose of a matrix. The problem
with this approach is the requirement of computation
and storage of the approximate Hessian matrix for
every iteration. The One-Step-Secant (OSS) is an
approach to bridge the gap between the conjugate
gradient algorithm and the quasi-Newton (secant)
approach. The OSS approach doesn’t store the
complete Hessian matrix; it assumes that at each
iteration the previous Hessian was the identity
matrix. This also has the advantage that the new
search direction can be calculated without
computing a matrix inverse (Bishop, 1995).
4.4 Support Vector Machines (SVM)
The SVM approach transforms data into a feature
space
F that usually has a huge dimension. It is
interesting to note that SVM generalization depends
on the geometrical characteristics of the training
data, not on the dimensions of the input space
(Bishop, 1995; Joachims, 1998). Training a support
vector machine (SVM) leads to a quadratic
optimization problem with bound constraints and
one linear equality constraint. Vapnik (Vladimir,
1995) shows how training a SVM for the pattern
recognition problem leads to the following quadratic
optimization problem (Joachims, 2000):
Minimize:
∑∑∑
===
+−=
l
i
ji
l
j
jiji
l
i
i
xxkyyW
111
),(
2
1
)(
αααα
(1)
Subject to
Ci
y
i
l
i
ii
≤≤∀
∑
=
α
α
0:
1
(2)
where
l is the number of training examples
α
is a
vector of
l variables and each component
i
α
corresponds to a training example (x
i
, y
i
). The
solution of (1) is the vector
*
α
for which (1) is
minimized and (2) is fulfilled.
5 EXPERIMENT SETUP
In our experiments, we perform 5-class
classification. The (training and testing) data set
contains 11982 randomly generated points from the
data set representing the five classes, with the
number of data from each class proportional to its
size, except that the smallest classes are completely
included. The normal data belongs to class1, probe
belongs to class 2, denial of service belongs to class
3, user to super user belongs to class 4, remote to
local belongs to class 5. A different randomly
selected set of 6890 points of the total data set
(11982) is used for testing MARS, SVMs and
ANNs. Overall accuracy of the classifiers is given in
Tables 1-4. Class specific classification of the
classifiers is given in Table 5.
5.1 MARS
We used 5 basis functions and selected a setting of
minimum observation between knots as 10. The
MARS training mode is being set to the lowest level
to gain higher accuracy rates. Five MARS models
are employed to perform five class classifications
(normal, probe, denial of service, user to root and
remote to local). We partition the data into the two
classes of “Normal” and “Rest” (Probe, DoS, U2Su,
R2L) patterns, where the Rest is the collection of
four classes of attack instances in the data set. The
objective is to separate normal and attack patterns.
We repeat this process for all classes. Table 1
summarizes the test results of the experiments.
5.2 Neural Network
The same data set described in section 2 is being
used for training and testing different neural network
algorithms. The set of 5092 training data is divided
in to five classes: normal, probe, denial of service
attacks, user to super user and remote to local
attacks. Where the attack is a collection of 22
different types of instances that belong to the four
classes described in section 2, and the other is the
normal data. In our study we used two hidden layers
with 20 and 30 neurons each and the networks were
trained using training functions described in Table 2.
The network was set to train until the desired mean
square error of 0.001 was met. As multi-layer feed
forward networks are capable of multi-class
classifications, we partition the data into 5 classes
(Normal, Probe, Denial of Service, and User to Root
and Remote to Local).
Figure 2: MARS data estimation using splines and knots
ICEIS 2004 - INFORMATION SYSTEMS ANALYSIS AND SPECIFICATION
30

Table 1: MARS Test Performance
Class Accuracy
Normal 96.08 %
Probe 92.32 %
DOS 94.73 %
U2Su 99.71 %
R2L 99.48 %
Table 2: Test Performance of Different Neural Network Training Functions
Training Algorithm No of Epochs Accuracy (%)
Gradient descent 3500 61.70
Gradient descent with momentum 3500 51.60
Adaptive learning rate 3500 95.38
Resilient back propagation 67 97.04
Fletcher-Reeves conjugate gradient 891 82.18
Polak-Ribiere conjugate gradient 313 80.54
Powell-Beale conjugate gradient 298 91.57
Scaled conjugate gradient 351 80.87
BFGS quasi-Newton method 359 75.67
One step secant method 638 93.60
Levenberg-Marquardt 17 76.23
Bayesian regularization 533 64.15
Table 3: Performance of the Best Neural Network Training Function (Resilient Back Propagation)
Class of Attack Normal Probe DoS U2Su R2L %
Normal 1394 5 1 0 0 99.6
Probe 49 649 2 0 0 92.7
DoS 3 101 4096 2 0 97.5
U2Su 0 1 8 12 4 48.0
R2L 0 1 6 21 535 95.0
% 96.4 85.7 99.6 34.3 99.3
Table 4: Detection Accuracy of SVMs
Class of Attack Training Time (sec) Testing Time (sec) Accuracy (%)
Normal 7.66 1.26 99.55
Probe 49.13 2.10 99.70
DoS 22.87 1.92 99.25
U2Su 3.38 1.05 99.87
R2L 11.54 1.02 99.78
INTRUSION DETECTION SYSTEMS USING ADAPTIVE REGRESSION SPLINES
31

Table 5: Performance Comparison of Testing for 5 Class Classifications
Accuracy (%)
Class of Attack
SVM RP SCG OSS MARS
Normal 98.42 99.57 99.57 99.64 96.08
Probe 98.57 92.71 85.57 92.71 92.32
DoS 99.11 97.47 72.01 91.76 94.73
U2Su 64.00 48.00 0.00 16.00 99.71
R2L 97.33 95.02 98.22 96.80 99.48
We used the same testing data (6890), same network
architecture and same activations functions to
identify the best training function that plays a vital
role for in classifying intrusions. Table 2
summarizes the performance of the different
learning algorithms. The top-left entry of Table 3
shows that 1394 of the actual “normal” test set were
detected to be normal; the last column indicates that
99.6 % of the actual “normal” data points were
detected correctly. In the same way, for “Probe” 649
of the actual “attack” test set were correctly
detected; the last column indicates that 92.7% of the
actual “Probe” data points were detected correctly.
The bottom row shows that 96.4% of the test set said
to be “normal” indeed were “normal” and 85.7% of
the test set classified, as “probe” indeed belongs to
Probe. The overall accuracy of the classification is
97.04 with a false positive rate of 2.76% and false
negative rate of 0.20.
5.3 SVM
Since SVMs are only capable of binary
classifications, we will need to employ five SVMs,
for the 5-class classification problem in intrusion
detection, respectively. We partition the data into the
two classes of “Normal” and “Rest” (Probe, DoS,
U2Su, R2L) patterns, where the Rest is the
collection of four classes of attack instances in the
data set. The objective is to separate normal and
attack patterns. We repeat this process for all
classes. Training is done using the radial bias kernel
option; an important point of the kernel function is
that it defines the feature space in which the training
set examples will be classified. Table 4 summarizes
the overall results of the experiments using the test
dataset. The empirical values presented depict the
accuracy to detect the various attacks (reduction in
false alarm rate) and helps to estimate the volume of
false alarms if SVMs were deployed.
6 CONCLUSIONS
A number of observations and conclusions are
drawn from the results reported: MARS is superior
to SVMs in respect to classifying the most important
classes (U2Su and R2L) in terms of the attack
severity. SVMs outperform ANNs in the important
respects of scalability (the former can train with a
larger number of patterns, while would ANNs take a
long time to train or fail to converge at all when the
number of patterns gets large); training time and
running time (SVMs run an order of magnitude
faster); and prediction accuracy. Resilient back
propagation achieved the best performance among
the neural network learning algorithms in terms of
accuracy (97.04 %) and faster convergence (67
epochs). We note, however, that the difference in
accuracy figures tend to be very small and may not
be statistically significant, especially in view of the
fact that the 5 classes of patterns differ in their sizes
tremendously. More definitive conclusions can only
be made after analysing more comprehensive sets of
network traffic data.
Finally, another gifted research line includes the
potential use of MARS hybridized with self-
organized ant-like evolutionary models as proposed
in past works (Ramos, 2003; Abraham, 2003). The
implementation of this swarm intelligence along
with
Stigmergy (Ramos, 2002) and the study of ant
colonies behaviour and their self-organizing
capabilities are decisively of direct interest to
knowledge retrieval/management and decision
support systems sciences. In fact they can provide
new models of distributed, adaptive and collective
organization, enhancing MARS data estimation on
ever changing environments (e.g. dynamic data on
real-time), as those we now increasingly tend to face
over new disseminated information systems
paradigms and challenges.
ICEIS 2004 - INFORMATION SYSTEMS ANALYSIS AND SPECIFICATION
32

ACKNOWLEDGEMENTS
Support for this research received from ICASA (Institute
for Complex Additive Systems Analysis, a division of
New Mexico Tech), U.S. Department of Defense IASP and
NSF capacity building grant is gratefully acknowledged,
as well as for FCT PRAXIS XXI research fellowship,
Science & Technology Foundation - Portugal. Finally, we
would also like to acknowledge many insightful
conversations with Dr. Jean-Louis Lassez and David
Duggan that helped clarify some of our ideas.
REFERENCES
Abraham A., Ramos V., 2003. Web Usage Mining Using
Artificial Ant Colony and Genetic Programming,
Congress on Evolutionary Computation (CEC’03),
IEEE Press, pp. 1384-1391.
Abraham A., Steinberg D., 2001. MARS: Still an Alien
Planet in Soft Computing? International Conference
on Computational Science, Springer-Verlag Germany,
Lecture Notes in Computer Science 2074, pp. 235-
244.
Bishop C. M., Neural Networks for Pattern Recognition,
Oxford Press, 1995.
Cannady J., 1998. Artificial Neural Networks for Misuse
Detection. National Information Systems Security
Conference.
Cramer M., et. al. 1995. New Methods of Intrusion
Detection using Control-Loop Measurement.
Proceedings of the Technology in Information Security
Conference (TISC), pp. 1-10.
Debar H., Becke M., Siboni D., 1992a. A Neural Network
Component for an Intrusion Detection System.
Proceedings of the IEEE Computer Society
Symposium on Research in Security and Privacy.
Debar H., Dorizzi. B., 1992b. An Application of a
Recurrent Network to an Intrusion Detection System.
Proceedings of the International Joint Conference on
Neural Networks, pp.78-83.
Denning D., 1987. An Intrusion-Detection Model. IEEE
Trans. on Software Engineering, Vol.SE-13, Nº 2.
Friedman, J. H, 1991. Multivariate Adaptive Regression
Splines, Annals of Statistics, Vol 19, pp. 1-141.
Ghosh A. K., 1999. Learning Program Behavior Profiles
for Intrusion Detection. USENIX.
Joachims T., 1998. Making Large-Scale SVM Learning
Practical. University of Dortmund, LS8-Report, LS
VIII-Report.
Joachims T., 2000. SVMlight is an Implementation of
Support Vector Machines (SVMs) in C. University of
Dortmund. Collaborative Research Center on
Complexity Reduction in Multivariate Data (SFB475):
<http://ais.gmd.de/~thorsten/svm_light>.
Kendall K., 1998. A Database of Computer Attacks for the
Evaluation of Intrusion Detection Systems. Master's
Thesis, Massachusetts Institute of Technology.
Kumar S., Spafford E. H., 1994. An Application of Pattern
Matching in Intrusion Detection. Technical Report
CSD-TR-94-013, Purdue University.
Lincoln Laboratory, Massachusetts Institute of
Technology (MIT), 1998-2000. DARPA Intrusion
Detection Evaluation:
<www.ll.mit.edu/IST/ideval/data/data_index.html>.
Luo J., Bridges S. M., 2000. Mining Fuzzy Association
Rules and Fuzzy Frequency Episodes for Intrusion
Detection. International Journal of Intelligent
Systems, John Wiley & Sons, pp. 687-703.
Moller A.F., 1993. A Scaled Conjugate Gradient
Algorithm for Fast Supervised Learning. Neural
Networks. Vol. (6), pp. 525-533.
Mukkamala S., Janoski G., Sung A. H., 2002a. Intrusion
Detection Using Neural Networks and Support Vector
Machines. Proceedings of IEEE International Joint
Conference on Neural Networks, pp. 1702-1707.
Mukkamala S., Sung A. H., 2002b. Identifying Key
Features for Intrusion Detection Using Neural
Networks. Proceedings of ICCC International
Conference on Computer Communications 2002.
Ramos V., Abraham A., 2003. Swarms on Continuous
Data. Congress on Evolutionary Computation (CEC),
IEEE Press, pp. 1370-1375.
Ramos V., Muge F., Pina P., 2002. Self-Organized Data
and Image Retrieval as a Consequence of Inter-
Dynamic Synergistic Relationships in Artificial Ant
Colonies. Soft-Computing Systems – Design,
Management and Applications, IOS Press, Frontiers in
Artificial Intelligence and Applications, pp. 500-509.
Riedmiller M., Braun H., 1993. A direct adaptive method
for faster back propagation learning: The RPROP
algorithm. Proceedings of the IEEE International
Conference on Neural Networks.
Ryan J., Lin M-J., Miikkulainen R., 1998. Intrusion
Detection with Neural Networks. Advances in Neural
Information Processing Systems 10, Cambridge, MA:
MIT Press.
Steinberg, D, Colla P. L., Martin K., 1999. MARS User
Guide. Salford Systems, San Diego, CA.
Stolfo J., Fan W., Lee W., Prodromidis A., Chan P.K.,
2000. Cost-based Modeling and Evaluation for Data
Mining with Application to Fraud and Intrusion
Detection. DARPA Information Survivability
Conference.
University of California at Irvine, 1999. KDD Cup:
<http://kdd.ics.uci.edu/databases/kddcup99/task.htm>.
Vladimir V. N., The Nature of Statistical Learning Theory,
Springer-Verlag, Germany, 1995.
Webster S.E., 1998, The Development and Analysis of
Intrusion Detection Algorithms. S.M. Thesis,
Massachusetts Institute of Technology, June 1998.
INTRUSION DETECTION SYSTEMS USING ADAPTIVE REGRESSION SPLINES
33
