
VISUALIZING SOFTWARE PROJECT ANALOGIES TO SUPPORT
COST ESTIMATION
Martin Auer, Bernhard Graser, Stefan Biffl
Institute for Software Technology
Vienna University of Technology
Keywords:
Software project portfolio, portfolio decisions, portfolio visualization, multidimensional scaling, analogy-
based cost estimation.
Abstract:
Software cost estimation is a crucial task in software project portfolio decisions like start scheduling, resource
allocation, or bidding. A variety of estimation methods have been proposed to support estimators.
Especially the analogy-based approach—based on a project’s similarities with past projects—has been re-
ported as both efficient and relatively transparent. However, its performance was typically measured automat-
ically and the effect of human estimators’ sanity checks was neglected.
Thus, this paper proposes the visualization of high-dimensional software project portfolio data using mul-
tidimensional scaling (MDS). We (i) propose data preparation steps for an MDS visualization of software
portfolio data, (ii) visualize several real-world industry project portfolio data sets and quantify the achieved
approximation quality to assess the feasibility, and (iii) outline the expected benefits referring to the visualized
portfolios’ properties.
This approach offers several promising benefits by enhancing portfolio data understanding and by providing
intuitive means for estimators to assess an estimate’s plausibility.
1 INTRODUCTION
Cost and effort estimation (Jones, 1998; Boehm,
1981; Conte et al., 1986) is a ubiquitous task
in software project environments, which are typi-
cally multi-project environments or software project
portfolios. High-quality estimates are fundamental
to stakeholders—success-critical project participants
like project and portfolio managers, as well as quality
managers—in making a variety of prominent software
project portfolio decisions, for example, in the quota-
tion phase and bidding process, in resource allocation,
in project start scheduling, or in risk management. Es-
timation quality thus greatly affects a project portfo-
lio’s performance—high-quality estimates are vital in
making portfolio decisions.
Estimates are typically created in a variant of a
generic estimation process depicted in figure 1 (a
more detailed process is proposed by (Agarwal et al.,
2001)). The process is influenced by a variety of fac-
tors (data quality, estimators’ expertise, used mod-
els, portfolio environment, etc.)—yet much research
effort tries to automatically assess tools’ or meth-
ods’ estimation performance as measured by accuracy
metrics (Shepperd and Schofield, 1997).
While yielding important insights, these ap-
proaches are not sufficient to achieve much-needed
high quality estimation, for two reasons:
• The estimator’s influence is not addressed. Ev-
ery estimate must finally be approved by the de-
cision maker—as (Stensrud and Myrtveit, 1998)
point out—, which greatly affects the results es-
pecially in case of outliers or unlikely estimates,
where the mere automatic application of estimation
tools notoriously fails.
• In addition to the often-used effectiveness criteria
like accuracy and reliability, many other, secondary
criteria must be addressed as well. Efficiency cri-
teria (estimation effort, learning effort), usability
(both to novices and experts), transparency of the
model etc. greatly affect the acceptance of cost es-
timation methods and processes; if not addressed
properly, decision makers will not apply the pro-
posed approaches. (Hihn and Habib-Agahi, 1991)
describe how few methods are actually applied in
industrial environments; (Shepperd and Schofield,
1997) indicate that some complex estimation meth-
61
Auer M., Graser B. and Biffl S. (2004).
VISUALIZING SOFTWARE PROJECT ANALOGIES TO SUPPORT COST ESTIMATION.
In Proceedings of the Sixth International Conference on Enterprise Information Systems, pages 61-68
DOI: 10.5220/0002651200610068
Copyright
c
SciTePress
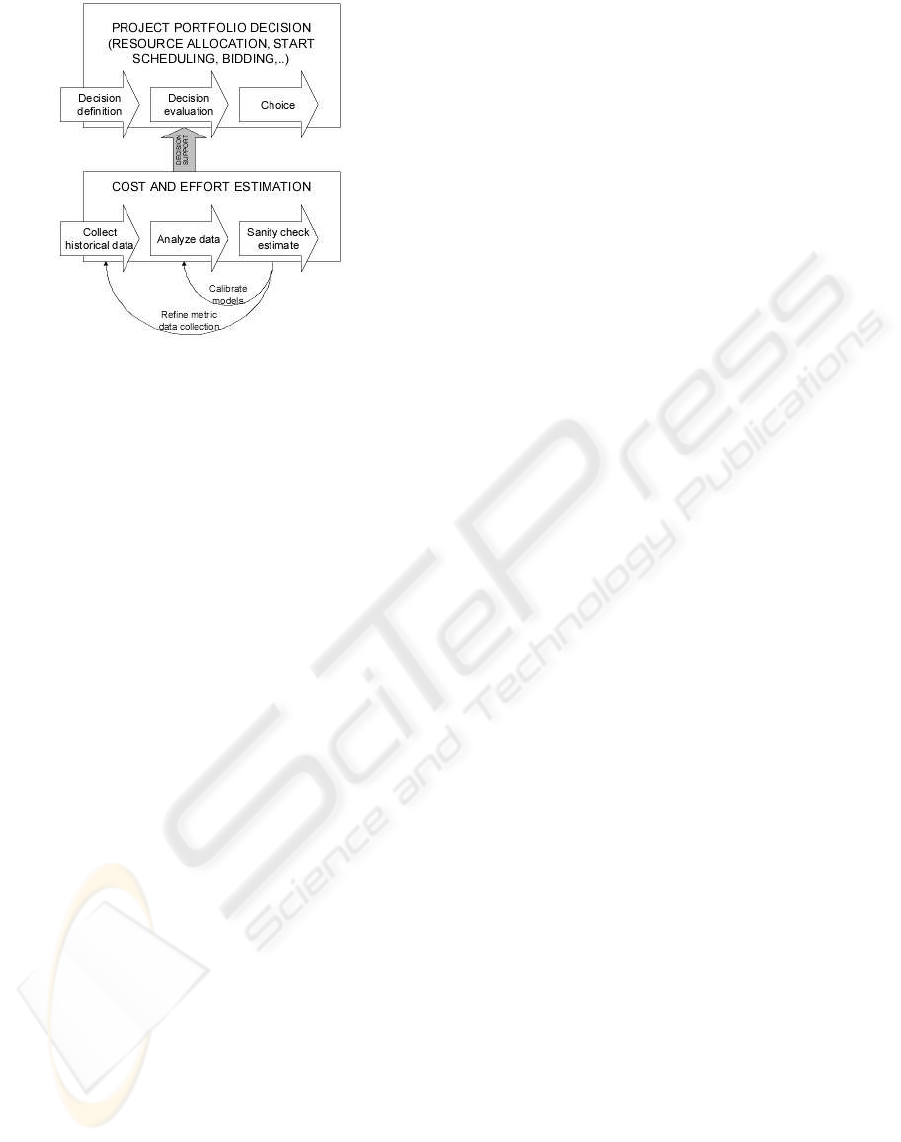
Figure 1: Estimation in portfolio decision making
ods often provide little insight on why a specific es-
timate is proposed, which may be a reason for their
lack of acceptance.
The estimator’s performance and the acceptance
and transparency of the method or process are thus
elementary to achieve high-quality estimates. There-
fore, the presentation of the model and portfolio data
to the estimator becomes fundamental. Unfortunately,
people are generally not performing well at analyzing
typical raw project portfolio data—high-dimensional
data sets—, due to the high search effort to link the
data items literally spread out in a spreadsheet for-
mat. According to (Robinson and Shapcott, 2002),
the assimilation of such information is not intuitive
while visualization aids the understanding. Accord-
ing to (Larkin and Simon, 1987), features are often
more easily extracted from diagrams than from tab-
ular or sentential representations, because some dia-
gram types can group together related concepts, while
tabular representations may store related items in sep-
arate areas, resulting in higher search efforts for link-
ing concepts.
Standard methods to handle such high-dimensional
data (like regression analysis or traditional analogy-
based approaches) propose estimates, but it is difficult
to understand if the result can be trusted—estimators
do not know how confident they can be with an esti-
mate proposal.
To overcome these fundamental analysis and
recognition difficulties, this paper aims at applying
advanced visualization methods to project portfolio
data. Multidimensional scaling methods are applied
to visualize high-dimensional data in two or three
dimensions; this way, the project portfolio data be-
comes understandable as the data is clustered visu-
ally, yielding an immediate aggregate overview of the
portfolio. The visualization relies on the concept of
similaritiy or analogy between projects, which can
be expressed using similarity (or dissimilarity) val-
ues between the n projects—n(n − 1)/2 values in the
symmetric case—, or Minkowski distance functions
on the projects’ features, i. e., the data dimensions.
This paper proposes an MDS-based user interface
to high-dimensional project portfolio data to support
software cost estimation. It applies this approach to
several real-world industry project portfolio data sets
and it quantifies the MDS approximation quality. Fi-
nally, it outlines promising benefits by referring to vi-
sualized project portfolio properties.
This approach should give estimators an intuitive
insight into portfolio data and exploit human cogni-
tion and pattern processing, thus achieving an effec-
tive, efficient and accepted estimation method, as well
as a better understanding of the correlation between
data characteristics and estimation methods’ accura-
cies.
• People can immediately assess the structure of
portfolio data, especially the clusters of similar
projects—this eases identification of outliers or un-
usual project behavior and allows for higher esti-
mation accuracy and reliability. In addition, an es-
timate’s confidence can easily be determined, for
example, when the project to be estimated is sim-
ilar to a large, dense cluster of projects perform-
ing similarly the estimator can be confident with an
analogy-based estimate proposal.
• The method is visual, the mathematical model
transparent, the process fast and easy-to-learn—
this should guarantee high acceptance and low es-
timation effort. The interactive playing with the
data set—i. e., choosing subsets of the data dimen-
sions, zooming in on particular interesting project
clusters—will enhance portfolio understanding and
influence portfolio measurement.
More strictly, this papers outlines expected benefits
in the areas of model transparency, portfolio overview
and understanding, selection of methodology, oper-
ational data handling, and estimation confidence as-
sessment.
Section 2 refers to related work in the areas of cost
estimation and MDS. Section 3 outlines the MDS ap-
proach and some quantitative criteria for assessing
the approximation quality. Section 4 applies MDS to
some real-world industrial project portfolio data sets.
Section 5 discusses the potential benefits of the pro-
posed visualization in the area of software cost esti-
mation. Section 6 gives an outlook on further research
directions in this field.
ICEIS 2004 - ARTIFICIAL INTELLIGENCE AND DECISION SUPPORT SYSTEMS
62

2 RELATED WORK
Different approaches to software effort prediction
have been proposed—algorithmic models like CO-
COMO 2 have been proposed by (Boehm, 1981), neu-
ral networks are used by (Boetticher, 2001), other
methods rely on regression analysis (e.g., (Schroeder
et al., 1986)).
Several studies compare the different approaches’
performance. (Kemerer, 1987) reports potentially
high error rates for COCOMO of up to 600 percent.
(Briand et al., 2000) compare different cost estima-
tion techniques. The results illustrate the importance
of defining appropriate similarity measures—without
them the analogy method is outperformed by other
methods. (Wieczorek and Ruhe, 2002) have investi-
gated the question whether multi-organizational data
is of more value to software project cost estimation
than company-specific data. Different methods like
analogy, ordinary least squares (OLS) regression, and
analysis of variance between groups (ANOVA) were
used to predict costs for a large portfolio of multi-
organizational project data. Results showed that if
a company’s project portfolio contains homogenous
data, more accurate results can be achieved by ana-
lyzing the company’s own data than by using large
portfolios from external sources.
(Shepperd and Schofield, 1997) compare analogy-
based approaches to regression analysis. Estimation
results for regression methods and analogy are com-
pared using a jack-knifing approach: one project is
taken from the portfolio, its effort is predicted based
on the remaining data, then the predicted effort is
compared to the project’s real effort; this is repeated
for all projects. The result of this experiment was
that analogy outperforms regression in most circum-
stances.
(Myrtveit and Stensrud, 1999), however, come to a
different conclusion. The authors design an environ-
ment where experienced and less experienced estima-
tors have to estimate project effort using regression
analysis or an analogy-based approach. A main result
is that both regression and analogy can substantially
improve an estimator’s performance, but that regres-
sion analysis is not outperformed by analogy.
Several publications point out the importance of
graphical representations in data mining environ-
ments (Thearling, 2001). According to (Robinson
and Shapcott, 2002) the assimilation of unprepared,
tabular information is not intuitive and visualization
therefore aids the understanding and the extraction of
features. According to (Larkin and Simon, 1987) cer-
tain features are more easily extracted from diagrams
than from tabular or sentential representations as dia-
grams can group together related concepts more eas-
ily than tabular representations. Tables may store re-
lated items in separate areas, which results in higher
search effort to link concepts.
Joseph B. Kruskal, a psychometrist, was one of the
first to work with MDS and authored many of the
early publications (Kruskal, 1964a; Kruskal, 1964b;
Kruskal and Wish, 1978). (Leeuw, 2001) offers a
general introduction to MDS. Application fields for
MDS, the different types of MDS, the different loss
functions and algorithms are presented along with ex-
amples to illustrate the theoretical information. An-
other introductions to MDS is given (Borg and Groe-
nen, 1996).
MDS is used in a wide field of science disciplines.
(Coxon and Davies, 1982) present a collection with
many of the classical MDS papers. (Clouse and Cot-
trell, 1996) apply MDS methods to the field of infor-
mation retrieval. (Goodhill et al., 1995) use MDS for
understanding brain connectivity.
Finally, early research results (Auer et al., 2003) in-
dicate the feasibility of the proposed approach for sev-
eral portfolio decisions and point out specific appli-
cations, especially cost estimation and portfolio stan-
dard compliance visualization.
3 VISUALIZING
HIGH-DIMENSIONAL DATA
This section sums up the method of MDS and ex-
plains quantitative and graphical criteria for assessing
its approximation quality.
MDS is a method to transform high-dimensional
data to lower dimensions—usually in order to visu-
alize it (e. g., with 2D-charts). MDS is based on
the analogy or similarity of the visualized entities—
in this case, software projects—, which are described
as a vector of attributes or features. Originating from
mathematical methods in psychology, MDS is gain-
ing popularity in different areas such as medicine and
knowledge management. We describe the procedure
of preparing portfolio data, as well as an MDS tool in
(Auer et al., 2003).
In particular, MDS offers several advantages over
other multivariate statistical methods, as it (i) sup-
ports non-continuous, i.e., ordinal, data, (ii) allows
for missing values, and (iii) makes no assumptions on
the underlying data’s distribution. These properties
match typical properties of real-world data sets well.
The remaining section describes the following
steps in applying MDS:
1. Prepare the portfolio data by selecting or weight-
ing the data dimensions to cluster projects using the
relevant dimensions.
2. Compute project dissimilarities to provide the input
to the MDS visualization.
VISUALIZING SOFTWARE PROJECT ANALOGIES TO SUPPORT COST ESTIMATION
63

3. Visualize the dissimilarities using dedicated MDS
tools.
4. Quantitatively assess the approximation quality of
the MDS visualization and verify if the quality is
within the boundaries of the MDS literature.
Sets of objects—in this case, projects—are charac-
terized by the dissimilarities, i.e., distance-like quan-
tities. The dissimilarities are denoted as δ
ij
and are
usually defined in a n × n dissimilarity matrix. The
importance of a dissimilarity δ
ij
can be reflected by
its weight w
ij
. Distances in the lower-dimensional
space R
m
are denoted as d
ij
(X), with the configura-
tion X representing the m coordinates of n entities in
the m-dimensional space.
In order to compute the project dissimilatities, usu-
ally the Euclidean distance function is applied to two
projects’ features, where the feature values are first
normilized to [0 − 1], and w
ij
= 1 (Note: in our case
the features used to calculate the dissimilarity did not
include the feature “effort”; this so-called target fea-
ture is depicted on the resulting MDS visualization).
However, each feature or dimension would have the
same impact on the dissimilarity, which is unlikely.
One approach to weight the dimensions is to use a
brute force approach to weigth all dimension combi-
nations and to assess each combinaion’s mean magni-
tude of relative error (MMRE) value. A special case
is weighting all combinations with 0 and 1, which is
equivalent of selecting dimensions.
After selecting the dimensions’ weights, the dis-
similarity matrix can be computed using the Eu-
clidean distance on the project dimensions, yielding
the dissimilarity matrix. Then, tools are used to it-
eratively transform this matrix to coordinates in the
lower-dimensional space R
m
.
In order to assess the approximation quality of an
MDS visualization, a so-called stress value can be
used. It compared the values of the original dissim-
ilarities with the lower-dimensional distances to as-
sess the degree, to which the new distances repre-
sent the original analogies or similarities in the high-
dimensional feature space.
One example of a stress value function is Kruskal’s
stress-1; it gives the quality of the representation
based on the square root of the squared errors of the
representation compared with the disparities, divided
by the sum of the squared distances on the represen-
tation:
σ
1
=
s
P
i<j
w
ij
(δ
ij
− d
ij
)
2
P
i<j
w
ij
d
2
ij
There is no general agreement on which value is
acceptable; different authors define their own crite-
ria. According to Kruskal’s rule of thumb (Kruskal,
1964a), a Kruskal stress-1 value of 0.2 reflects a poor
fit between the distances and the dissimilarities, while
a value of 0.1 is considered fair, 0.05 is good, 0.025
excellent and 0 is perfect.
A more detailed analysis is possible with Shepard
diagrams; they visualize original project dissimilar-
ities vs. distances in the two-dimensional graphical
representation. Good approximations therefore pro-
duce almost linearly aligned data points.
4 INDUSTRIAL PORTFOLIO
DATA
In this section several high-dimensional real-world
project portfolio data sets available in the public do-
main are visualized two-dimensionally using MDS. In
addition, the approximation quality is assessed quan-
titatively and graphically. Please refer to the refer-
ences given in table 1 for the original data sources.
Data sets could have been visualized using all the
given dimensions; however, several dimensions con-
tribute little or nothing to the clustering of projects.
In the first step, the original number of dimensions
was thus reduced by performing a brute-force search
to achieve the optimal subset of dimensions. For this
task we used the tool ArchANGEL
1
to select the sub-
set of dimensions that minimizes the mean magnitude
of relative error (MMRE) measure in a jack-knifing
analysis. The MMRE value indicates how good an es-
timation approach is likely to perform in terms of ac-
curacy or error percentage of estimated effort, in our
case, ArchANGEL’s analogy-based approach. How-
ever, this error value should rather be used to compare
different approaches applied to the same data set, as it
highly depends on the underlying portfolio data prop-
erties. Note, that the brute-force approach searches all
combinations of dimensions by weighting them with
either 0 or 1. A better result could be achieved by us-
ing a larger set of weight factors, for example (0, .25,
0.5, 0.75, 1).
In addition, dimensions describing project length
or duration were excluded as these values are unlikely
to be known at time of estimation.
Table 1 gives an overview of the data sets, giv-
ing the original number of data dimensions (includ-
ing the feature “effort”), the optimal number of data
dimensions according to ArchANGEL’s procedure of
searching all possible combinations of dimensions
(excluding the feature “effort”), and the resulting
MMRE value.
In the second step, the standard Euclidean distance
function was applied to the normalized values of the
selected features to calculate the dissimilarity matrix.
This was performed by a custom spreadsheet macro.
1
http://dec.bmth.ac.uk/ESERG/ANGEL.
ICEIS 2004 - ARTIFICIAL INTELLIGENCE AND DECISION SUPPORT SYSTEMS
64
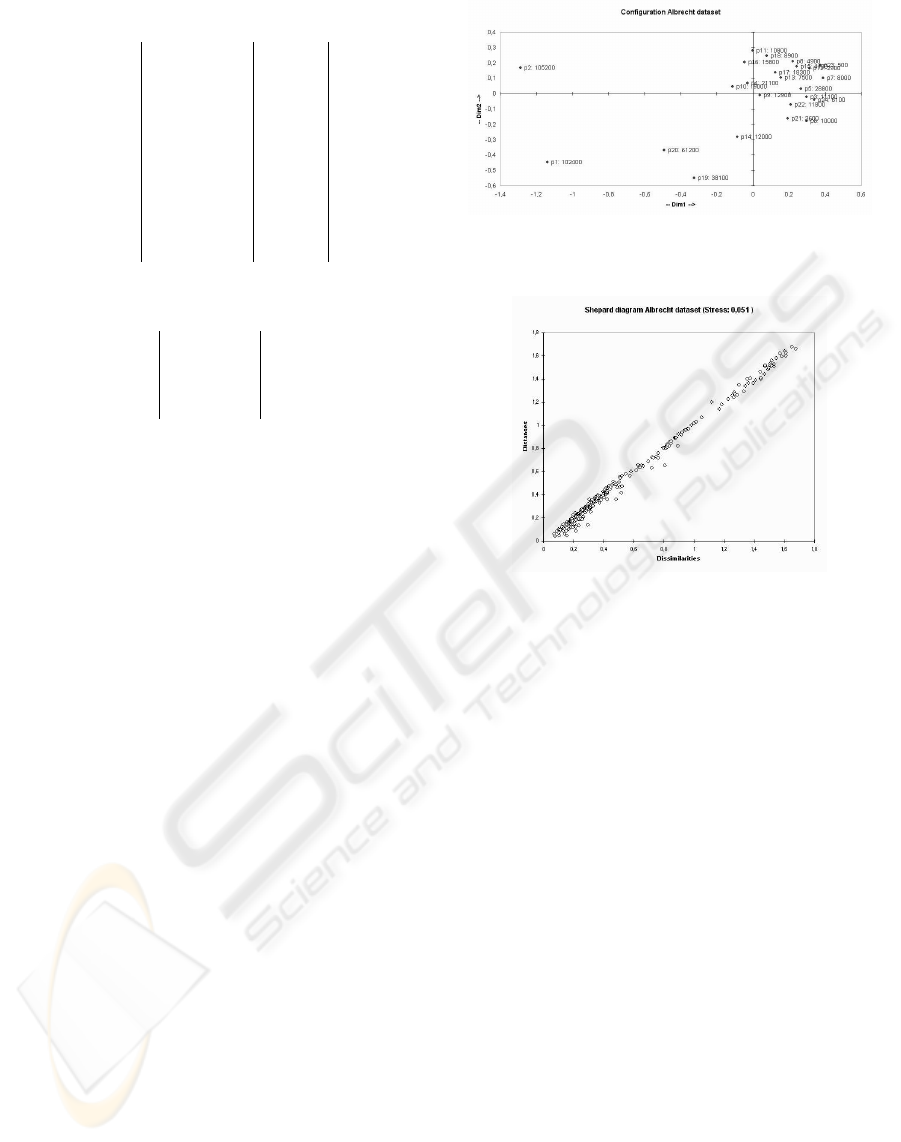
Table 1: Visualized data sets
Data set Dimensions Subset MMRE
Albrecht
(Albrecht and Gaffney, 1983)
5 4 0,635
Desharnais 1
(Desharnais, 1989)
9 1 0,368
Desharnais 2
(Desharnais, 1989)
9 3 0,388
Desharnais 3
(Desharnais, 1989)
9 3 0,343
Kemerer
(Kemerer, 1987)
2 1 0,676
Table 2: Stress values
Data set 2D stress 3D stress
Albrecht
0.051 0.019
Desharnais 2
0.007 -
Desharnais 3 0.021 -
In step 3, the dissimilarities were visualized using
MDS (Note: only if the number of selected dimen-
sions was greater than 2). In this paper Addinsoft’s
Excel plug-in XLSTAT 6.1 and Miner3D were used.
Finally, table 2 lists the stress values of the data
sets with more than two dimensions to be visualized.
According to Kruskal’s rule of thumb (see previous
section), the given visualizations are between good
and excellent with respect to the approximation to the
original data; the Shepard diagrams support this im-
pression.
Figure 2 depicts the MDS visualization of Al-
brecht’s data set. As it can be seen, several projects
(depicted in the left-hand part of the graph) are fairly
different, thus distant, from the other projects. These
projects (1, 2, 20) also have the highest effort values
of the portfolio. The project arranged more densely
on the graph’s right-hand part are more similar to each
other, but still contain several outliers with respect to
their effort value, for example, project 5.
Figure 3 displays the Shepard diagram for this
MDS visualization. It seems to support the impres-
sion of an good overall approximation quality.
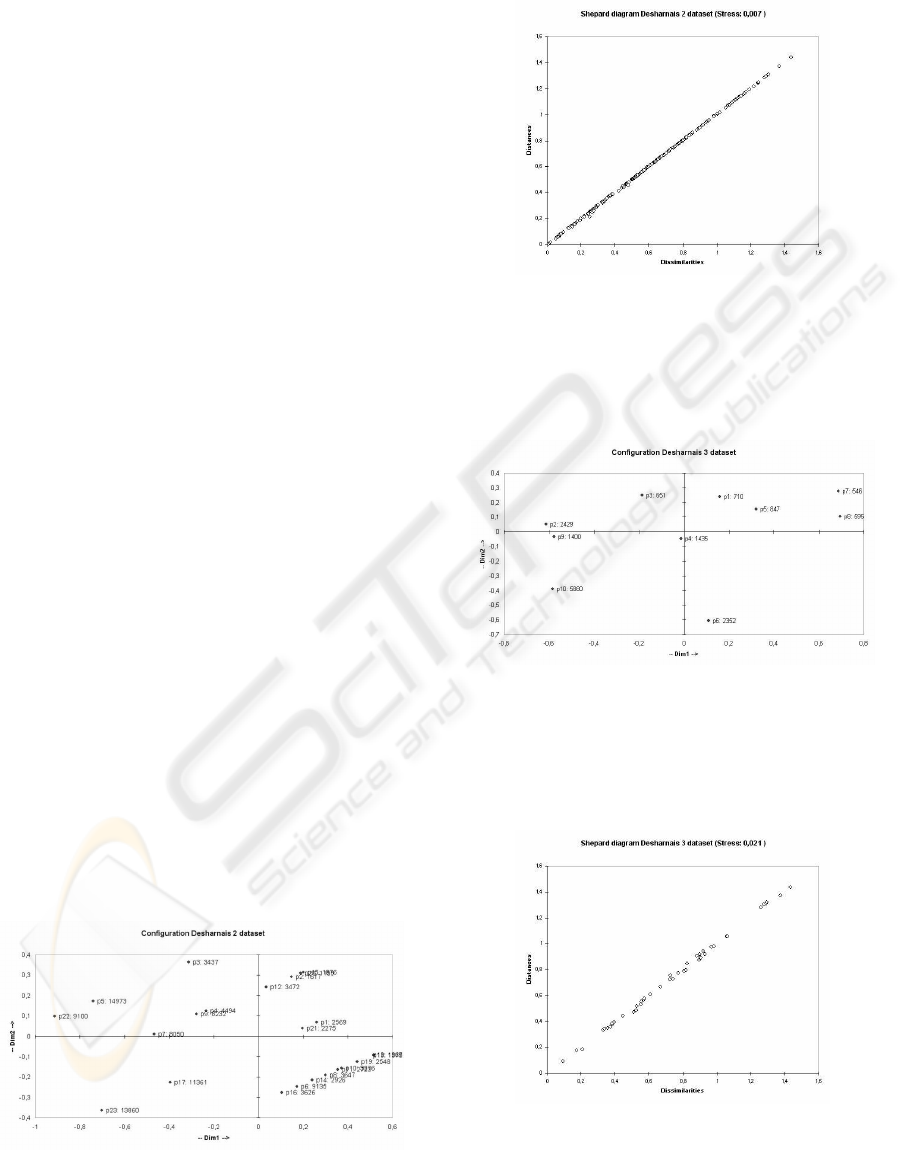
Further figures (MDS visualizations of the Deshar-
nais 2 and 3 data sets in tables 4 and 6; the respective
Shepard diagrams in tables 5 and 7) are given in the
appendix.
It is important to point out some limitations of
the analogy-based approach and its visualization us-
ing MDS. First, the collected portfolio measurement
data should be consistent. If collected by different
persons using different procedures, data quality can
be compromised; analysis relying on it has to fail.
In our case, existing portfolio data sets were visual-
ized, with little context information available about
the data quality. Applying analogy-based approaches
Figure 2: 2D MDS visualization of Albrecht data
Figure 3: Shepard diagram of Albrecht data set
and MDS in an industrial environment would require
careful data collection and verification procedures to
ensure data quality.
Furthermore, some portfolios might not be suited
for analogy-based analysis, especially if they com-
prise of mostly innovative projects, involving mainly
new, unknown technology—the concept on analogy is
simply not well-suited in environments dealing with
singular projects.
5 DISCUSSION AND BENEFITS
Although there are many different approaches to sup-
port people in estimating software project efforts
(e.g., formal models like COCOMO 2, neural net-
works, regression analysis, etc.), few of them are ac-
tually applied in typical industrial environments. Sev-
eral reasons can be identified—software projects typi-
cally involve substantial parts with new and unknown
technologies and tools; often, the relevant constraints
to a development project is quality rather than effort,
and deadlines can be influenced by corporate politics
as much as by precise estimations; not to forget, es-
timation needs to rely on measurement data which is
costly and time-consuming to obtain.
VISUALIZING SOFTWARE PROJECT ANALOGIES TO SUPPORT COST ESTIMATION
65

However, one important reason is certainly that
many proposed methods lack of transparency and ac-
cessibility. Especially methods like neural networks
give little insight on how they reach a certain estimate
and do little to foster portfolio measurement data un-
derstanding.
But even seemingly simpler methods like analogy-
based approaches can be improved in providing hu-
man estimators with context information. Analogy-
based methods rely on similarities between projects
expressed as distances between high-dimensional fea-
tures or attribute sets. Humans, however, are not
particularly good at analyzing high-dimensional data
without the aid of visualization techniques. Thus,
simple tools supporting analogy-based methods like
spreadsheet applications are severely delimited. Even
dedicated tools like ArchANGEL offer only slightly
better results—e.g., they relieve the burden of time-
consuming and error-prone tasks like normalizing the
measurement data—but their result is again a list of n
projects/feature sets. The degree of the projects’ sim-
ilarities, as well as the structure of the project clusters
and thus valuable addition information is not given.
This paper proposed to enhance analogy-based ap-
proaches by visualizing high-dimensional portfolio
measurement data with multidimensional scaling. In
many circumstances, this is a feasible method to re-
produce high-dimensional feature sets graphically;
the approximation quality can be measured by the
stress value. Data sets with 6 and more dimensions
were visualized successfully within reasonable stress
boundaries given in (Kruskal, 1964a).
The benefits of visualizing portfolio data are mani-
fold:
• Transparency. The proposed method is straight-
forward and transparent; even estimators not ac-
quainted with it immediately grasp the process and
the visualizations’ implications. We are aware of
several instances in industrial environments where
estimation was hindered by its relation to software
measurement being perceived differently by var-
ious stakeholders—by applying MDS to multidi-
mensional data, the connection between metrics
and result becomes transparent, and measurement
procedures are easier to agree upon. Finally, as no
model configuration or difficult-to-reproduce algo-
rithms are involved, users are far more likely to ac-
cept and apply this method in the first place.
• Overview. MDS gives the user a visualization with
a high information density. It is therefore easy to
gain a fast overview of a project portfolio’s proper-
ties, for example, its project cluster structures and
sizes. If based on the same metrics, the method al-
lows for a fast comparison of different portfolios—
the portfolios’ entropy properties are visualized in
a highly intuitive way.
For example, while the projects in the Desharnais
2 data set form some clusters (see figure 4), the
projects in the Desharnais 3 data set are less cou-
pled.
• Methodology. Several publications comparing es-
timation methods indicate that no method can gen-
erally be regarded as the best one; a method’s per-
formance depends highly on the underlying portfo-
lio data properties. Visualizing the data can help es-
timators to assess whether it is reasonable to apply
analogy-based methods in a specific circumstance
or whether a particular project cluster structure is
unlikely to yield high-quality analogy-based esti-
mates. This could happen if the project to be es-
timated is distant to relevant project clusters, if the
nearest cluster is very small, or if the effort variance
in the nearest cluster is too high. In that case, other
methods, like regression analysis, could be used to
overrule the analogy-based estimate.
For example, projects 6 and 10 in the Desharnais
3 data set (see figure 6) should probably not be es-
timated using the analogy-based approach as they
are distant to the rest of the projects.
• Operation. The task of analyzing analogies in
portfolio data involves identifying similar project
feature sets. This can be performed fast and re-
liably on a visual representation of the data, espe-
cially as the criteria are varying (e.g., in some cases
a larger cluster could be used as basis for the es-
timate if it is dense, while in other cases instead
of a fixed number of similar projects only one or
few should be used due to a portfolio’s high en-
tropy). Outliers, which can degrade the estimate’s
quality considerably, can be identified and removed
easily—both projects that are distant to all other
projects, and projects that are within a cluster but
behave differently with regard to the related effort
value. It would be possible to enhance conven-
tional tools to perform similar tasks, for example,
by making them configurable using threshold val-
ues for distances and cluster homogeneity, but this
would make the tool far less transparent and acces-
sible.
For example, project 5 in the Albrecht data set (see
figure 2) should probably not be allowed to influ-
ence estimates of nearby projects—its high effort
value should first be analyzed to decide if this is a
valid project to compare other projects to.
• Confidence. Finally, the benefits mentioned above
(method transparency and user acceptance; coarse
portfolio overview and understanding; assessment
of a methodology’s suitability; easy data selection
and manipulation) contribute to increase the confi-
dence in a particular estimation. Usually, estima-
tion methods were compared using accuracy and
reliability measures; they did not take into account
ICEIS 2004 - ARTIFICIAL INTELLIGENCE AND DECISION SUPPORT SYSTEMS
66

the confidence an estimator had in its estimate at
the time of estimation. The transparency of the pro-
posed visual support is likely to increase this con-
fidence, which should allow—in many cases—to
agree on more narrow estimates.
For example, the lower right project cluster of the
Desharnais 2 data set (see figure 4) seems—despite
some outliers—to increase confidence in an effort
estimate range between 2500 and 3500.
6 CONCLUSION AND FURTHER
RESEARCH
MDS provides a transparent method to visualize high-
dimensional data and to analyze analogies or similari-
ties intuitively. In this paper we propose portfolio data
preparation steps for an MDS visualization of high-
dimensional project portfolio data, we visualize sev-
eral real-world data sets and assess the achieved ap-
proximation quality, and we outline several benefits
of the approach referring to concrete portfolio prop-
erties.
Main findings are that the approximation quality is
within reasonable boundaries given in the MDS liter-
ature, and that cost estimation can indeed benefit sub-
stantially from MDS—specific benefits include better
transparency of the analogy-based approach, a better
understanding of a portfolio’s data properties, thus,
easier assessment of the validity of analogy-based ap-
proaches in specific circumstances, easier data han-
dling and project selection, and finally, higher confi-
dence in estimates.
However, many aspects have to be refined and will
be addressed in future research efforts. First, weight-
ing portfolio data dimensions using brute force could
be extended from the current appoach to fine-grained
weight levels. Second, user interface issues will be
addressed to facilitate cluster analysis, for example,
providing easy access to project cluster mean and
variance values. Finally, quantitative measures for es-
timation confidence will be defined to assess the value
of the visualization for the estimators, for instance, by
weighting estimates’ accuracies (post-project) with
the estimators’ corresponding confidence values in
these estimates (pre-project).
To sum up, this and future research aims at support-
ing decision makers in the crucial task of cost estima-
tion, by providing transparent and intuitive means to
analyze portfolio data and assess estimates’ plausibil-
ity.
REFERENCES
Agarwal, R., Kumar, M., Yogesh, Mallick, S., Bharadwaj,
R. M., and Anantwar, D. (2001). Estimating software
projects. Software Engineering Notes, 26(4):60–7.
Albrecht, A. J. and Gaffney, S. H. (1983). Software func-
tion, source lines of code and development effort pre-
diction: A software science validation. IEEE Trans-
actions of Software Engineering, 9(6):639–48.
Auer, M., Graser, B., and Biffl, S. (2003). An approach to
visualizing empirical software project portfolio data
using multidimensional scaling. In Proceedings of the
IEEE International Conference on Information Reuse
and Integration Paper Notification (IRI 2003).
Boehm, B. W. (1981). Software Engineering Economics.
Prentice Hall.
Boetticher, G. D. (2001). Using machine learning to predict
project effort: Empirical case studies in data-starved
domains. In Proceedings of the Model Based Require-
ments Workshop, pages 17–24.
Borg, I. and Groenen, P. (1996). Modern Multidimensional
Scaling: Theory and Applications. Springer.
Briand, L. C., Langley, T., and Wieczorek, I. (2000). A
replicated assessment and comparison of common
software cost modeling techniques. In Proceedings
of the 22nd International Conference on Software En-
gineering (ICSE’00), pages 4–11, Limerick, Ireland.
Clouse, D. and Cottrell, G. (1996). Discrete multi-
dimensional scaling. In Cottrell, G., editor, Proceed-
ings of the 18th Annual Conference of the Cognitive
Science Society (COGSCI’96), pages 290–4.
Conte, S. D., Dunsmore, H. E., and Shen, V. Y. (1986).
Software Engineering Metrics and Models. Ben-
jamin/Cummings.
Coxon, A. and Davies, P. (1982). Key Texts in Multidimen-
sional Scaling. Heinemann.
Desharnais, J. M. (1989). Analyse statistique de la produc-
tivitie des projets informatique a partie de la technique
des point des fonction. Master’s thesis, Univ. of Mon-
treal.
Goodhill, G., Simmen, M., and Willshaw, D. (1995). An
evaluation of the use of multidimensional scaling
for understanding brain connectivity. Philosophical
Transactions of the Royal Society, B 348:265–80.
Hihn, J. and Habib-Agahi, H. (1991). Cost estimation of
software intensive projects: A survey of current prac-
tices. In Proceedings of the 13th International Confer-
ence on Software Engineering (ICSE’91), pages 276–
87.
Jones, C. (1998). Estimating Software Costs. McGraw-Hill.
Kemerer, C. (1987). An empirical validation of software
cost estimation models. Communications of the ACM
(May), pages 416–29.
Kruskal, J. B. (1964a). Multidimensional scaling by opti-
mizing goodness of fit to a nonmetric hypothesis. Psy-
chometrika, 29(1):1–27.
VISUALIZING SOFTWARE PROJECT ANALOGIES TO SUPPORT COST ESTIMATION
67
Kruskal, J. B. (1964b). Nonmetric multidimensional scal-
ing: A numerical method. Psychometrika, 29(2):115–
29.
Kruskal, J. B. and Wish, M. (1978). Multidimensional Scal-
ing. Sage Publications.
Larkin, J. and Simon, H. (1987). Why a diagram is (some-
times) worth ten thousand words. Cognitive Science,
11:65–99.
Leeuw, J. D. (2001). Multidimensional scaling. In Inter-
national Encyclopedia of the Social and Behavioral
Sciences. Elsevier.
Myrtveit, I. and Stensrud, E. (1999). A controlled experi-
ment to assess the benefits of estimating with analogy
and regression models. IEEE Transactions on Soft-
ware Engineering, 25(4):510–25.
Robinson, N. and Shapcott, M. (2002). Data mining in-
formation visualisation beyond charts and graphs. In
Proceedings of the Sixth International Conference on
Information Visualisation (IV’02), pages 577–83.
Schroeder, L., Sjoquist, D., and Stephan, P. (1986). Regres-
sion Analysis: An Introductory Guide. SagePublica-
tions.
Shepperd, M. and Schofield, C. (1997). Estimating software
project effort using analogies. IEEE Transactions on
Software Engineering, 23(12):736–43.
Stensrud, E. and Myrtveit, I. (1998). Human performance
estimating with analogy and regression models: An
empirical validation. In Proceedings of the Fifth In-
ternational Symposium on Software Metrics (MET-
RICS’98), pages 205–13.
Thearling, K. (2001). Visualising data mining models. In
Information Visualisation in Data Mining and Knowl-
edge Discovery. Morgan Kaufman.
Wieczorek, I. and Ruhe, M. (2002). How valuable is
company-specific data compared to multi-company
data for software cost estimation? In Proceedings of
the Eighth International Symposium on Software Met-
rics (METRICS’02), pages 237–48.
Figure 4: 2D MDS visualization of Desharnais 2 data
Figure 5: Shepard diagram of Desharnais 2 data set
Figure 6: 2D MDS visualization of Desharnais 3 data
Figure 7: Shepard diagram of Desharnais 3 data set
ICEIS 2004 - ARTIFICIAL INTELLIGENCE AND DECISION SUPPORT SYSTEMS
68
