
Supporting the sky
Computer mediated co-operation to fly aircraft
E. Kesseler
NLR, P.O. Box 90502, 1006 BM Amsterdam, The Netherlands
Abstract. To fly aircraft many people from various organizations have to co-
operate. The justifiable strict safety requirements have led to very strict
allocation of responsibilities and corresponding separation of tasks. Over the
years every party has developed its own proprietary system. The resulting
patchwork of systems exhibits a slow response to the current market-driven
changes at increasingly unaffordable costs. In the general domain service-
driven network-centric solutions are used. To assess the feasibility of these
solutions for air transport a prototype for air transport has been realized.
For the prototype a multi national consortium has been established. Our
project experience yields some lessons learned about computer support to
facilitate such co-operation.
1 Introduction
Flying commercial air transport involves the cooperation of many people from
various organizations. Actors include airlines, charter operators, airports, passenger
security, air traffic management, ground handling, meteorological offices, aircraft
maintenance, etc. For each actor there may be a large number of organizations
fulfilling this activity. To illustrate the significant number of organizations involved,
IATA already represents 270 airlines and IACA another 36 with many airlines not
affiliated. For airports ACI bundles 554 organizations from 169 countries operating
over 1500 commercial airports. The current commercial fleet consists of 21551 jet
aircraft plus 13025 turbo-prop aircraft. The 41 European Civil Aviation Conference
(ECAC) member states each operate their own air traffic control organizations.
The various accidents in the early history of air transport, combined with the
continued high profile of current air transport mishaps, make ensuring the current
high levels of safety a prime concern for the survival of a viable air transport industry.
To ensure these safety levels, the various sectors of the industry each have
implemented self-improving safety systems. Due to historic reasons the systems of
e.g. pilots, air traffic management, passenger security, airport operations and aircraft
maintenance are independent. Most of these systems are national, based on very
generic international treaties, sometimes complemented by European regulations and
enforced by national legislation with their national interpretations. Each actor has a
dedicated system, optimized to support its activities. The result is a patchwork of
proprietary procedures and systems.
Over the decades air transport has shown significant long-term growth, despite its
Kesseler E. (2004).
Supporting the sky Computer mediated co-operation to fly aircraft.
In Proceedings of the 1st International Workshop on Computer Supported Activity Coordination, pages 51-60
DOI: 10.5220/0002676900510060
Copyright
c
SciTePress
cyclical nature. Each party deals individually with the various bottlenecks as they
manifested themselves, leading to ever more dedicated and locally optimized
solutions. The current patchwork of systems already can not cope with the current
levels of traffic for the high-density parts of the European airspace and major airports.
The many improvement ideas are all based on every actor being able to access and
share all relevant information. This allows optimization taking the constraints of other
actors into account. Table 1 lists the major integrated air traffic management concepts
of the last decade. When a concept has several phases, all have been included in Table
1, separated by slashes. The time-to-market, typically around a decade, indicates the
beginning of a transition period. Full deployment usually takes another decade. Even
in the fiercely competitive telecom industry deployment takes four to ten years for
infrastructure items, but for new services can come down to a few months [9]. With
the notable exception of EUROCONTROL’s
short-term CDM Airports, none of these
concepts have been implemented.
Table 1 Overview air traffic management concepts
Concept plus
originator
Year Time-to-market
(years)
# of services # services implemented
in 2004
ATLAS-
SUATMS EU
1993 12-17 5 None
Gate-to-gate
EUROCONTROL
1997 8/13/18 8/6/4 None
Free flight US 1998 4/7 5/3 None
DAG-TM FAA 1999 6 15 None
COOPATS
EUROCONTROL
2001 9/14 11/3 None
CDM Airports
EUROCONTROL
2002 3 13 12
APP
ACC
APP
ACC(s) ACC(s) ACC(s)
APP
IFPS IFPS IFPS
Flight
Events
ATM
Phase
Units and
Facilities
Involved
Data link
Services
Strategic
Planning
Pre-Tactical
Planning
Tactical
Planning
Ground
Movement
Climb-Out En-Route Arrival Post-Arrival
CFMU CFMU
ATM FMPs
AMCs
CFMU
FMPs
TWR
IFPS IFPS IFPS
FMPs FMPs FMPs
TWR
ACM
ACL
CAP
DCL
DSC
PPD
FLIPCY
DYNAV
D-FIS
COTRAC
SAP
ATSAW
COSEP
AUTOPS
Prof ile
Planned
Flight
Data
Day
Prior
Day of
Operation
Request
Start-Up
Take-Off Cruise Level
Parameter
from
Destination
Landing
4
4
4
4
4
4
4
4
4
4
4
4
4
4
4
4
4
4
4
4
4
4
4
4
4
4
4
4
4
4
4
4
4
4
4
4
4
4
4
4
4
4
4
4
4
4
4
4
4
4
4
4
4
4
4
4
4
4
4
4
4
4
4
4
4
4
4
4
4
4
4
4
4
4
4
4
4
4
4
4
4
4
4
4
4
4
4
4
4
4
4
4
4
4
4
4
4
4
4
4
EUROCONTROL
AMSTERDAM - LISBON
12345-7 1015 12 15 KL16 93
123456- 2035 22 35 KL16 97
10:15
12:15
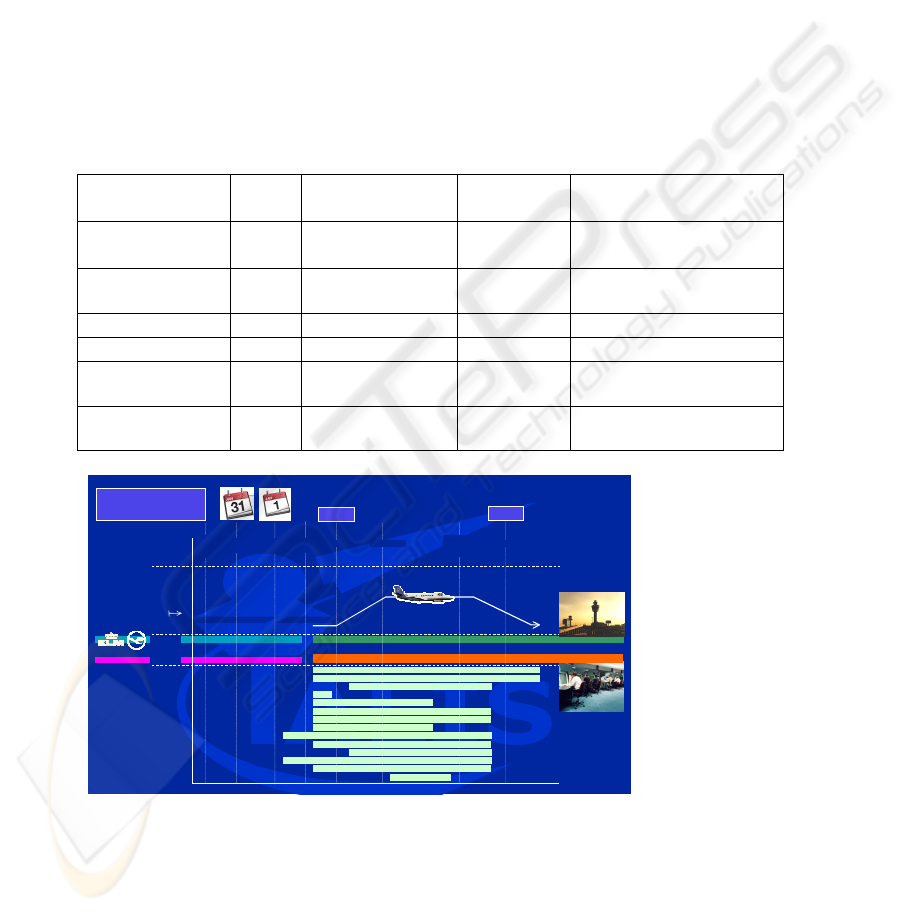
Fig. 1. Air transport services concept
Fig. 1 depicts the kind of concepts being considered, using EUROCONTROL’s
Co-operative Air Transport Services (COOPATS) [4] as an example. Some services
related to flight planning by the airline start well before the preparation of the actual
flight. The required services change during the execution of the flight.
52
General domain information
technology can integrate the
systems of the various
stakeholders involved into a
network-centric system-of-
systems, a virtual enterprise.
Such co-operation improves
the combined performance of
all stakeholders involved. In
various other domains, which
lack air transport’s safety
concerns, such improvements
have already been achieved.
The Total Information Sharing
for Pilot Situational
Awareness Enhanced by
Intelligent Systems (TALIS)
project [1], realizes a
prototype of such a
network-centric architecture.
Fig. 2. Conceptual overview of the TALIS network-centric architecture
. The completed prototype, consisting of the middleware and two sample
applications, demonstrates the technical feasibility of this network-centric approach.
Fig. 2 provides a conceptual overview of the prototype.
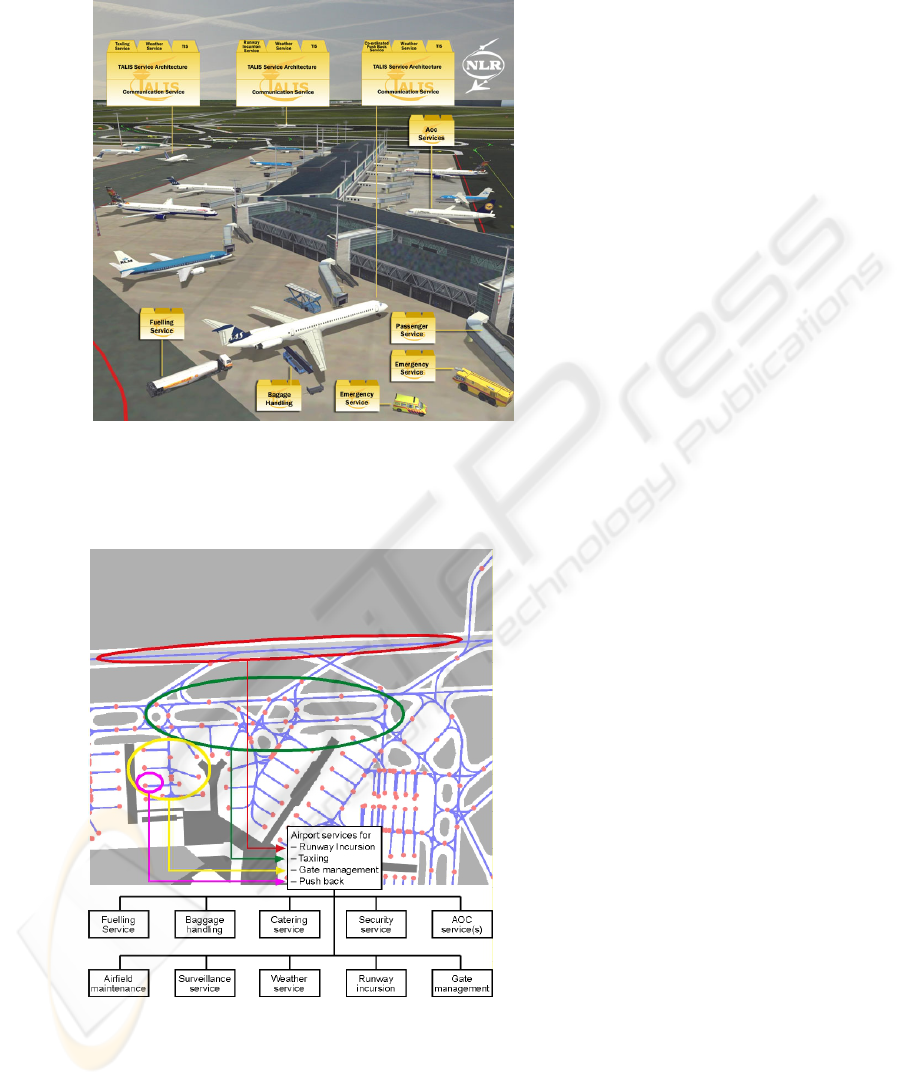
The network-centric architecture
supports services for all flight
phases. Fig. 3 demonstrates the
integration of various actors at
the airport. The pilot-oriented
sample service illustrates the
kind of optimisation that the
prototype aims to support.
Also at an airport the pilot
information-needs are flight-
phase dependent. A coordinated
pushback service will allow the
pilot to improve the reliability of
on-time pushback. For this the
pilot needs amalgamated
information from, e.g., fuelling
services, baggage-handling
services, catering services,
security services and Airline
Fig. 3. Pilot-oriented sample service
Operations Center (AOC) about transfer passengers. This pushback service
optimizes utilization of the taxiway linking the various gates and prevents aircraft
from blocking each other or ending up in the wrong take-off order. Subsequently
53
taxiing-services guide the aircraft to the correct runway, optimized for the other
airfield traffic, its departure timeslot and taking possibly adverse weather or airfield
maintenance restrictions into account. Finally, runway incursion services, using
surveillance services, improve the safety during take-off.
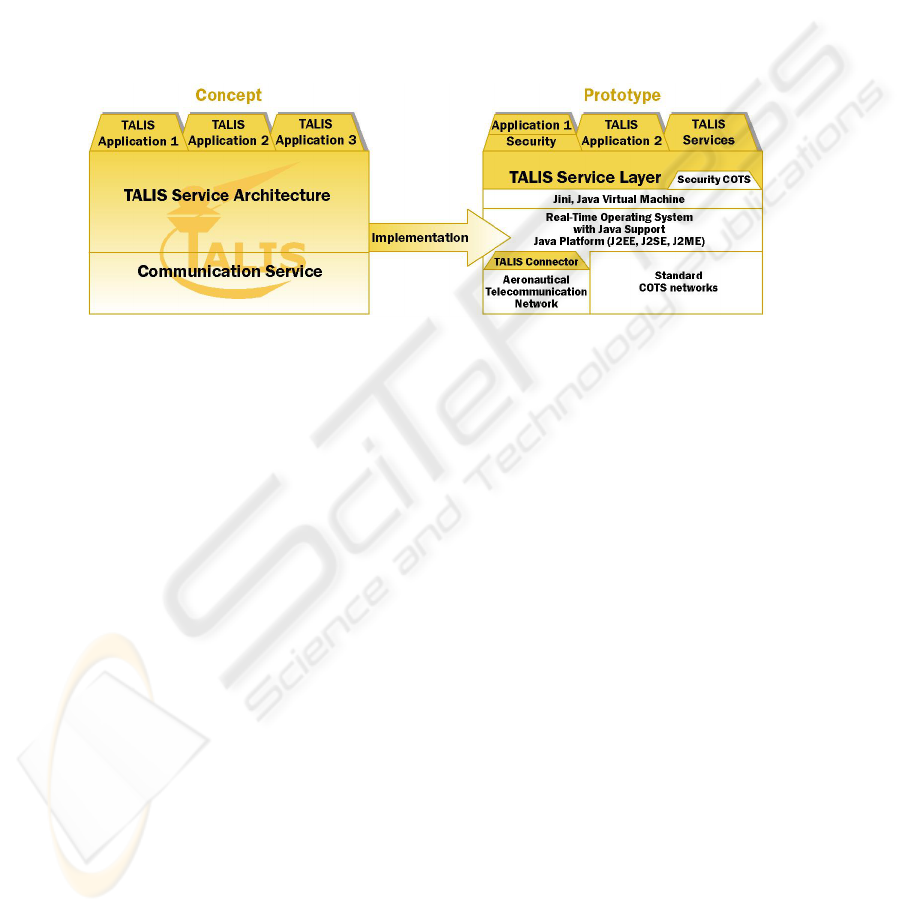
Fig. 4 shows how the prototyped network-centric architecture builds upon various
Commercial off-the-Shelf (COTS) components, which in turn support various
hardware platforms, from small mobile wireless equipment (Java Micro Edition,
J2ME) to standard PC-based hardware with standard communication (Java Enterprise
Edition, J2EE). The TALIS services, which enable the actual co-operation between
the users, will run on top of the prototyped architecture. Once a service is connected
to the network-centric architecture, all other services in the network can connect to it,
either to provide input or use the result.
Fig. 4. TALIS architecture overview
The TALIS prototype consists of four parts:
• The federated architecture (FAR) to implement the network-centric idea. The
FAR is denoted as TALIS service architecture in Fig. 2;
• Two application services to demonstrate the capabilities of the prototype
infrastructure. The first service (MET) provides pilots with in-flight weather
updates. Current weather information allows pilots to optimize their flight,
demonstrating tangible benefits, like shorter flights and fuel reduction to pilots
and airlines;
• Traffic Information Services (TIS), to provide the pilot with in-flight airport
information like runway-in-use, visibility etc. This service reduces voice
congestion on scarce frequencies and reduces pilot workload during a busy flight
phase.
During realization of the prototype, the activities to provide a portable
demonstration platform for dissemination purposes were formalized into the fourth
part called the Verification Platform (VPR).
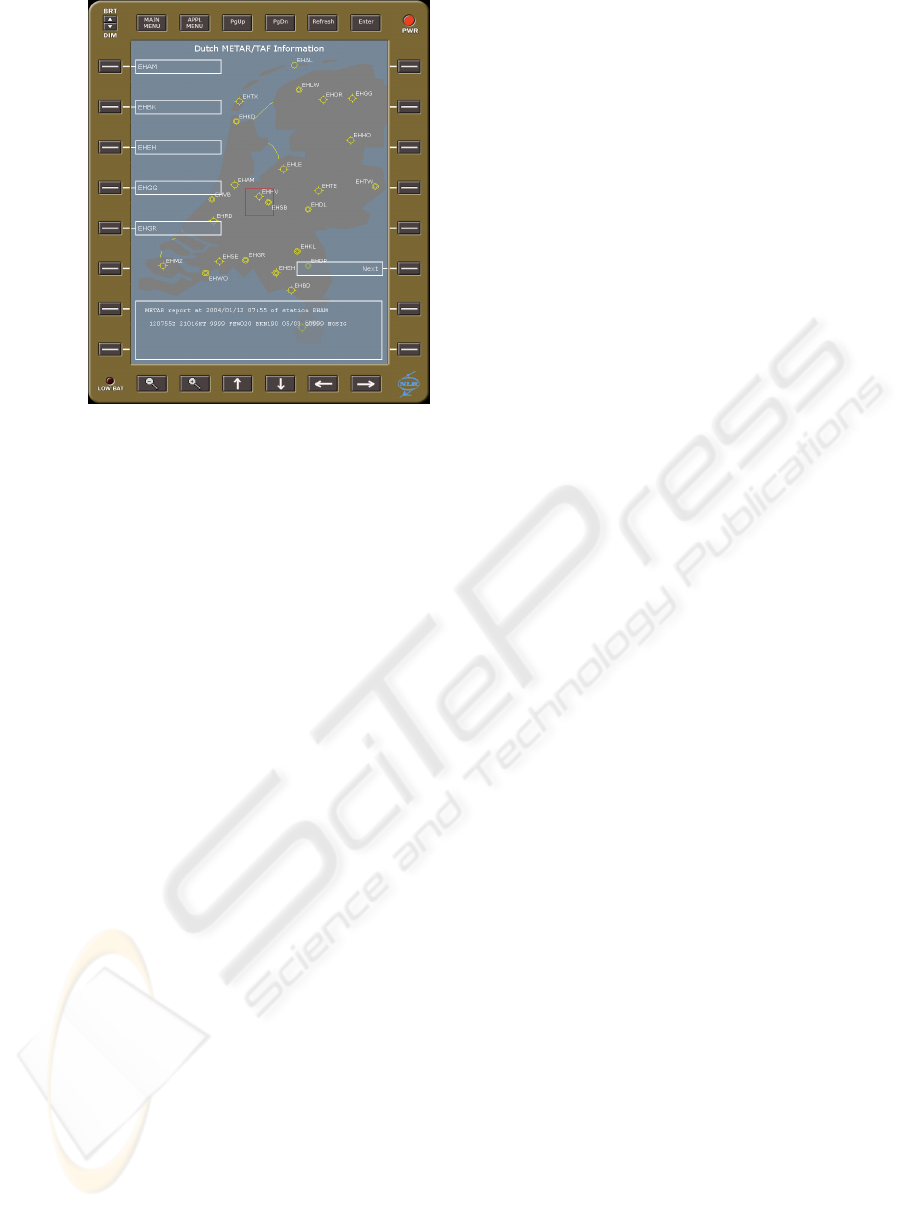
Fig. 5 shows the realization of the airborne part of the MET application. To improve
pilot acceptability, the display layout closely resembles other cockpit displays. The
left column of buttons lists available airports based on current aircraft position. The
text box at the bottom provides meteorological information for the selected airport in
the compact format pilots are familiar with. To illustrate the independence of the
actors and their systems, the airport is referred to as EHAM by pilots, Amsterdam by
passengers, AMS on luggage labels, Schiphol for local passengers and the
meteorological office and AAS for the gate handler.
54
The next section provides the users’
response from every type of actor. The
subsequent section analyses the
computer-supported process of the multi-
national consortium that realized the
prototype.
Fig. 5 TALIS workbench MET application, airborne side
2 User response
To assess whether the air transport community is open to network-driven services, for
at least two organizations of each type of actor presentations/demonstrations were
given, followed by interviews. To prevent a national bias, a total of 13 actors from six
European countries have been consulted. All recognize the problem and acknowledge
the need to optimize their co-operation using computer based information exchange.
As a monopolistic service by nature, air traffic management service providers have
no problem with providing their information. They express a reactive attitude: their
customers, i.e. the airlines, have to ask for it first. As a new system for an air traffic
management center typically takes at least a decade to realize, their time-to-market is
in multiple years.
The current challenge for airports is to keep the data obtained from the various
actors consistent and base them on uniformly defined moments in the aircraft turn
around processes. Services based on these data are not yet within their time horizon.
Being closer to the customer their time-to-market is several months to year(s).
The regulator’s role is to approve those operational applications that could infringe
the safety. They express interest in the new technology but will only take actions once
a product is being submitted for certification. In the European Union the regulatory
scene is changing due to evolution from National regulators and Joint Aviation
Authorities to the European Aviation Safety agency (EASA) at European Union level,
temporarily reducing their available effort for new technologies. Unfortunately the
various proposed services need different types of certification [6].
Conventional airlines, due to the harsh economic realities after September 11, 2001
need a business case per application. Their time-to-market is years, except when a
competitor gets there first. Competition derived concerns limits their willingness to
share information considered sensitive.
Following their US examples, low cost carriers are becoming very successful in
Europe as well. Using the Internet to sell the majority of their tickets, they are used to
network-driven services. They want to restrict the required capabilities to data
exchange to ease certification. Their time-to-market is a few months at most with a
similar short return-on-investment. Potential next steps are flexible depending on
55

continuously monitored consumer changes and experience gained.
To conclude the advantages of a service-driven network centric concept are
recognized by all actors. Facing the harsh economic realties, and not used to
innovation beyond a single user community, no one is willing to take the first step.
Consequently for the first service the time-to-market should be a couple of months,
with a very affordable investment. This implies that it can not be a certifiable service.
Fortunately many ideas for such non-certifiable services are available. An impeccable
user interface will be key for user acceptance.
3 Process experience
This section assesses the co-operation between the consortium members realizing
the prototype. The conclusions will be based on metrics, which are derived using the
goal-question-metric paradigm of [2] that served us well in some previous analysis.
3.1 Project organization
The consortium comprises five carefully selected partners from four different
European countries, supplemented by a European institute, which formed the
project-specific consortium. Each partner effectively has a veto right. The main
disciplines and corresponding contributions of each partner are:
• Deployment of one application of which it provided the detailed specification;
• The airborne part, which it provided, and certification issues, which were studied;
• The infrastructure, which it specified and verified, and certification issues, which
were studied;
• Deployment of the other application, which it realized, and the infrastructure.
This activity is combined with consortium management;
• Deployment of both applications, which it realized.
At project start the objectives and the network-centric concept were sufficiently
mature. The details of the two pilot applications were to be determined. In the air
transport industry the waterfall model is the standard for safety-critical software
development and compatible with the mandatory airborne DO-178B [8] certification.
To accommodate the requirement for a drastically reduced time-to-market, the USDP
paradigm was chosen, even though none of the partners had experience with it.
The change request administration depicted in Fig. 6 shows some remarkable facts:
56
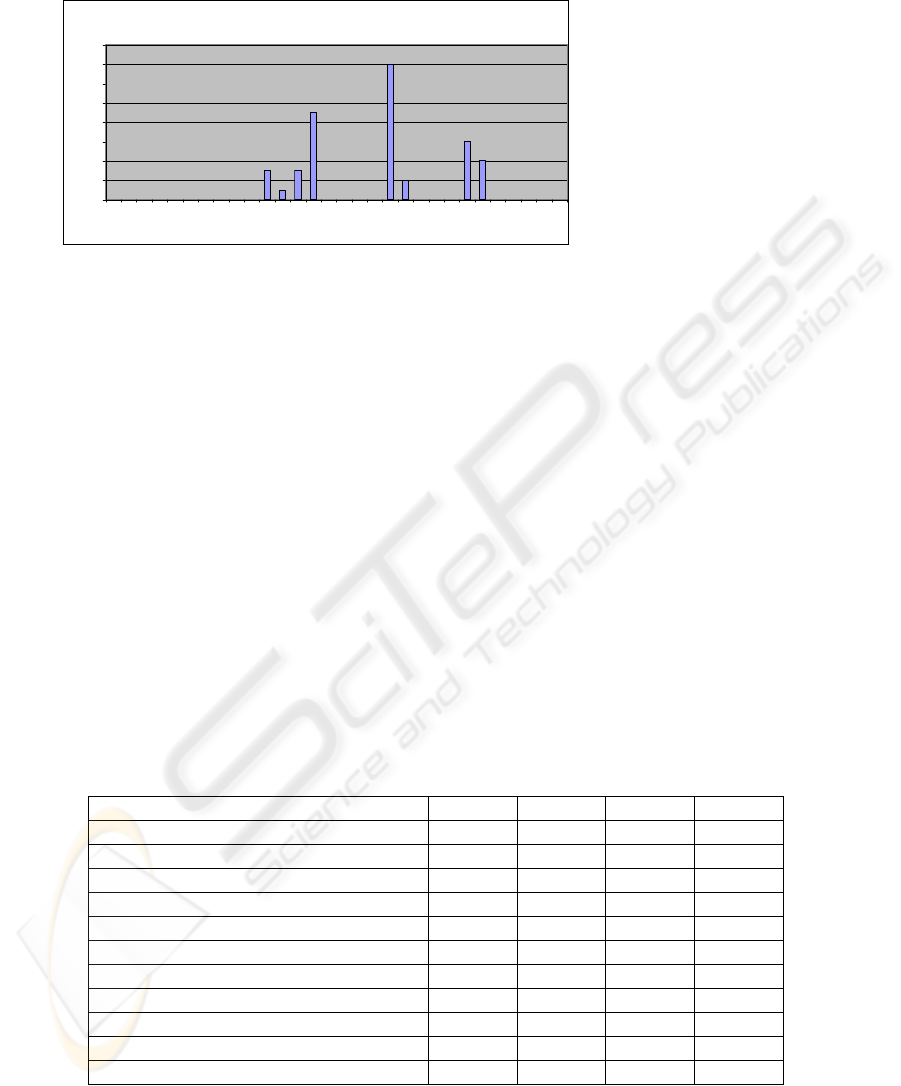
• All changes relate
to the specifications
of the four
components, none
were submitted to
other process
artifacts, including
software. As the
completion of build
1 kept shifting,
most code was only
submitted to the
project repository shortly before project completion. The change administration
before that date was the responsibility of the developing partner and hence is
invisible in the Fig. 6;
• One team member submitted 30 changes to downscale his TIS component. These
changes explain the peaks at month 19 and month 25 and part of the peak at month
11-13. This preceded the client reviews in month 15 and 26;
• Another member submitted 10 changes to clarify and downscale his application,
which explains the remaining part of the month 11-14 peak;
• The remaining four changes clarified some requirements. The additional change
with respect to Table 2 relates to a withdrawn and resubmitted change.
The USDP process assumes a spiral model with several deliveries and subsequent
adaptations of the requirements based on user feedback on the partial delivery. The
change administration reflects that the project maintained the single iteration waterfall
process familiar to all partners. The time-to-market and adaptability advantages of the
spiral model were not realized. Breaking down the requirements into smaller ones
could have helped.
3.2 Requirements and design phase
Table 2 provides some data about the realization of the prototype.
Table 2 Overview TALIS prototype realization
FAR MET TIS VPR
# requirements build 1/2/3 22/7/7 54/14/- 10/13/8 15/2/3
# identified requirements 66 118 108 26
# requirements test/inspect 2/34 68/- 31/- 20/-
# rejected requirements 3 34 3 1
# pages 90 85 97 80
# review comments (high/medium/low) 23/29/1 12/-/- 20/-/- 36/8/-
# approved/rejected changes 4/5 2/- 27/3 -/-
Analysis (man month) 22 9 18 5
Implementation (man month) 100 41 39 1
K Lines of Code 32.2 17.6 18.9 COTS
# of classes 106 65 75 COTS
Change Request per Project Month
3
1
3
9
14
2
6
4
0
2
4
6
8
10
12
14
16
123456789101112131415161718192021222324252627282930
Project Month
Number of Change Requests
Fig. 6. Change request during project
57

From Table 2 and some project information the following can be derived:
• Up to now, 1.5 month prior to the project end, build 1 has not been completed.
Many hard requirements have been postponed to future builds;
• The first row provides the numbered requirements. The second row lists the
amount of identifiable requirements based on current wording. The requirements
could have been phrased in smaller, separately identifiable units to ease
incremental implementation and testing;
• FAR uses inspection as verification method where test could have been used
more often;
• The many rejected MET requirements reflect the user belonging to one
organization and the analyst and the designer belonging to another.
Communication and elucidation was done by discussing the detailed
requirements;
• The document volume combines the requirements and the UML use cases;
• The number of review comments per page of specification is low, indicating
friendly reviewing, as e.g. [5] found 1.1 comment per requirements page of
which they rated 45% as critical;
• The many approved TIS changes reflect severe downscaling of this application;
• The VPR consists only of COTS, which requires a limited installation effort;
• Project management including quality assurance accounted to an additional 15%
of the total project budget. However this figure reflects the reality of the
maximum acceptable to the customer (the European Union). The remaining
management is included in each partners’ budget, in our case an approximate
10%. Such figures are in line with our other international projects.
3.3 Project communication
Traditionally in multi-national projects face-to-face meetings are held regularly to
align the views, the partner’s ambitions and to guide the project. For this purpose 46
meetings were planned, evenly split between the sites of the partners. In order for one
partner to save costs, frequent formal teleconferences and even more frequent e-mail
(averaging 230 per month between the 10 technical team members) replaced
meetings. Fig. 7 depicts the actual communication pattern to date, mid month 29. The
analysis of Fig. 7 combined with some project process information yields:
• The teleconferences tended to focus on project management issues in stead of on
technical issues;
• Maybe a technology to simultaneously share graphical information, used a/o to
express the requirements and the design, could improve this. Five levels of co-
operation from communicative to concerted are recognized in [3]. The project
needs the latter to achieve the required flexibility in service definition and time-
to-market. For concerted cooperation group support technologies are needed [3].
These could have been used at affordable costs;
• For one sticky management issue a videoconference has been held between two
partners in month 23. Due to the additional face-to-face contact this proved to be
efficient and cost-effective. Still this facility has not been used since;
58
• The first build kept
shifting, depriving
the project team
from feedback to
shape the next build.
Limiting the first
build would support
the USDP micro
deliveries and
comply with a short
time-to-market;
Fig. 7. Project communication means used
As an aside in month 26 a much smaller application mimicking an electronic flight
bag taxiing application was realized using 1.5 man month. In the last few days, many
small upgrades were implemented, including user comments from actors like pilots.
This application was realized within one partner, with people literally walking into
each other’s office. This prototype generated ideas for a second prototype that was
realized from scratch. It contains more additional electronic flight bag capabilities and
network-centric capabilities. It took a mere additional 2.5 man month. These two
activities demonstrate the feasibility of the USDP approach for air transport and its
value in obtaining user feedback. This success supports the view of [7] that a virtual
team requires information rich media like face-to-face meetings to achieve its goals.
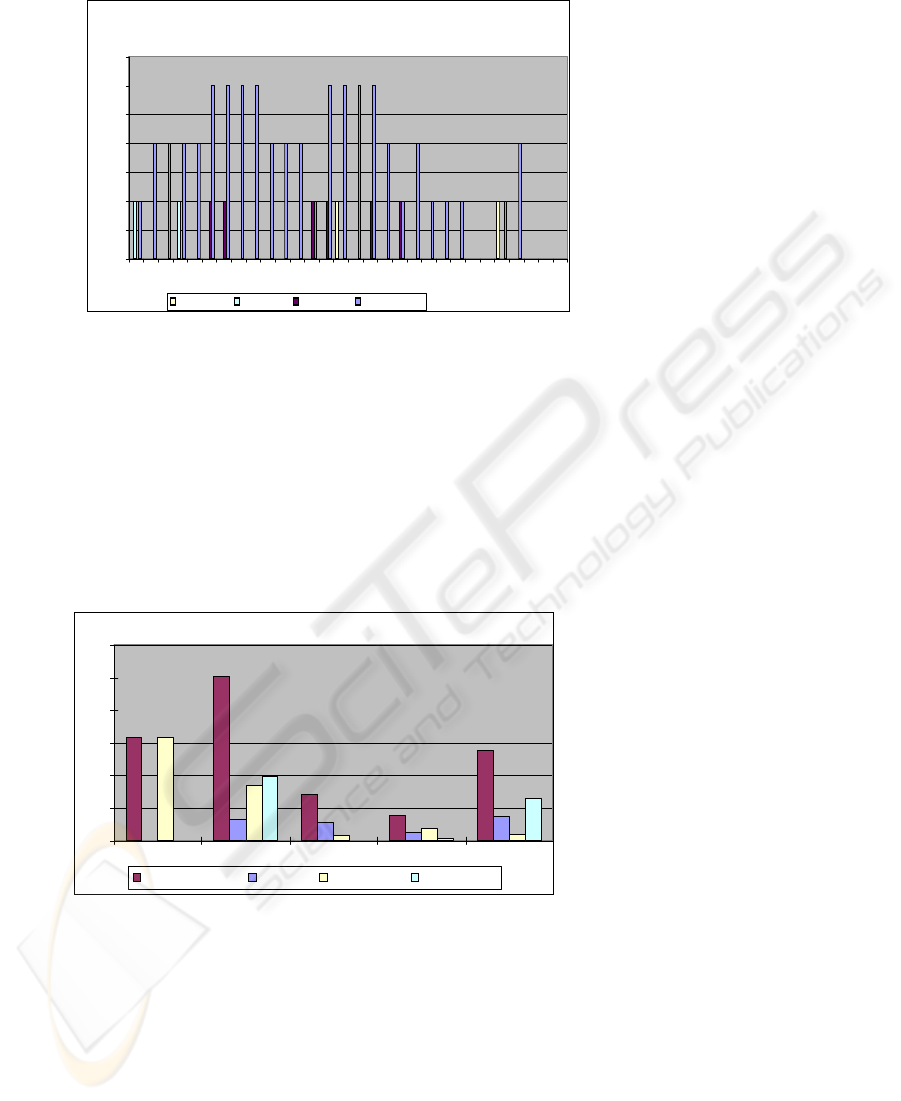
The size of the most
recent version of the
documentation is depicted
in Fig. 8. The most recent
version comprised 57% of
all documentation in the
configuration-controlled
archive. Previous versions
of the same documents
make up for the other
43%. Fig. 8 combined
with the previous
information leads to the
Fig. 8. Most recent document version size per work package
following observations:
• Only 17% of all documentation is a technical deliverable. Note that as testing is
not completed yet, the usually sizable test report documentation is excluded;
• Consortium level management documentation (WP1) amounts to 24% of the total
using 15% of the effort;
• The certification study (WP5) produced 21% of the documentation using 11% of
the effort;
Documentation size
0
500
1000
1500
2000
2500
3000
WP1 WP2 WP3 WP4 WP5
All, latest version
Technical
Management
Support tech
Communication per Project Month
0
0,5
1
1,5
2
2,5
3
3,5
123456789101112131415161718192021222324252627282930
Project Month
Project communicaation
Client review full meeting sub-meeting teleconference
59

• WP2, WP3 and WP4 work package management and quality assurance of
contributed 27 % to the documentation using 10% of the effort;
• The remaining 11% are primarily white papers. The electronic management style
and the resulting lack of face-to-face discussions lead to most technical exchange
being performed by exchanging white papers. Only the final result becomes a
technical deliverable.
4 Conclusions
The various air transport actors have confirmed the need for computer assisted
cooperation. Our COTS based prototype is acknowledged as a feasible solution. A
final validation needs actual deployment, for which the first service needs careful
selection and an impeccable user interface.
The distributed consortium achieved its goal. Our cooperation shows that for a
traditional waterfall implementation model electronic communication can replace
nearly all meetings, even for a newly formed, dedicated consortium. To achieve the
intended fast response to market driven changes a spiral model is required which
assumes a closer co-operation. Affordable computer-support like group support
facilities might facilitate the required co-operation in stead of the proven method of a
multitude of face-to-face meetings. The one case of video conferencing achieved its
objectives as effectively as a traditional meeting.
References
1. Anonymous: TALIS project website, http://talis.eurocontrol.fr/, (2004 Jan)
2. Basili, V.R., Caldiera, G., Rombach, H.D.: Goal Question Metric Paradigm, Encyclopedia
of Software Engineering 1, New York: John Wiley & Sons, (1994) 528-532, 1994
3. Chen, F. Romano, N.C., Nunamaker, J.: An Overview of a Collaborative Project
Management Approach and Supporting Software, Americas conference on information
systems
4. EUROCONTROL: Towards Co-operative ATS, The COOPATS Concept,
EUROCONTROL DIS/ATD/AGC/MOD/DEL 01, (2000 Nov)
5. Gantner, T., Barth, T.: Experiences on defining and evaluating an adapted review process.
Proceedings of the 25th international conference on Software engineering (2003 May). 506-
511 http://www.icse-conferences.org/2003/
6. Kesseler E.: Consistent safety objectives and COTS versus fragmented certification
practices and good safety records. 3rd IEEE SIIT conference (2003 Oct) 121-133.
7. Ramesh, V., Dennis, A.R.: The object oriented team: lessons for virtual teams from global
software development, HICSS 35, 2002
8. RTCA, EUROCAE: DO-178B / ED12BL: Software Considerations in Airborne Systems
and Equipment Certification., (1992 Dec)
9. Sherif, M.H.: When standardization is slow? International journal of IT standards &
standardization research 1, (2003, Jan-Mar) 19-32
60
