
A
Tool-based Methodology for
Software Portfolio Monitoring
Tobias Kuipers
1
and Joost Visser
2
1
Software Improvement Group, Diemen, The Netherlands,
2
Departamento de Inform
´
atica, Universidade do Minho, Braga, Portugal,
Abstract. We present a tool-based methodology for monitoring the development
and maintenance performed on the software portfolio of a large company. The
toolkit on which the methodology is based includes an extendable framework for
software analysis and visualization that meets strong demands with respect to
scalability and usability. The methodology consists of 3 nested iterations and is
carried out by software engineers with very strong consultancyskills. The shortest
iteration consists in applying the toolkit to the software portfolio to obtain and
register basic facts such as metrics and dependencies. In the middle iteration,
the engineers interpret and evaluate the newly registered facts. The findings are
reported to IT management together with recommendations about how to react to
the findings. In particular, one kind of recommendation is to carry out a Software
Risk Assessment on a selected system or project. Finally, the longest iteration is
the publication of an annual software report, which summarizes the monitoring
results of the previous year.
1 INTRODUCTION
The value of most businesses today is in large part determined by their software sys-
tems. These systems tend to be large, complex, and highly heterogeneous. Over time
they have been extended, and adapted to changing requirements. Often they have been
written in a mix of old and new languages of various levels of abstraction. Though crit-
ical from a business perspective, these systems are often experienced as black-boxes by
managers and technical staff alike.
Typical portfolio status As an example, consider the case of a modern bank. Typically,
it has come into existence through mergers and acquisitions of various smaller banks
that each started to automate their processes somewhere in the 1960s. During the years,
not only transaction processing and account administration where automated, but also
international payments, savings, mortgages, loans, and more. Each ‘financial product’
was automated independently in the preferred technology of the time. In the early days,
this would be Cobol with sequential files for storage and JCL for batch job coordination,
all running on a mainframe computer. Over time, hierarchical databases and, somewhat
later, relational databases gained popularity over the sequential files. Likewise the grow-
ing need for interactive systems stimulated the use of 4th generation Cobol generators to
Kuipers T. and Visser J. (2004).
A Tool-based Methodology for Software Portfolio Monitoring.
In Proceedings of the 1st International Workshop on Software Audits and Metrics, pages 118-127
DOI: 10.5220/0002682301180127
Copyright
c
SciTePress

build screens, and transaction managers to communicate asynchronously between pro-
grams. The introduction of new hardware platforms boosted the use of alternatives to the
Cobol language, such as C, Delphi, Clipper, and PL/SQL. More recently, web-related
technologies were added, such as Java, Visual Basic and various scripting languages.
With the introduction of new technology, the old technology was not abandoned.
Rather, many inventive techniques were (and are) introduced to glue them together:
compiler extensions, assembly routines, database and communication utilities, code
generators, etc. Many of these gluing techniques were home grown and tailored to the
company’s specific constellation of technologies. To the present day, brand new systems
are still being developed in out-dated technology, simply because it is deemed reliable
and ample expertise with it is available within the company.
This banking example is no exception. We have been privileged to perform analy-
ses on the software of a dozen financial services companies in the Netherlands, varying
from very large (more than 100,000 employees) to medium size (600 employees). For
all these companies, their software was organized as described above. Before every-
thing else, the sheer volume of their software systems is oppressive: even the smallest
meaningful system is over 1 million lines of code. In all, over the last three years we
have seen about 50 gigabytes worth of source code, all of it variations on the same
theme: financial products.
Furthermore, we have been able to establish that the quality of the various sys-
tems developed and maintained over the years varies. The first system built with a new
technology is generally low in quality. Systems that have gone through many small
adaptations tend to have degraded in quality. Periods of weak management, or pressure
from the business divisions may have led to over-ambitious projects that failed, but left
their traces in the form of overly complex interfaces, over-dimensioned communication
infrastructures and the like. The connections established between systems throughout
the years have weaved them together in intractable ways.
Apparently, over time, a typical financial service company has come to be the proud
owner of a huge number of intractably interweaved software systems, that are low in
quality, and constructed from a wide spectrum of technologies.
Insight is indispensable
Obviously this is not an ideal situation from a software engi-
neering perspective. Maintenance of the software portfolio is more costly than neces-
sary, and the systems are resistant to change. Such changes are needed to keep up with
customer expectations, so this is also a problem from a commercial perspective.
To prevent further deterioration, and to move toward improvement of the IT situa-
tion, it is of the utmost importance that the management of the organization acquires
clear insight into the difficulties, the dependencies, and the maintenance costs of its var-
ious software systems. Such information is indispensable to make strategic IT decisions
on rational grounds.
We propose Software Portfolio Monitoring (SPM), a tool-based methodology that
allows for the structured and efficient extraction of quality, volume and interrelations
data from system source code. Since the data is gathered for multimillion lines of code
systems, and since it needs to be reported to the CIO, the methodology includes steps
to insure data is highly aggregated. Only relevant data is shown in a way that allows
non-technical managers to make informed decisions on their company’s systems.
119
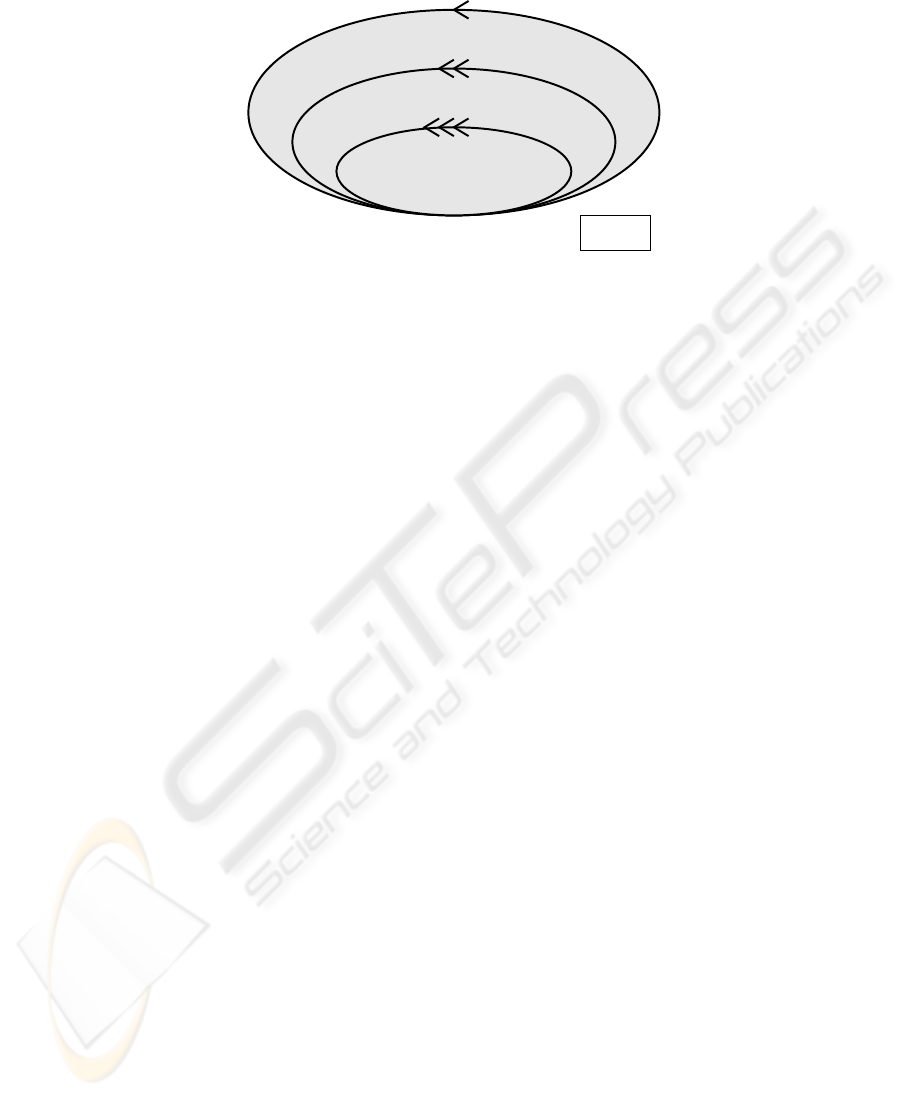
Deliverable
Action
Annual software report
Summarize
Quarterly report
Monthly report
Apply software analysis toolkit
Evaluate, interpret, highlight, recommend
Fig.1. The SPM methodology consists of three nested iteration.
2 THE METHODOLOGY
In this section we provide an outline of our methodology for Software Portfolio Mon-
itoring (SPM). We will describe the activities and deliverables of each iteration. Also,
we will discuss the relationship of SPM to the various company management levels and
to related services such as Software Risk Assessments and Documentation Generation.
2.1 Iterations
The methodology consists of three nested iterations, as illustrated in Figure 1. Short iter-
ations are indicated with a small ellipse; longer iterations by a larger, enclosing, ellipse.
For each iteration, both the deliverable is indicated, and the actions that are executed to
obtain the deliverable. Each larger iteration takes the deliverables of the iterations it en-
closes as input (new data) as well as the deliverables of previous iterations of the same
size (previously registered data). In this paper, we assume a shortest iteration duration
of a month. In practice, the particular situation is taken into account to decide the most
appropriate duration.
Monthly iteration.
The inner iteration is performed on a monthly basis. In this itera-
tion, the Software Analysis Toolkit is applied to the software portfolio, resulting in a
large number of basic facts about the code. These facts include metrics, dependency in-
formation, and detected violations of programming conventions or standards. All these
facts are collected into a data repository. From this repository, a report is generated that
presents the facts in a human digestible fashion. This means that the data is appropri-
ately grouped and filtered, and visualized in graphs and charts that meet the informa-
tion needs of individual project managers. In Section 3, the architecture of the Software
Analysis Toolkit will be discussed in more detail.
In an ideal situation, the monthly application of the software analysis toolkit would
be automated completely. In practice, the realities of legacy software make some degree
of human supervision and intervention indispensable. These realities include the size
and heterogeneity of the software portfolio, the ever-continuing maintenance activities
120

on the portfolio, the low CMM level of many client organizations, the abundance of
competing standards within a single organization, local conventions and idioms that are
not rigorously enforced, remnants of failed or obsolete projects, and more.
Thus, the capabilities required from the software engineers that perform the monthly
iterations is not merely to operate the toolkit, but also to adapt and extend it within a
very short time frame. In fact, we advocate adoption of an extreme programming atti-
tude toward legacy system analysis tools [?]. In particular, we recommend unit testing
as an efficient and pragmatic means of guarding the performance and behavior of the
various toolkit components when they undergo adaptation and extension. Also, to meet
the strong demand of robustness, generality, scalability, and speed of development re-
quired from the components of the toolkit, the software engineers must master advanced
implementation techniques (see also Section 3).
Quarterly iteration.
Every three months, the technical data gathered in the inner iter-
ations is interpreted and evaluated by software engineering experts. Also, the data is
related to business goals as formulated by IT management. The findings are presented
to IT management together with recommendations about how to react to the findings.
By interpretation, we mean that various selections of the data are combined and con-
trasted to discover for instance trends, correlations, and outliers. For example, based on
the fact that certain modules have exceeded a certain complexity threshold, an engineer
might hypothesize that these modules implement several related functions in a tangled
fashion. He might discover that the database dependency information for these modules
corroborates his hypothesis. Finally, he may take a small sample from these modules,
read their code and verify that his hypothesis is indeed true.
By evaluation, we mean that the engineer makes value judgments about the software
portfolio. The judgments will not be a reflection of his personal taste. Rather, he will
base them on best practices reported in the literature, on published quality standards,
comparisons with industry best and average, and so on. In other words, he will need
to access general knowledge about software engineering practice, as formulated in the
past by others.
During the course of the quarterly iteration, the monitoring experts conduct inter-
views with the CIO and other individual members of the IT Management. The purpose
of these interviews is to formulate the tactic and strategic business goals and their IT-
related consequences. Additionally, a workshop with several members of the IT man-
agement can be organized to supplement the interviews.
The evaluation and interpretation of the technical data, as well as recovery of IT-
related business goals are instrumental in the most important element of the quarterly
iteration: the drafting of recommendations. These recommendations can be of various
kinds. They can be highly detailed, short-term recommendation, such as redesigning a
particular interface, migrating particular persistent data from hierarchical to relational
storage, or upgrading a particular third-party component. On the other hand, some rec-
ommendations may have a more general, long term character, such as integrating two
functionally similar, but technically distinct systems, or reducing the procedural char-
acter of the object-oriented portions of the portfolio.
In some cases, the monitoring data are not sufficient to warrant concrete recom-
mendations. They reveal a problem, but do not suggest a solution yet. In these cases,
121
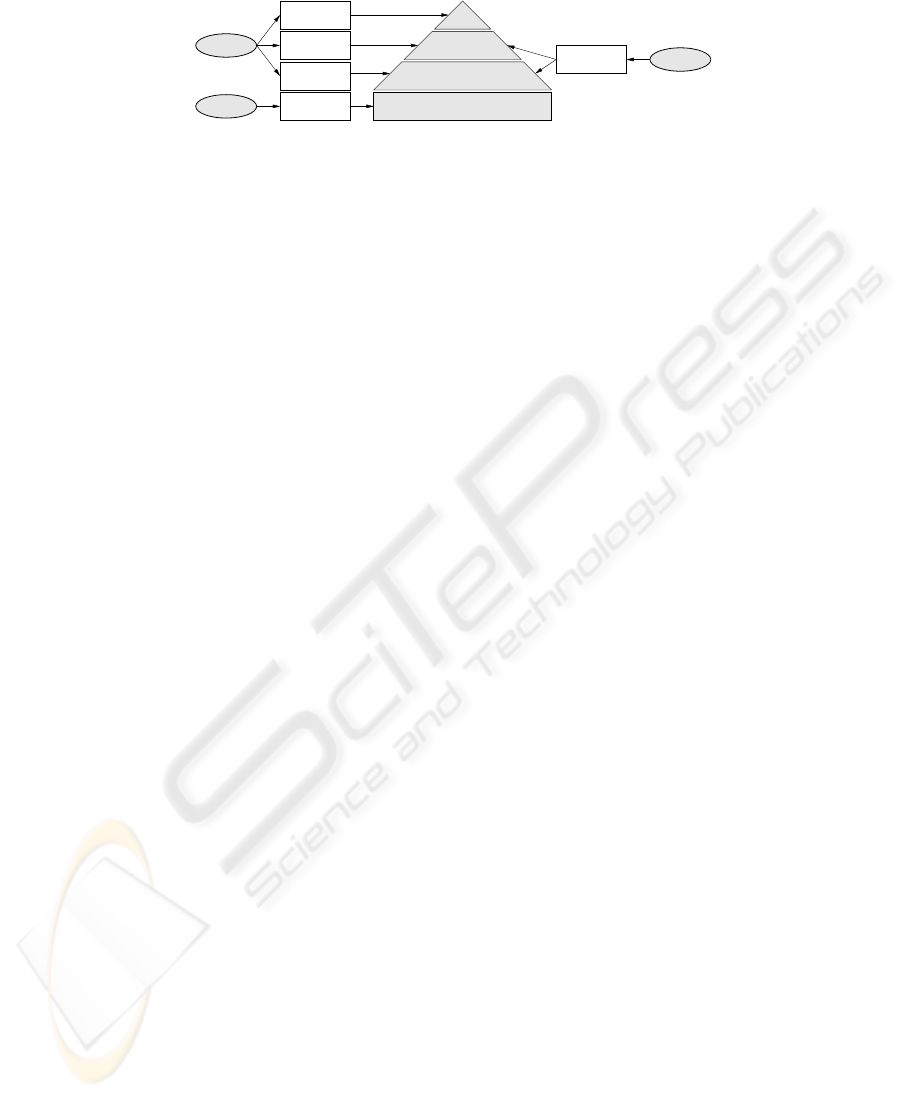
Board
report
SRA
Annual
SPM
DocGen
Project Staff
Project Management
ICT ManagementQuarterly report
Technical
Documentation
Assessment
software report
Monthly report
Fig.2. Software Portfolio Monitoring (SPM) and its relationships to deliverables, management
levels, and other tool-based services, viz. Software Risk Assessments (SRA) and Documentation
Generation (DocGen).
the recommendation formulated by the monitoring experts will be to perform a Soft-
ware Risk Assessment (see below) on the system or project in which the problem has
been signaled. Such an assessment consists of an in-depth analysis, involving interviews
and workshops with technical staff and application of specialized tooling, and leads to
a concise report with concrete and detailed recommendations for the system or project
under consideration.
The deliverable of the quarterly iteration is a written report to IT management,
which is presented in person by the monitoring experts in an IT management meeting.
Annual iteration.
Every year, the deliverables of the monthly and quarterly iterations
are summarized in an Annual Software Report. The intended audience of this report is
the general management of the company, which is not necessarily IT-savvy. For this rea-
son, the software engineering experts that compile the report need to be able to explain
IT issues in layman’s terms. In addition to the summaries of the monthly and quarterly
iterations, the Annual Software Report may include IT-related financial information, if
available in sufficient detail. In this case, the monitoring experts need to have some level
of knowledge of business economics and finance.
2.2 Organizational context of tool-based services
The various reports produced during the various iterations of Software Portfolio Moni-
toring are delivered to different management levels within the client organization. This
is shown in Figure 2. The monthly reports are delivered to project managers. The quar-
terly reports are presented at the IT management level, i.e. to the Chief Information
Officer and his immediate subordinates. The Annual Software Report is intended for
consumption by the general management.
Also shown in Figure 2 are the relationships of SPM to other services based on static
software analysis, i.e. Software Risk Assessments and Documentation Generation.
Software Risk Assessments. Software Risk Assessments [?] are performed on request
by the IT management, possibly following a recommendation from a quarterly moni-
toring report. Like SPM itself, a Software Risk Assessment is a tool-based service. But
whereas SPM is a continuous effort conducted on a full software portfolio, an SRA is
a one-time inspection of a limited body of software (generally a single system). Also,
SPM serves to identify general trends, while SRA focuses on specific software risks.
The audience of SRA reports are general IT management and IT project management.
122
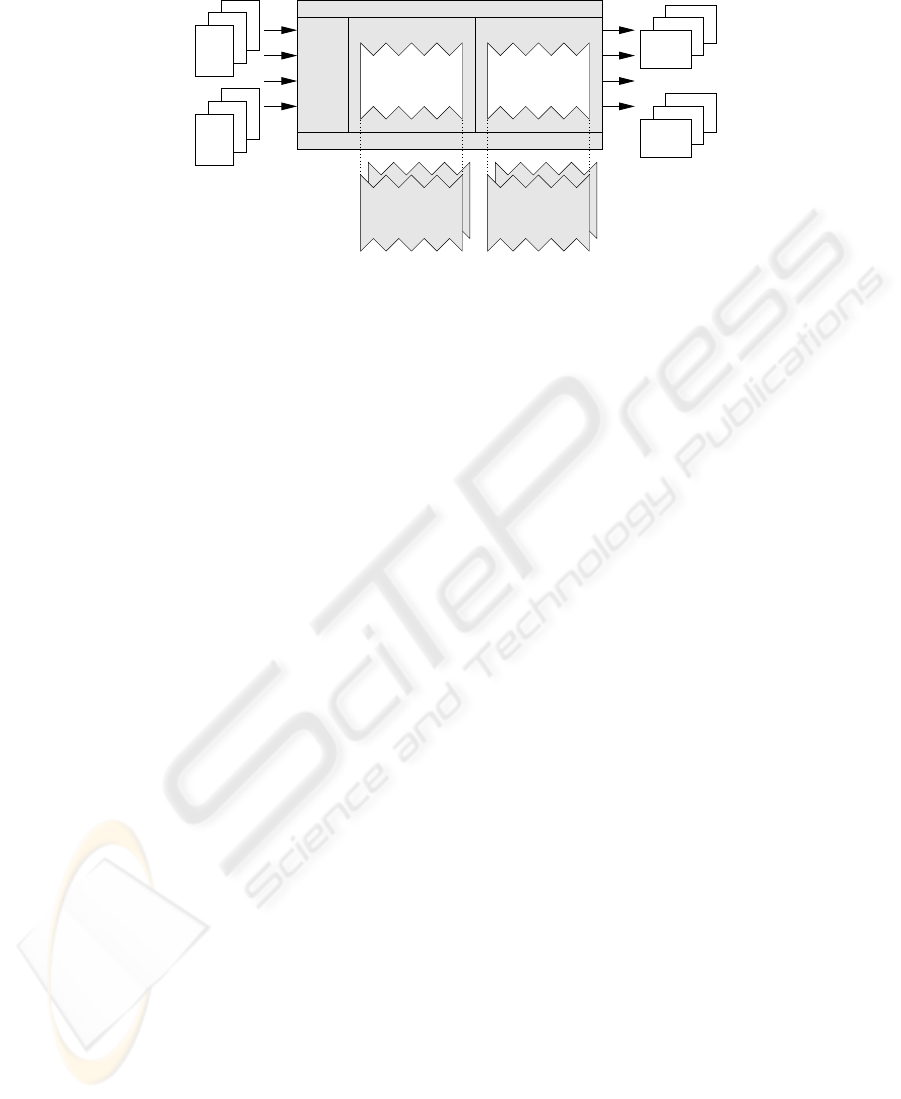
Analysis
Component
Visualization
Component
Analysis Framework Visualization FrameworkSource
Manager
Data Repository
Grafical User Interface
Sources
interface
analysis execution visualization execution
interface
data model interfacedata model interface
Graphs
Charts
Fig.3. Architecture of the Software Analysis Toolkit. It consists of a framework into which spe-
cific analysis and visualization components can be plugged.
Documentation Generation.
Documentation Generation [?] is the fully automatic gen-
eration of technical documentation from program source code. In contrast to well known
documentation generators, such as javadoc, the purpose is to document not only the
APIs of the software, based on comments inserted by programmers for that purpose,
but to document the internal structure of the programs as well without a specific doc-
umentation effort by the programmers. The primary audience of generated technical
documentation is not IT management, but the technical staff, including programmers,
testers, reviewers, and operators.
3 TOOL BASIS
In this section we provide an outline of the Software Analysis Toolkit (SAT) on which
SPM is based. Figure 3 shows the architecture of the SAT, consisting of a framework
and components. We describe both the generic framework for analysis and visualization
and its instantiation with specific analysis and visualization components. The SAT was
developed by the Software Improvement Group.
3.1 Framework
The framework of the Software Analysis Toolkit consists of a graphical user interface
that provides access to three pieces of functionality: gathering source code, performing
static analysis on the code, and visualizing their analysis results. The components that
implement analysis and visualization are themselves frameworks into which various
subcomponents can be inserted that implement individual analysis and visualization al-
gorithms. A repository that persistently stores all information extracted from the sources
is shared by the components for gathering, analysis, and visualization.
We will discuss various components of the framework in more detail.
Source Manager.
The Source Manager is responsible for gather source code. It allows
the user to define a system and associate to this system a name, source code locations,
123

and a brief description. These attributes of the system will be stored in the data reposi-
tory for future reference.
The source locations are recursively searched by the Source Manager to gather the
source files associated to the defined system. With each file found a file type will be
associated, based on its extension and sometimes parts of its content. Examples of file
types are Cobol program, Cobol copybook, C header file, Ant build file, and unknown.
The operator of the toolkit can request the source locations to be searched again
at regular intervals, or only on manual request. If between searches files have been
changed, added, or deleted, this is detected and registered in the data repository.
Analysis Framework.
The Analysis Framework offers the user for each defined system
a selection of analyses that can be executed on it. Only those analyses are available that
are applicable, given the various file types occurring in the system. The user can select
all or some of the applicable analyses, start their execution, and watch their progress.
Which analyses are available for which file types depends on the available instan-
tiations of the framework. These instantiations are required to implement an analysis
execution interface so that they can be started, watched, and stopped, and they are al-
lowed to use a data model interface to store their results in the data repository. Examples
of instantiations will be given below.
Visualization Framework. The Visualization Framework allows the user to visualize
the results of the analyses, once they have been completed. Basically, two categories of
visualizations are available: charts and graphs. Both are highly parameterizable. Which
visualizations are available exactly depends on the available instantiations of the frame-
work. These instantiations are required to implement a visualization execution frame-
work to allow them to be parameterized and rendered. They use a data model interface
to retrieve from the data repository the analysis results that need to be visualized.
3.2 Analysis components
Analysis components vary in their degree of sophistication and generality. Some com-
ponents are applicable only to certain types of files. For instance, a component of
control-flow reconstruction may implement an algorithm that works only for ANSI-
Cobol-85. Other components are applicable more generally. For instance, a component
for counting lines of code and comment could work for any language that employs one
of the common comment conventions.
We will briefly give a description of some available analysis components. Also, we
will discuss general requirements to be imposed on these components.
Lines of code and comment. To be able to count code and comment lines, the analysis
component must be able to distinguish comments from code. Since different (program-
ming) languages employ different comment conventions, the component implements
recognizers for common conventions. Full tokenization of the input files is usually not
necessary; the recognizers can be implemented using standard regular expression li-
braries. Based on the file type, the proper recognizer is chosen. When a format or lan-
guage is encountered with a comment convention for which no recognizer is available,
the SAT operator needs to extend the component with an additional recognizer.
124
A000-MAIN
EVAL
288 289 292
B100-OPEN R100-VERWERK B200-CLOSE
IF 300
T F
IF 310
T F
IF 334
T F
EVAL
347 354 358 361 364
EVAL
376
R200-TITULATUUR R400-VOORLT R220-VOORVG R230-NAAMR210-VOORLT
IF 385
T F
IF 402
T F
IF 412
T F
R300-SAMENSTELLEN-NAAM
LOOP
455
LOOP
466
IF 476
T F
IF 456
T F
IF 469
T F
IF 478
T F
LOOP
493
IF 497
T F
X999-ABORT
IF 548
T F
R995-CLOSE-FILES
DECLA-CLS-000..DECLA-CLS-999
IF 527
T F
(a) CCG where nodes are reconstructed
procedures, conditionals, loops, and
switches.
A000-MAIN
B100-OPEN R100-VERWERK B200-CLOSE
R200-TITULATUUR R400-VOORLT R220-VOORVG R230-NAAM R210-VOORLT X999-ABORT R995-CLOSE-FILES
R300-SAMENSTELLEN-NAAM DECLA-CLS-000..DECLA-CLS-999
(b) CCG after filtering out conditions, and
using fanout metric to determine node size.
Fig.4. Conditional call graph (CCG) reconstructed from a Cobol program.
Function Point Analysis by backfiring. Function Point Analysis is a methodology for at-
tributing a functional size to a given software system. The backfiring method [?] allows
to make an estimate of the number of function points based on the number of logical
statement in which the system is encoded. Depending on the implementation language,
a specific multiplication factor is applied to the number of logical statements to arrive
at the function point estimate.
Cobol control flow reconstruction. Cobol does not have procedures in the sense of
delimited blocks of code with well-defined entry and exit points and interface. Instead,
it has labeled blocks of code and various mechanisms for jumping to and from these
blocks. In [?], a light-weight algorithm is described for reconstructing procedures from
Cobol code, and their interdependencies, i.e. to analyze the intra-program control-flow
of Cobol programs. An example of a conditional call graph reconstructed from a Cobol
program is shown in Figure 4(a).
Clone detection using metrics.
Clones are duplicate pieces of software that generally
result from copy-paste techniques in programming. Clones can differ slightly, for in-
stance in the names of variables or in the exact order of statements and declarations.
A pragmatic technique for detecting clones is to compute metrics over the code, and
compare the metrics [?]. If the metrics for two pieces are (almost) identical, they are
clones.
General requirements. The analysis components described above are just examples,
but they demonstrate the general requirements all analysis components should satisfy
to be useful for SPM: scalability and genericity.
The amount of source code in a typical software portfolio ranges between 1 million
and 100 million lines of code. Processing this code to obtain the basic monitoring data
125

should under no circumstance take more than a few hours. The computational com-
plexity of the implemented algorithms should be kept within bounds. In this sense, the
analysis components must be scalable.
The implementation techniques used in constructing the analysis components should
be of a high degree of genericity. By genericity we mean that a piece of code works for
many different kinds of data. In this case, it means that the (elements of the) analysis
algorithms should work for many different kinds of source models. If genericity is lack-
ing, the algorithms will lack conciseness, robustness, and reusability. As a result, it will
be extremely difficult to implement and adapt them within short time frames, and they
will easily break when they are applied to slightly different source language dialects.
Generic implementation techniques include generic traversal [?], strategic and adaptive
programming [?], and island grammars [?].
3.3 Visualization components
The second kind of component that can be plugged into the framework of the software
analysis toolkit are visualization components. These components can be implemented
using external visualization libraries or making calls to external visualization tools. We
will briefly describe some available visualization components.
Charts.
To visualize software metrics, charts are a helpful medium. We have used a Java
library called JFreeChart for this purpose. This library allows composing bar charts, line
charts, pie charts, and more. Also, it allows combining several metrics in a single chart.
The additional functionality that our metrics visualization component offers includes
selection and thresholding functions.
Graphs. To visualize dependencies in software, we use a graph browser. This browser
allows navigation through hierarchical graphs. It also allows selection and filtering of
graphs in various ways. This is very important to reduce information overload, i.e. to
turn a big ball of spaghetti into a surveyable graph in which important aspects stand
out. Figure 4(b) shows a conditional call graph reconstructed from a Cobol program. To
reduce the size, condition nodes have been contracted. Also, the node size is determined
by the fanout metric, i.e. procedures with more outgoing calls to other procedures are
shown bigger.
Animation.
For Software Portfolio Monitoring, we are not only interested in presenting
data about software at a particular moment. We need to visualize the evolution of the
software throughout time. Of course charts can be used for this purpose, where one of
the axes represents time. Another instrument is the use of animations. Figure 5 shows
a 3-frame animation of the evolution of various size metrics of a Java system. The
advantage of using an animation in this case is that both axes can be used to plot metrics,
thus allowing more metrics to be visualized simultaneously.
4 CONCLUSION
We have described a iterative methodology for monitoring the development and main-
tenance performed on the software portfolio of a large company. The methodology is
126
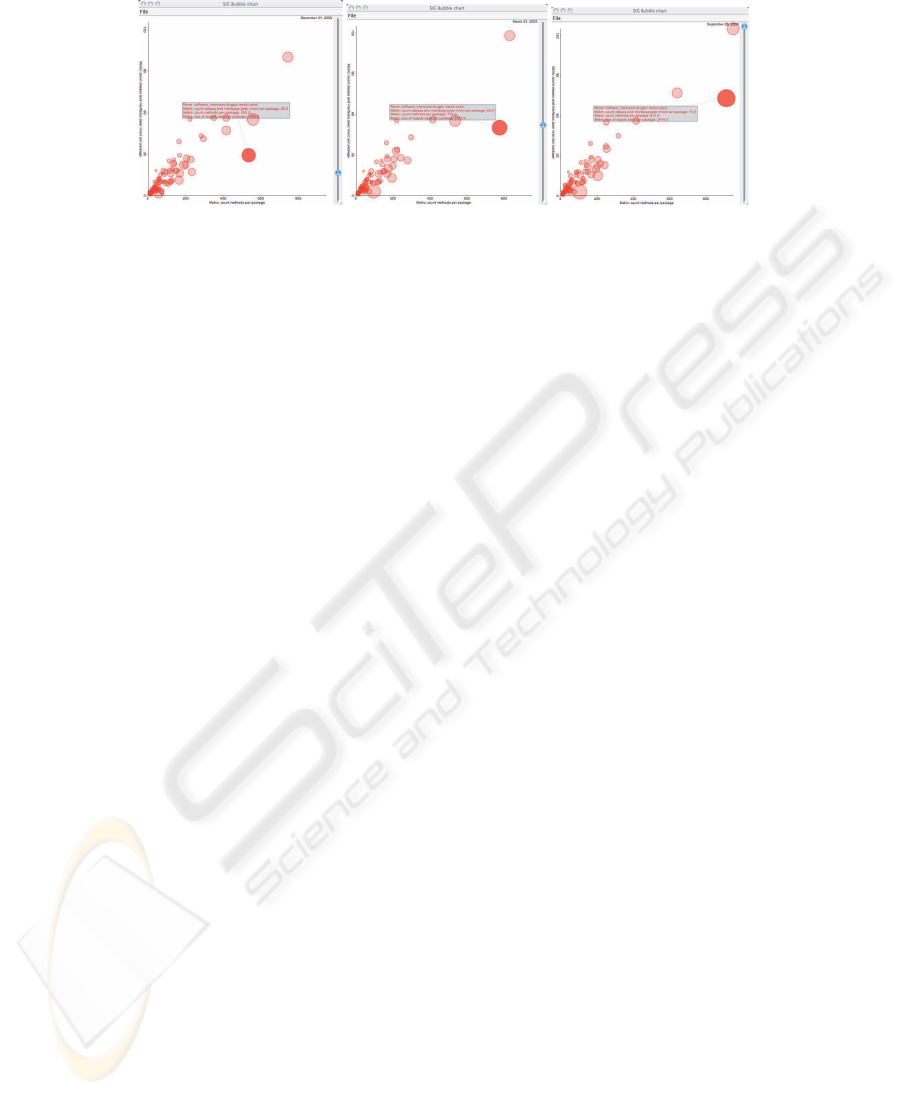
Fig.5. A Java system in december 2002, march and september 2003. Bubbles represent packages.
The x-axis shows the number of methods, the y-axis shows the number of types (classes and
interfaces), and the bubble surface shows the size of the largest class in the package. Note that
during this period, the selected package doubled in size, both in terms of number of methods and
number of types. But in terms of methods-per-class ratio, it scores lower than any of the other
packages.
tool-based, in the sense that its inner iteration involves the application of a software
analysis toolkit on the entire software portfolio. The remaining iterations deal with in-
terpretation, evaluation, and aggregation of the collected data and presenting them to IT
and general management.
127
