
A
New
Approach for Geological Faults Detection
A.O. Cepero D´ıaz
1,2
, V. Di Ges`u
2
, and C. Valenti
2,?
1
Departamento de Autom´atica y Computaci´on
Universidad Tecnol´ogica de La Habana, Cuba
2
Dipartimen
to di Matematica e Applicazioni
Universit`a degli Studi di Palermo, Italy
Abstract. This paper will introduce a new approach, mainly based on
wavelets transform and mathematical morphology, for the detection of
geological faults in satellite and aerial photos. This can be useful for ter-
ritorial analysis, digital cartography and the use of geographical infor-
mation systems. The proposed method is fast enough and unsupervised.
Different techniques will be compared and some examples on real data
will be presented to indicate the applicability of these methods.
Keywords: geological faults, mathematical morphology, fuzzy morphol-
ogy, wavelet image analysis.
1 Introduction
Geological systems for the analysis of multispectral images taken from satellites
and airplanes usually require different experts and a lot of time. Actually, it is
possible to spend months or even years in order to create an accurate map of a
wide region. This information is embedded in a database which can be used, for
instance, to create thematic maps and temporal reconstructions of the events
(e.g. the evolution of the pollution, the type of the vegetation, the establishment
of settlements, ...). Recently, a specific problem has been arisen by the research
group of Dipartimento di Scienze della Terra in Siena, Italy, and it consists of the
recognition of the outlines due to faults, usually perceived as darker zones. This is
of great interest in several tasks such as cartography, underground or superficial
characterization, the location of spring of water, the estimation of the stability
of the slopes, and the driving in the extraction of stones. Traditionally, this duty
is based on the identification of certain features (e.g. geometrical relations of the
faults such as size, position and orientation) through campaigns and handmade
analysis of the photos by using expensive hardware and software.
Although we have tested different techniques, such as the Hough transform,
we will refer to three approaches which have given the most promising results.
Here the suitability for high resolution image analysis of a well known wavelet
algorithm is examined and its results are compared with those obtained by other
methods already present in the literature. Tests on real images show that it is
possible to analyze complex structures in a very fast way.
?
This
w
ork has been partially supp orted by ASI - Italian Space Agency - under
grant I/R/117/00: “Tecniche ottimizzate di elaborazione, memorizzazione ed indi-
cizzazione di immagini telerilevate”.
O. Cepero Díaz A., Di Gesù V. and Valenti C. (2004).
A New Approach for Geological Faults Detection.
In Proceedings of the 4th International Workshop on Pattern Recognition in Information Systems, pages 216-221
DOI: 10.5220/0002686702160221
Copyright
c
SciTePress

2 Standard methods
Mathematical morphology is a branch of digital image analysis which uses con-
cepts of algebra and geometry [1, 2]. It has been successfully applied in the field
of remote sensing to discriminate tree species [3], to segment soil maps [4], and
to extract roads, rivers, villages [5].
2.1 Standard mathematical morphology
A fast algorithm for directional morphological filtering to extract long thin ob-
jects in satellite images has been introduced in [6]. In our first technique, we
have implemented both the erosion ε and the dilation δ of the input image I:
ε
X
(I)(p) = min
q ∈X
I(p + q) and δ
X
(I)(p) = max
q ∈X
I(p + q)
where X represents, along a variety angles, a binary bar with generic length and
width. In practice, the erosion (dilation) is defined on the grey level image I
by computing the local minimum (maximum) around each point p. The exact
shape of this neighborhood is easily defined by that of the structuring element
X. Assuming a fault as the union of consecutive segments, darker than the
background, we have enhanced it by applying the opening operator γ = δε. We
must do it a lot of times along different orientations to highlight all the faults
and the final map will contain the local maxima among all opened images. An
example for 16 angles and bars of 15 × 3 pixels is shown in Figures 1a,b.
2.2 Fuzzy mathematical morphology
In order to apply fuzzy mathematical morphology [7, 8], we transform both the
image I and the non-flat structuring element X in fuzzy sets and reinterpret their
intensity values as a grade of membership. All usual mathematical morphology
operators can be generalized and it is possible to extend to grey level images some
inequalities that hold for binary images in the case of standard mathematical
morphology. Here, we will recall only the definition of correlation:
ρ
p
=
1 +
P
q ∈X
(X(q) − µ
X
) · (I(p + q) − µ
p
)
2|σ
X
σ
I
p
|
where µ
X
(σ
X
) and µ
I
p
(σ
I
p
) are the mean (standard deviation) values of X
and the sub-image of I, with the same shape and size of X and centered in p.
Best correlation (i.e. ρ = 1) is obtained when the considered sub-image is
exactly like X. This definition of correlation exalts both dark and bright outlines
and therefore we have to select the former ones by computing their average
luminosity. As for the morphological opening, we then calculate the image of
local maxima. Figure 1c shows the map of matching degree obtained by rotating
along 16 directions a Gaussian structuring element of 21 × 9 pixels.
217
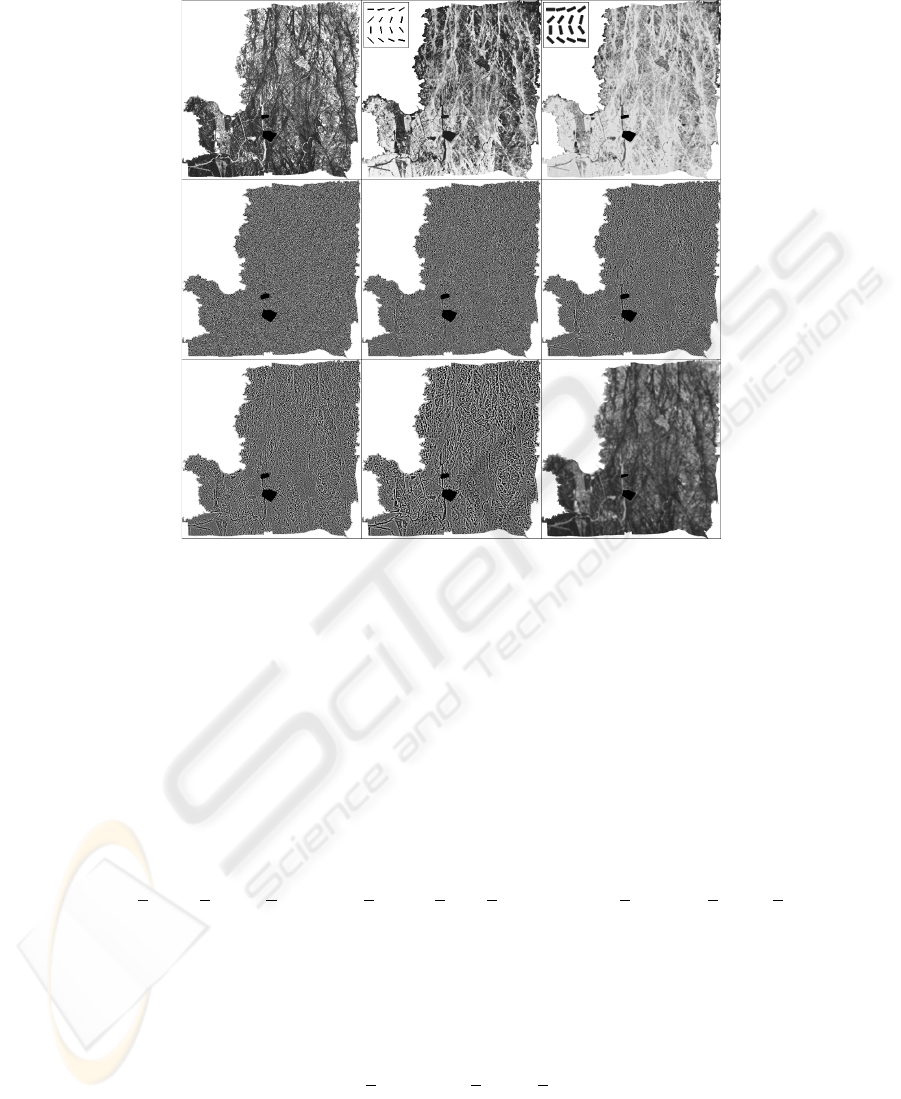
Fig. 1. a: aerial photo (4096 × 4096) of the Caprera Isle. The black zones corresponds
to military sites. b: mathematical morphology erosion. c: fuzzy correlation. The struc-
turing elements, not on scale, are superimposed on (b,c). d–h, i: wavelet and residual
planes by the `a trous algorithm. All histograms have been stretched for clarity.
3 Analysis based on wavelets transform
Wavelets provide an alternative approach to signal processing and constitute a
link between mathematics, physics and electrical engineering. The so called `a
trous procedure [9] maps the input signal to its coefficients with respect to a
basis of wavelet functions, constructed by dilation and translation of a mother
wavelet function [10]. The underlying idea is simple and the process, sketched as
follows, is very fast. At step i, get a smoother version c
i
of I by convolving with
a high-pass filter and compute the wavelet coefficients w
i
by a low-pass filter:
c
0
(p) = I(p), c
i
(p) =
c
i−1
(p + 2
i−1
q), h(q)
®
, and w
i
(p) = c
i−1
(p) − c
i
(p).
In practice, both c
i
and w
i
have the same size of I. Figures 1d–i show the ap-
plication of the `a trous algorithm. The planes w
1
and w
p
contain the highest and
lowest frequencies, that is the finest and coarsest details of I, respectively. When
the desired resolution j has been reached, the original image can be expressed
as the sum of all w
i
and the final smoothed approximation c
j
:
I(p) =
j
X
i=1
w
i
(p) + c
j
(p).
218

The kernel has been obtained via a B
1
-spline function:
h =
1
16
1 2 1
2 4 2
1 2 1
.
This function has been selected thanks to the fact that it is compact (reducing
the boundary artifacts at block edges), isotropic (not privileging any direction),
and limited to 9 elements, whatever the level i of the scale is (an average personal
computer can calculate each plane w
i
of a high resolution photo in about 5
seconds). Moreover, other classical scaling functions such as B
3
-spline, M eyer
or Daubechies
4
[11, 12] seem to return too smoothed wavelet images.
4 Experiments and comparison of the methods
After applying the above methods we binarize their results by just setting a
threshold value equal to the average luminosity of each single image. This is
valid for all three approaches but, of course, we select the right wavelet plane
according to a priori knowledge of the faults in input image. To compare the
output of each method we have considered only the plane w
4
.
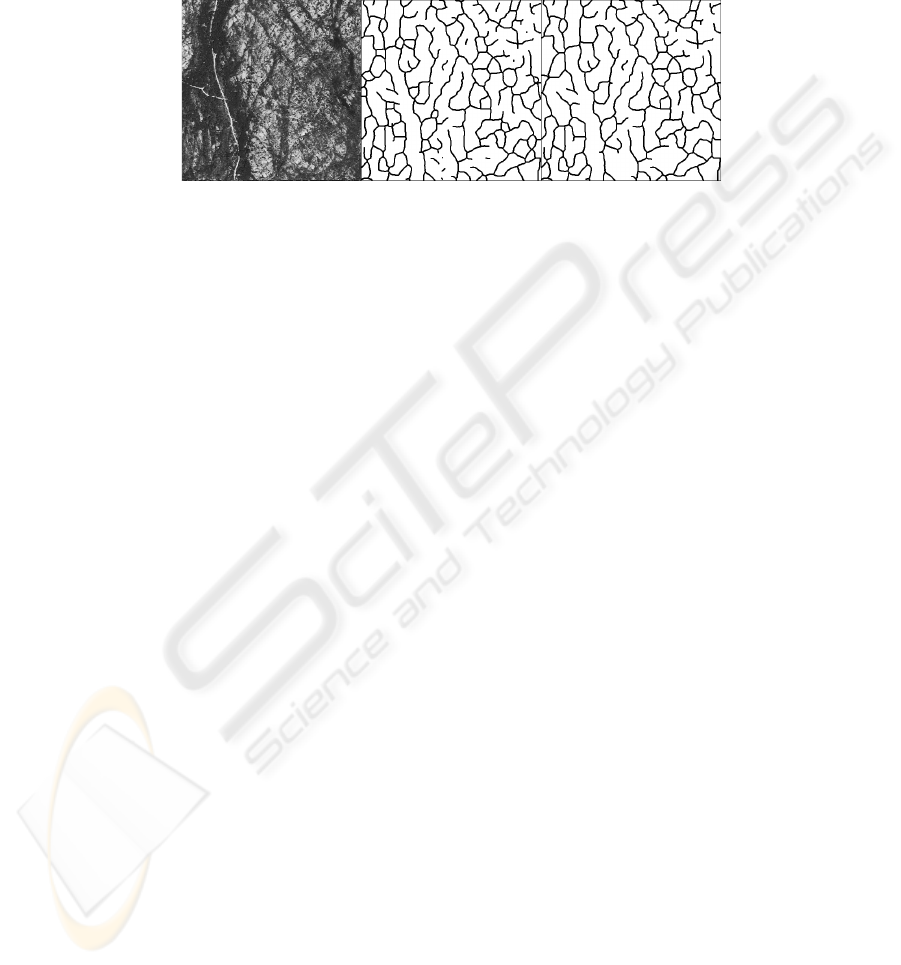
In order to put better in evidence the faults we calculate the skeleton of the
selected binary images [13]. Usually the corresponding graph is too dense and
we have to prune it. In particular, many of its cycles are due to small bright
spots inside the faults of the input image. We have verified that, before of the
skeletonization, it is sufficient to eliminate in the binary images all black 4-
connected components which are too small (area less than 35 pixels in the case
of morphology or area less then 150 pixels in the case of the wavelet transform)
and/or too dark in the original photo (average luminosity less than 25%). Please
note that a white zone in the binary images correspond to a possible fault in the
original photo. Finally, we remove all arcs (considered as 8-connected objects)
that are isolated and too small (length less than 20 pixels). Figures 2 illustrates
the main steps of the pruning procedure. We want to stress that we have carried
out an extensive simulation to determine a suitable set of parameters needed to
threshold the auxiliary images or to prune the graphs.
We have analyzed high resolution photos, provided by Dipartimento di Scienze
della Terra in Siena, Italy, [14] or freely downloaded from the web [15, 16]. The
results obtained by the pipeline of methods above describ ed have been compared
with those carried out by photo-interpreters. See Figure 3 for the output rela-
tive to Figure 2a. To verify the robustness of the whole procedure we have also
introduced a range of uniform salt and pepper noise. A successive convolution
with a Gaussian filter was enough to disperse the influence of the wrong pixels.
Morphological opening is simple and fast, thanks to the use of temporary
look-up tables. In practice, filtering along each orientation can be applied in
linear time, so allowing to reach a high angular resolution. We have observed
that pairs of close and parallel faults are often misinterpreted as one bigger line.
Fuzzy correlation makes use of floating point operations and has a time com-
plexity proportional to the size of the structuring element. As for mathematical
morphology, the choice of the structuring element is very important and we
have defined many of them to correctly detect faults with different shapes and
dimensions. Nevertheless, it has correctly detected most of the faults.
219
A faster execution and a higher accuracy have been achieved by the wavelet
transform. Its multiresolution support natively puts in evidence structures with
different sizes and, despite the other two previous approaches, the skeleton is
smooth. Moreover, no custom kernel is needed to analyze faults with particular
slopes, which can be extracted during the pruning phase.
Fig. 2. a: a detail (400 × 400) of Figure 1a. b,c: raw and cleaned skeletons of w
4
.
5 Conclusions and perspectives
A new unsupervised detector of geological faults in high resolution photos taken
from satellite and airplane has been presented. This can be useful in solving
several tasks such as digital cartography, underground or superficial character-
ization, geographical information interpretation. At present, geologists have to
analyze almost by hand a huge amount data, to be integrated with information
obtained through campaigns. The whole procedure is expensive and very slow.
We have compared three different methods based on mathematical morphol-
ogy, fuzzy morphology and wavelet analysis. The first two methods process the
input image through structuring elements with a variety of sizes and orienta-
tions and have returned similar outputs. Their accuracy strictly depends on the
choice of the shape of the structuring element and are sensitive to the change of
luminosity. For example, they usually tend to cross the streets, when partially
occluded by trees. The latter approach has shown to be fast and accurate when
putting in evidence both fine and coarse outlines. It is based on a sequence of
convolutions with a compact kernel. Moreover, it does not privilege faults with a
specific direction and therefore there is no need to consider a set of orientations.
A skeletonization let us reduce the size of the binarized regions of interest,
obtained by any one of the above methods. The new image can be considered
as a graph and its arcs represent pieces of faults. We have demonstrated that
pruning the graph enhances the final result though more efforts can still be made
in order to make the shape of the graph smoother by computing, for example,
the minimum spanning tree and regularization formulas.
The efficiency of the detector has been verified with a database of real images
and we have introduced salt and pepper noise to test the robustness of the meth-
ods. We have roughly estimated the running time, showing that these algorithms
are fast enough. Moreover, it should be relatively easy to embed them on the
actual software, such as Imagine and ArcView, already employed by geologists.
Acknowledgements
We wish to thank the group of Dipartimento di Scienze della Terra in Siena, led
by Prof. Carmignani, and esp ecially Dr. Disperati for providing the input data.
220
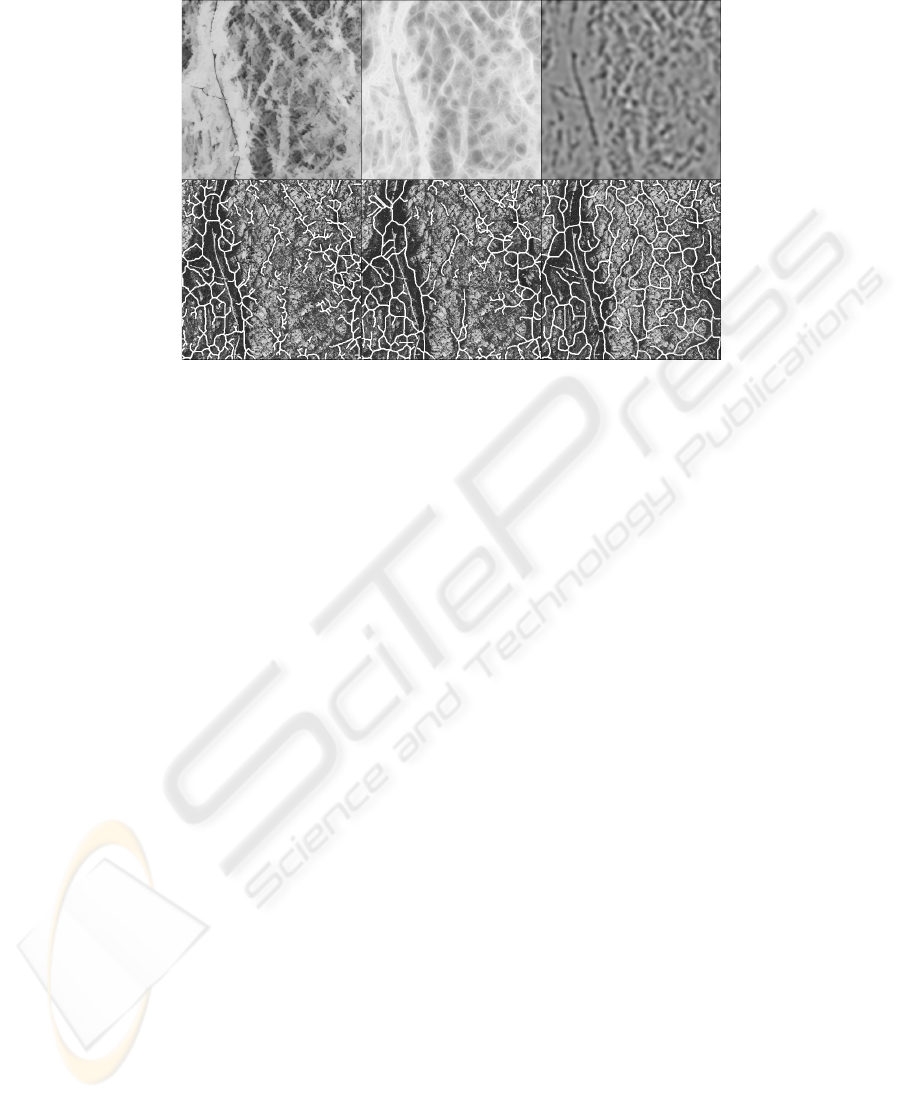
Fig. 3. a: morphological opening. b: fuzzy correlation. c : w
4
of the `a trous algorithm.
g–i: cleaned skeletons of (a–c) superimposed on Figure 2a.
References
1. Serra J., Image analysis and mathematical morphology, Academic Press (1982).
2. Soille P., Morphological Image Analysis, Springer-Verlag, Second Edition (2003).
3. Zheng X., Gong P. and Strome M., Characterizing spatial structure of tree canopy
using colour photographs and mathematical morphology, Canadian Journal of Remote
Sensing, Vol.21, No.4 (1995) 420–428.
4. Ansoult M., Soille P. and Loodts J., Mathematical morphology: a tool for automated
GIS data acquisition from scanned thematic maps, Photogrammetric Engineering and
Remote Sensing, Vol.56, No.9 (1990) 1263–1271.
5. Destival I., Mathematical morphology applied to remote sensing, Acta Astronautica,
Vol.13, No.6-7 (1986) 371–385.
6. Soille P. and Talbot H., Directional Morphological Filtering, IEEE Transactions on
Pattern Analysis and Machine Intelligence, Vol.23, No.11 (2001) 1313–1329.
7. Di Ges`u V., Maccarone M.C. and Tripiciano M., Mathematical Morphology Based
on Fuzzy Operators, Fuzzy Logic, Kluwer Academic Publishers (1993) 477–486.
8. Maccarone M.C., Fuzzy mathematical morphology: concepts and applications, Vision
Mo deling and Information Coding, Vistas in Astronomy, Vol.40, No.4 (1996) 469–477.
9. Holschneider M., Kronland-Martinet R., Morlet J. and Tchamitchian Ph., The `a
trous Algorithm, CPT-88/P.2215, Berlin (1988) 1–22.
10. Grossmann A. and Morlet J., Decomposition of Hardy functions into square inte-
grable wavelets of constant shape, SIAM J. Math. Anal., Vol.15, No.4 (1984) 723–736.
11. Daubechies I., Ten Lectures on Wavelets, CBMS-NSF Regional Conference Series
on Applied Mathematics, Vol.61, Soc. for Industrial and Applied Mathematics (1992).
12. Graps A., An Introduction to Wavelets, IEEE Computational Science and Engi-
neering, Vol.2, No.2 (1995).
13. Klette R. and Zamperoni P., Handbook of Image Processing Operators, John Wiley
& Sons (1996).
14. Memorie descrittive della Carta Geologica d’Italia, Istituto Poligrafico e Zecca dello
Stato, Vol.60, (2001).
15. The SIRIUS Spot Image catalogue, http://sirius.spotimage.fr
16. The MODIS web, http://modis.gsfc.nasa.gov
221
