
Source Extraction Representing Thumb and Little Finger
Cortical Networks and Intra-Hand-Area Evoked
Synchrony
Franca Tecchio
1-2
, Sara Graziadio
3
, Giulia Barbati
2
, Roberto Sigismondi
4
,
Filippo Zappasodi
1-2
, Camillo Porcaro
2
, Giancarlo Valente
4
, Marco Balsi
4
1
ISTC-CNR, Unità MEG, Osp Fatebenefratelli, Isola Tiberina, 00186 Roma, Italy
2
AFaR, Ospedale Fatebenefratelli, Isola Tiberina,
00186 Roma, Italy
3
Dip. Fisica e
4
Dip. Ingegneria Elettronica,
Univ. ‘La Sapienza’, Roma, Italy
Abstract. A novel cerebral source extraction method is proposed (Functional
Source Separation, FSS) starting from extra-cephalic magnetoencephalographic
(MEG) signals in humans, based on source functional reactivity to the external
stimulation. Their activity is obtained all along the rest state and during proc-
essing of a simple separate sensory stimuli of thumb or little finger. This
method provides cerebral sources describing thumb and little finger primary
representations, as demonstrated by their higher responsiveness to the corre-
sponding finger stimuli and their different positions consistent with the homun-
cular organization. A dynamical index describing intra-regional synchrony was
introduced, which showed higher levels when stimulating the thumb with re-
spect to little finger stimulation, selectively in the gamma band ([33, 44]Hz).
This indicates that the stimulation of a functionally prevalent finger (thumb) ac-
tivates a cortical network more synchronized in the gamma band than a non-
prevalent one (little finger).
1 Introduction
1.1 Synchronization phenomena
Brain processes mainly rely on changes in the synchronization of the recruited neu-
ronal firing (functional binding and unbinding, [5]). Not only the synchronization
among cerebral regions processing different stimuli features involving quite distant
cortical areas are mandatory, but also the synchronization within a restricted cortical
area.
Starting from extra-cephalic data, direct signals from recording channels are often
used: if synchronization across distant areas is studied, this method is quite reliable,
Tecchio F., Graziadio S., Barbati G., Sigismondi R., Zappasodi F., Porcaro C., Valente G. and Balsi M. (2005).
Source Extraction Representing Thumb and Little Finger Cortical Networks and Intra-Hand-Area Evoked Synchrony.
In Proceedings of the 1st International Workshop on Biosignal Processing and Classification, pages 12-18
DOI: 10.5220/0001192400120018
Copyright
c
SciTePress

but in the present study the limited region devoted to the hand control is under inves-
tigation. In this case all channels are significantly sensitive to the activity from the
same neuronal pools. For this reason, it is mandatory to achieve synchronization
indexes between neuronal source activities instead of between channel signals.
To extract cerebral sources starting from the recorded magnetic fields, the MEG
community main approach is to solve the so called ‘inverse problem’ [4], which iden-
tifies cerebral currents on the base of their spatial positions. In our region of interest,
the neural networks are highly interconnected and superimposed (for a review see
[12]) pulling the ‘inverse problem’ to its spatial resolution boundaries. Moreover, it
implies to fix the source model, which suitability changes across different steps of the
cerebral processing, and this limits the analysis when a neuronal group is followed
from the rest state to task involvement. For this reason, blind source separation meth-
ods (BSS, Comon 1994; [1]) could be more suitable, discriminating different sources
on the base of their generated signal statistical properties.
In particular, an ad hoc BSS algorithm was implemented, based on a priori infor-
mation about sources functional properties. Once obtained single fingers cortical
representation sources, a dynamic synchrony index was defined, related to the cortical
network including both finger representations. This intra-regional index was studied
when stimulating each finger separately.
2 Methods
2.1 Experimental Paradigm
Magnetoencephalographic (MEG) data were recorded from 15 healthy volunteers
(mean age 31±2 years, 7 females and 8 males) during separate electrical stimulation
of their right thumb or little finger. Ring electrodes were used to deliver around 300
stimuli with standard features (0.2-ms-long electric pulses, 631 ms inter-stimulus
interval, stimulus intensities set at about twice the subject’s sensory threshold, [9],
Tecchio et al 1997).
A 28-channel MEG system (developed by our own group, Tecchio et al, 1997) op-
erating in a magnetically shielded room (Vacuumschmeltze GMBH) was used, the
active channels being regularly distributed on a spherical surface (13.5 cm of curva-
ture radius) and covering a total area of about 180 cm
2
. Brain magnetic fields were
recorded from the left rolandic region, i.e. contralaterally to the stimulation, after
positioning the central sensor of the MEG apparatus over the C3 site of the Interna-
tional 10–20 electroencephalographic system. The noise spectral density of each
magnetic sensor was 5–7 fT/√Hz at 1 Hz. Data were analogically bandpass filtered
through a [0.16–250] Hz and gathered at 1000 Hz sampling rate.
2.2 Functional source separation (FSS)
Some of the authors (Valente et al submitted) have developed a modified Independent
Component Analysis (ICA) procedure, that explicitly uses additional information to
13

bias the decomposition algorithm towards solutions that satisfy physiological assump-
tions, instead of extracting sources only on the base of their signals statistical inde-
pendence. The method is based on optimizing a modified contrast function:
HJF
λ
+
=
(1)
where J is any function as normally used for ICA, while H accounts for the prior
information we have on sources. Parameter
λ
is used to weigh the two parts of the
contrast function. If
λ
is set to zero, maximization of F leads to pure independence.
The optimization is performed by simulated annealing, so that function H can have
any form (e.g. it does not need to be differentiable).
To identify neural networks devoted to individual finger central representation, the
sources ‘reactivity’ to the stimuli was taken into account. This was defined as fol-
lows: the evoked activity (EA) was computed separately for the two sensorial stimu-
lations, by averaging signal epochs centered on the corresponding stimulus (EA
T
,
thumb; EA
L
, little finger) and subtracting the mean of the values in the ‘no response’
baseline interval [-30.-10] ms, t=0 corresponding to the stimulus arrival.
The reactivity coefficient (R) was computed as:
∑∑
−
−==
−=
10
30
X
40
20
X
)(EA)(EA
tt
X
ttR
(2)
with X = T, L. The time interval ranging from 20 to 40 ms includes the maximum
activation.
The constraint function H
X
is then chosen as:
(
)
kRH
XX
,
ϕ
=
,
where
()
⎩
⎨
⎧
≤
=
else 1
when
X
kRkR
R
X
X
ϕ
(3)
and k is a suitable parameter quantifying the required response
The shape of function
ϕ
is such that the constraint is inactive when response is
greater than k, so as to define an admissible region where the optimization is only
driven by J. Parameter
λ
is chosen large enough H
X
dominates the search. Therefore,
a constrained optimization procedure is obtained.
To obtain the time behavior of the neural networks devoted to different finger corti-
cal representations during different activation states, each functional source was ex-
tracted using data recorded during the two fingers separate stimulation.
To separate contributions representing individual fingers, we extracted a single
component by using the constraint H
T
, obtaining the functional source describing the
time evolution of the thumb cortical representation (FS
T
). Then, the procedure was
repeated using H
L
to obtain FS
L
.
2.3 Functional source characteristics
Functional source evoked activities. To demonstrate that the extracted functional
sources are more responsive to the stimulation of the district they represent, each
14

source was observed when stimulating both the fingers. In particular the above de-
fined indexes R
T
and R
L
describing respectively the responsiveness when stimulating
thumb and little finger, were calculated for each of the two functional sources FS
T
and FS
L
.
Functional source localizations. To describe spatial characteristics of the sources
FS
L
and FS
T
, they were separately retro-projected. To be noted that when a single
component is retro-projected, as in our case, the field distribution is time independent,
up to the scaling factor FS
X
(t); this means that the localization algorithm produces
fixed positions and directions along time, and only the source strength varies with
time proportionally to FS
X
(t). As localization procedure a moving Equivalent Current
Dipole (ECD) model inside an homogeneous best-fitted sphere was applied. The
ECD characteristics (explained variance = e.v.; spatial position) were calculated for
each functional source. ECD coordinates, if e.v.
> 85%, were expressed in a right-
handed Cartesian coordinate system defined on the basis of three anatomical land-
marks.
For comparison, the positions of the known markers of signal arrival in the pri-
mary sensory cortex, occurring at around 20 ms from the stimulus (M20), were calcu-
lated by standard procedure (Tecchio et al 1997, 2002) of averaging original channel
signals.
2.4 Dynamic intra-regional synchrony index
The intra-regional synchrony index was obtained by the following 4 steps and exam-
ined in the two different conditions of thumb and little finger stimulations.
1) The FS
T
(t) and FS
L
(t) signals were forward-backward band pass filtered in
the classical alpha (α= [7, 13]Hz), beta (β = [14, 32]Hz) and gamma (γ= [33,
44]Hz) bands (FS
b
X
(t), where X = T, L; b = α, β, γ) by a Butterworth filter
of the second order;
2) the FS
b
X
(t) analytic signals were calculated, defined as:
)()()(
bbb
tihtFSta
XXX
+=
(4)
where h
b
X
(t) is the FS
b
X
(t) Hilbert transform;
3) the module of the two analytical signals in each band were calculated and
averaged across all stimuli epochs separately as:
∑
=
=
X
N
k
kX
X
aveXX
ta
N
ta
1
bb
|)(|
1
|)(|
(5)
where t
k
∈ [T
1
, T
2
], with T
2
-T
1
the intervals length and N
X
is the number of
considered stimuli for each finger X = {T, L} and aveX indicates that the av-
eraged is performed for each analytical signal across T and L finger stimuli
separately.
4) the indexes calculated at steps (3) were finally averaged across the two
sources, obtaining a whole region of interest dynamic synchronization index
(Syn
b
(t); it was estimated during both fingers separate stimulation. In par-
15

ticular the maximal value following each stimulation (Syn
b
M
) was chosen to
compare synchronization levels during thumb and little finger stimulations,
in the 3 frequency bands.
3 Results
3.1 Functional extracted source characteristics
Functional source evoked activities. The activity of the source representing a finger,
is compared when stimulating the finger itself with respect to when an other finger is
stimulated. To do this, the defined indexes R
T
and R
L
, describing respectively the
responsiveness to thumb and little finger stimulations, were both considered for each
of the two functional sources FS
L
and FS
T
. The evoked activity of the two extracted
sources, resulted significantly higher when the finger that source represents was
stimulated (Table 1, R
T
> R
L
for S
T
, p <.001 ; R
L
> R
T
for S
L
, p <.001).
Table 1. Average and s.d. across subjects of FS
T
and FS
L
characteristics: spatial position (x-
axis passing through the two preauricolar points directed rightward, positive y-axis passing
through the nasion, positive z-axis consequently) with their explained variance (e.v.); the
evoked activity indexes (R
T
and R
L
). Mean M20
T
and M20
L
positions are reported with their
mean latency (lat) .
FSS
lat
(ms) e.v.
x
(mm)
y
(mm)
z
(mm) R
T
R
L
FS
T
0.97±0.04 -38±11 10±13 89±10 13.4±4.8 6.2±5.2
FS
L
0.95±0.07 -34±11 6±12 99±14 7.4±5.6 12.6±4.9
M20
T
24±2 0.96±0.18 -42±8 11±11 91±10
M20
L
24±2 0.94±0.06 -33±10 6±13 100±10
Functional source localization. Dipole coordinates (x,y,z) were computed
for the two sources FS
T
and FS
L
in our 15 subjects group.
A General Linear Model (GLM) for repeated measures was estimated to test dif-
ferences in source localization: as dependent variables the 3-dimensional coordi-
nates vectors obtained for each subject were used, with the two levels Finger
(Thumb, Little) as within-subjects factor. Factor Finger resulted significant
(F(3,12)=8.675, =0.001, Table 1), corresponding to FS
T
position significantly lat-
eral, anterior and lower with respect to FS
L
one. This was in agreement with M20
ECD positions when stimulating respectively thumb and little finger evaluated in
same subjects (Table1).
3.2 Dynamic intra-regional synchronization index
The index Syn
b
M
showed strongly different properties in the different bands follow-
ing stimulation of the two fingers. In fact, in alpha and beta bands no effect was ob-
served (paired t-test p>.200), while in gamma band the Syn
γ
M
was significantly
16
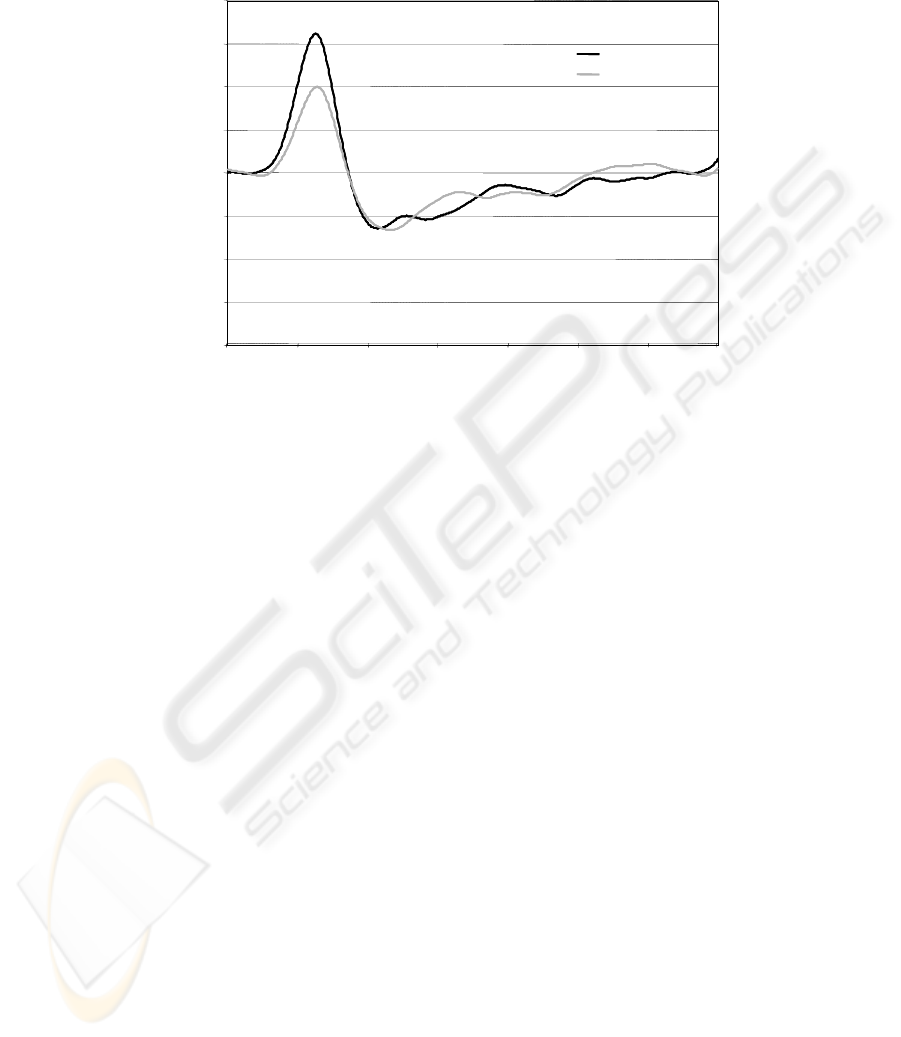
higher for the thumb stimulation than for the little finger (0.039 ± 0.020 and 0.026 ±
0.021 respectively, p=.013, fig. 1).
-0,04
-0,03
-0,02
-0,01
0
0,01
0,02
0,03
0,04
1
Thumb
Li ttle f i ng e r
0 100 200 300 400 500
600
-100
ms
Syn
γ
-0,04
-0,03
-0,02
-0,01
0
0,01
0,02
0,03
0,04
1
Thumb
Li ttle f i ng e r
0 100 200 300 400 5000 100 200 300 400 500
600600
-100-100
ms
Syn
γ
Fig. 1. Temporal dynamic of the synchronization index in the gamma band, being t=0 the
sensory stimulus arrival on thumb (black) or little finger (grey).
4 Conclusion
The two functional extracted sources related to thumb (FS
T
) and little finger (FS
L
)
cortical representations, resulted significantly different both with respect to their
spatial positions and their activation properties. In fact FS
T
position was significantly
lateral, anterior and lower with respect to FS
L
one, as physiologically expected. This
positioning of the hand sensory representation boundaries completely agrees with the
classical homuncular somatotopy [10] [15], as also recently confirmed by other tech-
niques (e.g. functional Magnetic Resonance Imaging, [7], optical imaging, [14]).
The thumb cortical representation showed strongly higher activity evoked by
thumb than little finger stimulation and the same selective properties showed the little
finger cortical representation. This strengthens that extracted sources are significantly
different and suitable representing cortical networks specifically connected to differ-
ent fingers.
Using these functional extracted sources activities, an intra-regional synchroniza-
tion index was introduced. In particular it resulted finger-dependent in the gamma
band [5] [6], whereas in beta and alpha bands the synchronization index was similar
for thumb and little finger stimulations. Oscillatory activity within alpha and beta
frequency bands is well known to react to sensorimotor tasks in the whole rolandic
region [11]; the gamma band is instead characteristic of focal network activations [3].
17

Gamma band is moreover indicated with increasing evidences as playing a pivotal
role in perceptive [8] and cognitive motor tasks [13]. Present result, of gamma band
synchronization higher following stimulation of the thumb than of the little finger,
will suggest a new phenomenon: taking into account that thumb is functionally preva-
lent with respect to little finger, it could be hypothesized that the synchronization in
the gamma band codes for functional prevalence in the sensory hand representation,
strengthening previous results of our group [16].
References
1. Barbati, G., Porcaro, C., Zappasodi, F., Rossini, P.M., Tecchio, F, 2004. Optimization of
ICA approach for artifact identification and removal in MEG signals. Clinical Neurophysi-
ology 115:1220-32
2. Comon, P, 1994. Independent component analysis: a new concept? Signal processing
36:287-314
3. Crone, N.E., Miglioretti, D.L., Gordon, B., Lesser, R.P., 1998. Functional mapping of
human sensorimotor cortex with electrocorticographic spectral analysis: II. Event-related
synchronization in the gamma band, Brain 121: 2301– 2315.
4. Del Gratta, C., Pizzella, V., Tecchio, F., Romani, G.-L, 2001. Magnetoencephalography - a
non invasive brain imaging method with 1 ms time resolution Rep Prog Phys 64:1759-1814
5. Engel, A.K., Fries, P., Singer, W, 2001. Dynamic predictions: oscillations and synchrony
in top-down processing. Nat Rev Neurosci 2: 704-716
6. Engel, A.K., Singer, W., 2001. Temporal binding and the neural correlates of sensory
awareness, Trends Cogn. Sci. 5: 16– 25.
7. Hlustik P, Solodkin A, Gullapalli RP, Noll DC, Small SL, 2001. Somatotopy in human
primary motor and somatosensory hand representations revisited. Cereb Cortex. 11: 312-
321.
8. Meador, K.J., Ray, P.G., Echauz, J.R., Loring, D.W., Vachtsevanos, G.J., 2002 Gamma
coherence and conscious perception. Neurology 59: 847-854.
9. Okada, Y.C., Tanenbaum, R., Williamson, S.J., Kaufman, L., 1984. Somatotopic organiza-
tion of the human somatosensory cortex revealed by neuromagnetic measurements. Exp
Brain Res 56:197-205.
10. Penfield W, Boldrey E, 1937. Somatic motor and sensory representation in the cerebral
cortex of man as studied by electrical stimulation. Brain 60: 389–443.
11. Pfurtscheller, G., Lopes da Silva, F.H., 1999. Event-related EEG/MEG synchronization and
desynchronization: basic principles, Clin. Neurophysiol. 110: 1842– 1857.
12. Poggio, T., Bizzi, E, 2004. Generalization in vision and motor control. Nature 431:768-74.
13. Schoffelen, J.M., Oostenveld, R., Fries, P., 2005. Neuronal coherence as a mechanism of
effective corticospinal interaction. Science 308:111-113.
14. Shoham, D., Grinvald, A., 2001. The cortical representation of the hand in macaque and
human area S-I: high resolution optical imaging, J. Neurosci. 21: 6820–6835.
15. Tecchio, F., Padua, L., Aprile, I., Rossini, P.M., 2002. Carpal Tunnel Syndrome modifies
sensory hand cortical somatotopy: a MEG study. Hum Brain Mapping 17:28–36
16. Tecchio, F., Babiloni, C., Zappasodi, F., Vecchio, F., Pizzella, V., Romani, G.-L., Rossini,
P.M, 2003. Gamma synchronization in human primary somatosensory cortex as revealed
by somatosensory evoked neuromagnetic fields. Brain Res 986: 63-70
17.
Valente, G., Filosa, G., De Martino, F., Formisano, E., Balsi, M.: Optimizing ICA using
prior information. In BPC’05 Biosignals Processing and Classification - The International
Conference on Informatics in control, Automation and Robotics, Barcelona, Spain.
18
