
IMPLICIT INDICATORS FOR INTERESTING WEB PAGES
Hyoung-rae Kim, Philip K. Chan
Department of Computer Sciences, Florida Institute of Technology, Melbourne, FL. 32901, USA
Keywords: Implicit interest indicator, user interests, user behaviour, web pages
Abstract: A user’s interest in a web page can be estimated by unobtrusively (implicitly) observing his or her
behaviour rather than asking for feedback directly (explicitly). Implicit methods are naturally less accurate
than explicit methods, but they do not waste a user’s time or effort. Implicit indicators of a user’s interests
can also be used to create models that change with a user’s interests over time. Research has shown that a
user’s behaviour is related to his/her interest in a web page. We evaluate previously studied implicit
indicators and examine the time spent on a page in more detail. For example, we observe whether a user is
really looking at the monitor when we measure the time spent on a web page. Our results indicate that the
duration is related to a user’s interest of a web page regardless a user’s attention to the web page.
1 INTRODUCTION
To help users navigate the web, researchers have
been developing intelligent techniques for building
user profiles based on web pages that are of interest
to individual users (Kim and Chan, 2003; Granka et
al., 2004; Goecks and Shavlik, 2000; Chan, 1999).
Determining a user’s interests can be performed
explicitly by asking the user, or implicitly by
observing the user’s behaviour. Implicit indicators
are usually less accurate than explicit indicators
(Watson et al., 1998). However, implicit indicators
do not require any extra time or effort from the user
and can adapt to changes in the user’s interests over
time. To implicitly measure user interest we need to
identify reliable implicit indicators.
One of the major user interest indicators
identified by researchers is duration, or the time
spent on a web page (Granka et al., 2004; Jung,
2001; Claypool et al., 2001; Resnick et al., 1994;
Liberman, 1995; Kim et al., 2001; Oard et al., 1998).
However, some research indicate that duration may
not be an accurate measure of user interest (Jung,
2001). We suspect that this is because the duration
indicator often does not account for the user’s
absence. For example, a user may leave a web page
open while doing something else. Therefore, in this
research, a user’s duration on a web page is divided
into three types depending on if the browser is open
(complete duration), if the browser is the active
application (active window duration), and if the user
is looking at the screen (look at it duration). We also
study new implicit indicators (memo) that have not
been evaluated in previous research. We divided the
web pages visited during our evaluation into two
groups: (1) web pages that a user visited more than
once and viewed for the longest duration, and (2) all
web pages that were visited more than once.
The main contributions of this work are:
• Our experiments indicate that complete duration,
active window duration, look at it duration, and
distance of mouse movement are reliable
indicators for more users than other indicators –
8 users out of 11;
• The distance of mouse movement is often as
accurate as indicators based on duration, and it
can be the most practical indicator since it is
simple to detect and is more robust than active
window duration against the case of user’s
absence;
• For the bookmark, save, print, and memo
indicators, more than 95% of the pages were
correctly scored as “interested”.
The rest of this paper is organized as follows:
Section 2 presents related work on implicit
indicators; Section 3 provides a detailed description
of implicit indicators studied; Section 4 covers our
evaluation of implicit indicators; Section 5 presents
and analyzes our results; and Section 6 summarizes
our work.
270
Kim H. and K. Chan P. (2005).
IMPLICIT INDICATORS FOR INTERESTING WEB PAGES.
In Proceedings of the First International Conference on Web Information Systems and Technologies, pages 270-277
DOI: 10.5220/0001235202700277
Copyright
c
SciTePress

2 RELATED WORK
Jung (2001) developed Kixbrowser, a custom web
browser that recorded users’ explicit rating for web
pages and their actions: mouse clicks, highlight, key
input, size, copy, rollover, mouse movement, add to
bookmark, select all, page source, print, forward,
stop, duration, the number of visits (frequency), and
recency during users’ browsing. He developed
individual linear and nonlinear regression models to
predict the explicit rating. His results indicate that
the number of mouse clicks is the most accurate
indicator for predicting a user’s interest level.
CuriousBrowser (Claypool et al., 2001) is a web
browser that recorded the actions (implicit ratings)
and explicit ratings of users. This browser was used
to record mouse clicks, mouse movement, scrolling
and elapsed time. The results indicate that the time
spent on a page, the amount of scrolling on a page,
and the combination of time and scrolling has a
strong correlation with explicit interest.
Those two experiments show some inconsistency.
Jung (2001) said mouse click is a good indicator, but
Claypool et al. (2001) did not. Jung (2001) found
that duration and scrollbar movement are not very
predictive of a user’s interest, but Claypool et al.
(2001) said they are good indicators. In this work,
we examine the duration implicit indicator in more
detail. We divide the duration into three types:
complete duration, active window duration, and look
at it duration. Our complete duration is different
from the duration in Jung’s (2001) work. His
duration includes the downloading time of a web
page, but ours does not. Another difference is that
we split the data into two sets, “visits with maximum
duration” and “all visits,” while Jung (2001) only
used “all visits” data set.
Powerize (Kim et al., 2001) is a content-based
information filtering and retrieval system that uses
an explicit user interest model. They also reported a
way to implement the implicit feedback technique of
user modelling for Powerize. They also found that
observing the printing of web pages along with
reading time can increase the prediction rate for
detecting relevant documents. Our experiment
evaluates a larger number of implicit indicators and
divides duration into more detail.
Goecks and Shavlik (2000) proposed an
approach for an intelligent web browser that is able
to learn a user’s interest without the need for
explicitly rating pages. They measured mouse
movement and scrolling activity in addition to user
browsing activity (e.g., navigation history). We
extend these existing implicit interest indicators in
this research.
Granka et al. (2004) measured eye-tracking to
determine how the displayed web pages are actually
viewed. Their experimental environment was
restricted to a search results. However, in our
experiment we let a user navigate to any web page
and do normal tasks such as using chat programs or
word processors during the experiment. Another
difference is that we use head orientation instead of
eye-tracking. Our experiment is also valuable since
there are cases where an application does not have
devices for tracking a user’s eyes.
3 IMPLICIT INTEREST
INDICATORS
The time spent on a web page is one of the most
intuitive candidates for user interest indicators. This
paper thoroughly examines whether duration is
related to a user’s interest. This section describes
duration, as well as other user interest indicators that
will be examined. The reason why each indicator is
chosen is explained and how each indicator is
measured is described.
3.1 Complete Duration
A user may tend to spend more time on pages that he
or she finds interesting, so we record the duration
spent on a web page. The complete duration is
defined as the time interval between the time a user
opens and leaves a web page. Some web pages
contain many images that delay the downloading
time, so we start measuring the duration after the
entire page is loaded. Thus, the complete duration
won’t be affected by the connection speed, the
amount of Internet traffic, or the CPU speed. The
complete duration for a web page can be calculated
by subtracting the time of finishing downloading the
current web page from the time of leaving the web
page. The complete duration is different from the
duration used by Jung (2001). His duration includes
the downloading time of a web page.
3.2 Active Window Duration
Most modern operating systems allow a user to
multitask, or run several applications at the same
time. A user may write a report or chat while
browsing a web page. Those other applications can
be unrelated to the contents of a web page. If a user
spent one hour writing a homework paper with a
web browser minimized, the complete duration of
the web page could be one hour. This is very likely
to provide erroneous indications of user interest. In
IMPLICIT INDICATORS FOR INTERESTING WEB PAGES
271

order to avoid being affected by this problem, we
determine whether a web browser is active or not.
The time that a web browser is inactive is subtracted
from the complete duration. We call this duration
active window duration since we count the time only
when a web browser is active.
3.3 Look At It Duration
Users are not always reading a web page when the
web browser is active. They can easily be talking to
friends or having a coffee break, while the web
browser is active. The active window duration can
easily be more than 30 minutes if a user leaves the
browser active and goes for a coffee break. We may
be able to detect the user’s absence by detecting the
action of mouse movement. However, a better
solution is to use a camera that detects a user’s face
orientation. A camera can even check if a user is
looking at the web browser or if his attention is
diverted. This duration will be more accurate than
the active window duration in terms of checking
user’s attention to a web page. Since this duration
counts the time that a user is looking at the web
browser, we call it look at it duration. The look at it
duration can be calculated by subtracting the time
when a user does not look at the browser from active
window duration.
3.4 Distance of Mouse Movement
Many people move their mouse while reading the
contents of a web page. Mouse movement can occur
while looking at an interesting image, or when
pointing at interesting objects. We hypothesize that
the more distance a mouse moves, the more a user
be interested in the web page. This indicator was
also examined by Jung (2001). Our distance is a
little bit different from his in a sense of detecting
overall mouse movement. He counted on the mouse
movement only when the mouse point is inside the
active browser. The distance of mouse movement is
detected by its x and y coordinates on a monitor
every 100 milliseconds. The formula is
∑
−
=
−
−=
1
1
1
))()(()(_
t
i
ii
tPtPDistpixelsmovementmouse
where time t is the active window duration, the time
interval, t
i
-t
i-1
, is 100 milliseconds, P(t
i
) is a mouse
location with x and y coordinates at time t
i
, and the
Dist function is a Euclidean distance.
3.5 Number of Mouse Clicks
People use “click” to hyperlink to another web page.
In addition, clicking can be considered as a habitual
behaviour (Jung, 2001). Clicking can be a way of
expressing our emotions such as if some people are
happy to find a product that they were looking for
(e.g., book), then they can click the object several
times repeatedly. This indicator was examined in
Kixbrowser (Jung, 2001), Curious browser
(Claypool et al., 2001), Goeck’s browser (Goecks et
al., 2000), and Letizia (Liberman, 1995). We use the
hypothesis that the greater the number of mouse
clicks on a web page is, the more a user is interested
in it (Jung, 2001). The number of mouse clicks is
counted every time a mouse button is clicked.
3.6 Number of Scrollbar Clicks
The length of many web pages is longer than the
height of a monitor. If a user finds a web page
interesting, he or she may read further down the web
page. A user can scroll down a web page either by
clicking or by dragging the scrollbar. Those events
are counted separately. The number of scrollbar
clicks is counted every time a user clicks scrollbar.
As a user scrolls a web page up and down by
clicking, the number of scrollbar clicks increases.
Jung (2001), Goecks et al. (2000), and Claypool et
al. (2001) measured this event and reported that it is
a good indicator. We hypothesize that we will also
find that the number of scrollbar clicks is correlated
with a user’s interest in the web page.
3.7 Distance of Scrollbar Movement
A user can also scroll a web page up and down by
dragging a scrollbar. Those dragging events can
occur several times while a user is reading a web
page. The distance of scrollbar movement for an
occasion, E, can be calculated by measuring the
mouse movement every 100 milliseconds. By
summing all distances of scrollbar movement for all
occasions, the distance of a scrollbar movement for
a web page can be calculated. The formula is
∑∑
−
=
−
−=
1)(
1
1
)()()(_
jE
i
ii
E
j
tPtPpixelsmovementscrollbar
where E is the number of times the scrollbar is
pressed, time E(j) is the duration that the scrollbar is
dragged in a single dragging event, and t
i
-t
i-1
, is 100
milliseconds. We hypothesize that greater scrollbar
WEBIST 2005 - WEB INTERFACES AND APPLICATIONS
272

movement is correlated with more user interest in a
web page.
3.8 Number of Key UP and Down
When scrolling a web page, some people use the
“up” and “down” keys instead of the scrollbar. This
indicator is similar to the number of scrollbar clicks
and the distance of scrollbar movement. The
hypothesis is that the greater the number of key up
and down presses, the more a user is interested in the
web page. This event is measured by increasing the
count every time a user strikes up or down keys.
Curious browser (Claypool et al., 2001) and Jung
(2001) measured keyboard activities. But they did
not measure the key up and down for measuring
scrollbar movement.
3.9 Size of Highlighting Text
While reading a web page, if a user copies some
contents of the web page it probably means that the
user is interested in the web page. Furthermore, a
user can also habitually highlight portions of the
page that they are interested in, which is a sign that
the user is interested in the page. We assume that the
more a user highlights in a web page, the more a
user is interested in that web page. A user can
highlight several different sentences in a web page
for several different occasions. We sum all
highlighted contents at the end. Jung (2001)
examined this indicator. He used the Euclidean
distance between two points of pressing and
releasing. The weakness of his measure resides in
neglecting the texts highlighted horizontally when
the mouse moves vertically. In order to solve this
problem, we assumed a character is 5 pixels, each
line has 80 characters, and distance between two
lines is 20 pixels on average. The formula is
∑
+×=
E
j
jj
DistXDistYtextnghighlighti 5/8020/_
where E is the number of occasions when
highlighting occurs, DistY is the vertical distance
between two points, and DistX is the horizontal
distance between two points.
3.10 Other Indicators
We also measure other less-frequently-used events
such as bookmark, save, print, and memo. A user
usually bookmarks web pages in order to visit them
later again. We assume those bookmarked web
pages are interesting to a user (Li et al., 1999;
Maarek and Ben-Shaul, 1996). This can be measured
by detecting bookmarking activities during the
experiment. Users save important/interesting web
pages in their hard drive by using the “Save As”
command. This also implies that those saved web
pages are interesting to users (Liberman, 1995). This
indicator is also counted by detecting saving
activities during the users’ browsing. Most web
browsers allow users to print web pages. These
printed web pages are likely to be interesting to
users (Kim et al., 2001). The Memo box is a new
feature added in our system. It allows a user to write
down a short description on a web page. When the
user visits the web page again, the message shows
up on the Memo box automatically. We assume that
if a user is interested in a web page, then s/he will
write a note about the web page.
4 EXPERIMENTS
4.1 Experimental Data and
Procedures
For our experiments, we built a web browser that
can record the indicators described above from
user’s behaviour and used a camera to record images
for identifying face orientation. 11 data sets were
collected from 11 different users. Of the 11 human
subjects, 4 were undergraduate students, 6 were
graduate students, and 1 was a Ph.D. student. In
terms of major, 7 were Computer Sciences, 2 were
Aeronautical Sciences, 1 was Chemical Engineering,
and 1 was Marine Biology. Each subject was asked
to spend a total of 2 hours at the computer.
Volunteers were allowed to leave the computer and
do other non-computer work. All volunteers were
encouraged to behave as normal as possible. To get
a variety of behaviours, we asked the volunteers to
divide their activities into multiple sessions, each of
which does not exceed 1 hour.
In the browser used in our experiment, most of
the functions in Microsoft Explore 6.0 were
implemented. The popup windows were disabled
initially, but our browser allowed a user to change
the option to able them. We asked users to
bookmark more than 10 pages, save more than 5
pages, print more than 5 pages, use Memo on more
than 5 pages. The browser had Memo box so that
users can write small note on a web page. Our web
browser takes a picture of a user every 2 seconds.
Every time a user leaved a web page, the web
browser asked the user how much they are interested
IMPLICIT INDICATORS FOR INTERESTING WEB PAGES
273

in the web page – there were 5 scales between “not
interested” (1) and “very interested” (5).
The interests were subjective to each user. The
system had a “rescore” button to allow changing the
score marked in the previous visit. The browser was
written in Visual Studio .NET and ran on a Pentium
4 CPU. The Operating System was Windows XP.
4.2 Evaluation Criteria
Two evaluation criteria are used: how accurate an
indicator could predict a user’s interest and how
many users an indicator can accurately predict their
interests. Instead of mixing all users’ data sets
together, each individual data set was analysed
separately so that we could clearly observe whether
some indicator predicted certain individual’s
interests more accurately than other indicators. An
indicator that could predict the score with a lower
variance is a more accurate indicator. In order to
evaluate each indicator to see which one is more
predictable, we use ANOVA (Analysis of Variance).
Jung (2001) treated the scale as numeric scale and
applied linear regression, multiple linear regression,
etc. methods. We, however, consider the interest
scores as discrete values and check if the indicator
values are significantly different among the five
different interest scores provided by the user. For
ANOVA, we use a confidence level of 95% to
indicate statistical significance. If the difference is
significant, indicator values can predict interest
scores. As a second criterion, we count the number
of users predicted accurately by an indicator. This
criterion indicates how reliable the indicator is
across different users.
5 RESULTS AND ANALYSIS
This section analyzes the data collected from the
users who participated in our experiment. There are
two data sets: “visits with maximum duration” and
“all visits”. For web pages that a user visited more
than once, the score might be the same, but all other
information (the durations or number of mouse
clicks etc.) may be different. The “visits with
maximum duration” data set contains only page
views where the user stayed for the longest period of
time. The maximum duration is determined using
complete duration, which is described in Section
3.1. The “all visits” data set contains all page views
collected in our experiment. We believe that the
“visits with maximum duration” data set is more
useful than “all visits”, because users do not tend to
read the web page again if they know about a web
page before (Billsus and Pazzani, 1999). On
average, users had 182 visits in the “visits with
maximum duration” data set, and users had 291
visits in the data set of “all visits”. Jung (2001) only
used the “all visits” data set.
5.1 Visits with Maximum Duration
Table 1 shows the experimental results with “visits
with maximum duration” data set. The table
summarized which indicator is reliable for which
volunteer. The first column is users, the second
column is complete duration (Complete), the third
column is active window duration (Active), the rest
columns are for look at it duration (LookAtIt),
distance of mouse movement (MousMove), number
of mouse clicks (MousClk#), number of scrollbar
clicks (ScrolCk#), distance of scrollbar movement
(ScrolMov), number of key up and down
(KeyUpDn#), and size of highlighting text
(Highligh). They are implicit indicators examined.
The “√” mark means that the hypothesis for the
indicator is statistically significant and “x” means
that it was not. The mark “?” means it was
unavailable to apply statistical methods to the data
due to various reasons such as limited data. The last
row indicates how many users’ interests can be
predicted by that indicator – the number of “√” mark
for each column.
The Indicators Complete, Active, LookAtIt, and
MousMove were able to classify 8 users’ interests
towards web pages (73%). The indicator of
MousClk# was the next best indicator, which was
recognized as the best in (Jung, 2001). Indicators of
KeyUpDn# and Highligh were able to distinguish the
lowest number of users’ interests – KeyUpDn# was
significant to only 1 user and Highligh was
significant to only 3 users. No indicator could
predict User 5’s interest. The indicator Highligh
could predict User 7, but no other indicators could
do his interest. Indicator of ScrolMov was also valid
only to User 4. These results indicate that there was
no indicator that was valid to all of the users.
Depending on users, an indicator may or may not be
valid.
We expected that the LookAtIt would be the
most accurate indicator, but the result did not turn
out as we expected. We suspect that this was
because they did not move around much and looked
at the monitor most of the time while browsing. In
practice, a user can use a browser longer period.
WEBIST 2005 - WEB INTERFACES AND APPLICATIONS
274
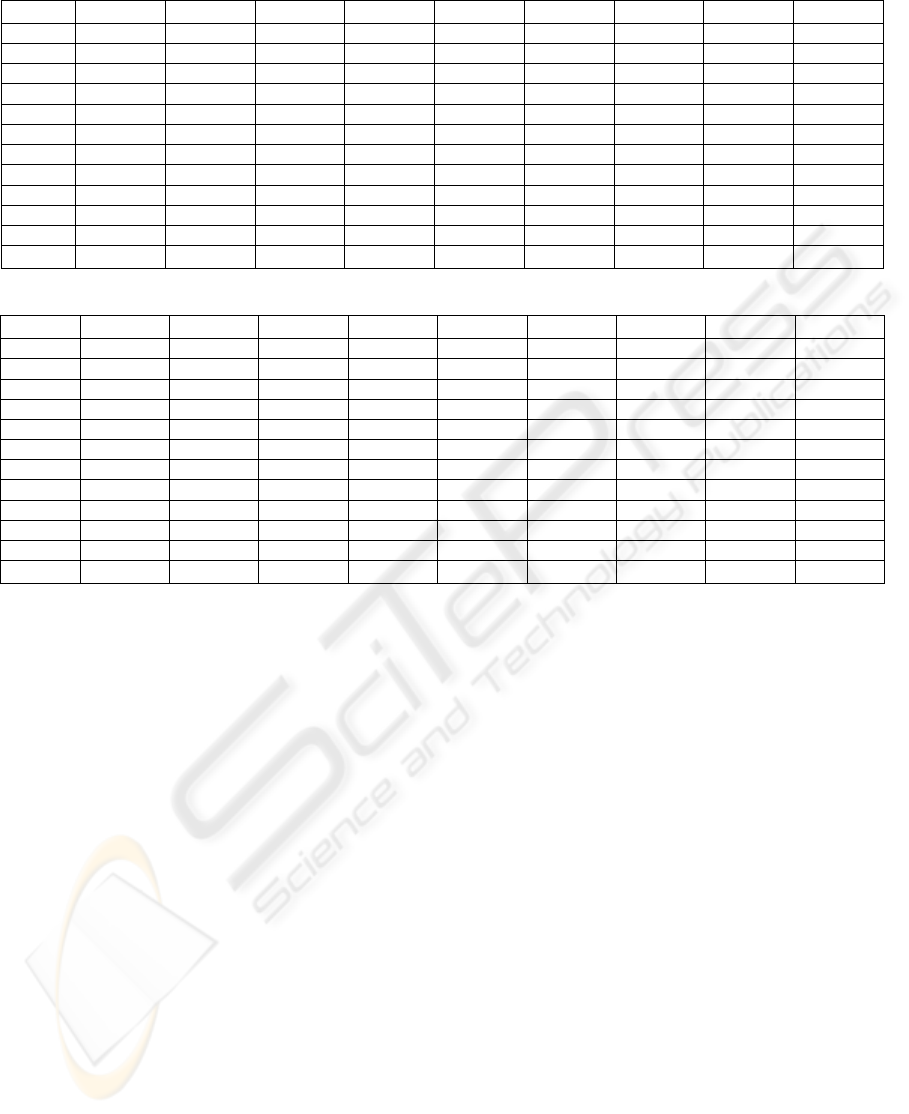
Table 1: ANOVA test with “visits with maximum duration” data set
Users Complete Active LookAtIt MousMove
MousClk#
ScrolCk# ScrolMov
KeyUpDn#
Highligh
User 1
√
√
√
√
√
×
×
?
×
User 2
√
√
√
√
√
√
√
√
√
User 3
√
√
√
√
√
√
√
?
√
User 4
×
×
×
×
×
×
√
?
×
User 5
×
×
×
×
×
×
×
?
×
User 6
√
√
√
√
×
√
×
×
×
User 7
×
×
×
×
×
×
×
×
√
User 8
√
√
√
√
√
×
×
×
×
User 9
√
√
√
√
×
×
×
×
×
User 10
√
√
√
√
√
√
√
×
×
User 11
√
√
√
√
×
×
×
×
×
Sum 8 8 8 8 5 4 4 1 3
Table 2: ANOVA test with the data set of “all visits”
Users Complete Active LookAtIt MousMove
MousClk#
ScrolCk# ScrolMov
KeyUpDn#
Highligh
User 1
√
√
√
√
√
√
√
?
×
User 2
√
√
√
√
√
√
×
√
×
User 3
√
√
√
√
√
√
√
?
√
User 4
×
×
×
×
×
√
×
×
×
User 5
×
×
×
×
×
×
×
×
×
User 6
√
√
√
√
√
√
×
×
×
User 7
×
×
×
×
×
×
×
×
√
User 8
√
√
√
√
√
×
×
×
√
U
ser 9
√
√
√
√
√
×
×
×
×
User 10
×
×
×
×
×
×
√
√
×
User 11
√
√
√
√
×
×
√
√
×
Sum 7 7 7 7 6 5 4 3 3
5.2 All Visits
Table 2 shows the experimental results with the data
set of “all visits”. The table summarized which
indicator is reliable for which volunteer. The
implicit interest indicators Complete, Active,
LookAtIt, and MousMove were able to predict the
interests of 7 users (64%) that participated in the
study. This means that when we used “visits with
maximum duration” we could predict more number
of users – 8 users. This result notifies that the “visits
with maximum duration” data set is more useful in
predicting users’ interests more accurately than the
data set of “all visits”.
The indicator of MousClk# was the next best
indicator and was able to predict the interests of 6
users. User interest was more accurately predicted
by the MousClk# implicit indicator in the “all visits”
data set, but this was less predictable than the 4
indicators above. This result is similar to the
findings of Jung (2001), who also used the “all
visits” data set, and where MouseClk# was found to
be the best indicator. No indicator could predict User
5’s interest. User 4’s interest could be predicted only
by ScrolCk# and User 7’s interest could be predicted
only by Highligh. These results also indicate that
different indicators can predict different people.
5.3 Other Indicators
The implicit interest indicators bookmark, save,
print, and memo had lower usage than the other
indicators mentioned above. Users bookmarked or
printed only a few web pages while surfing web.
Users did not bookmark all interesting web pages, so
if used alone they cannot be used to identify all of
the pages that a user finds interesting. However,
these indicators have a very high accuracy when
they are used, and they can be used together with
other more frequently used indicators.
The results for the bookmark, save, print, and
memo indicators are listed in Table 3. The first
column is the indicator, the second column is the
score (1-“not interested”, 3-“interested” and 5-“very
interested”); the third column is the sum of the
usages for the specified indicator across 11
volunteers. The rest of the columns are detailed
usages for each user. The value in each cell is the
number of times that the indicator was used. The
number of times each indicator was used varied
significantly between each individual. For instance,
for some users the bookmark indicator was a clearer
indicator than other ones – user 5; for some other
users save was a clearer indicator – user 10.
IMPLICIT INDICATORS FOR INTERESTING WEB PAGES
275
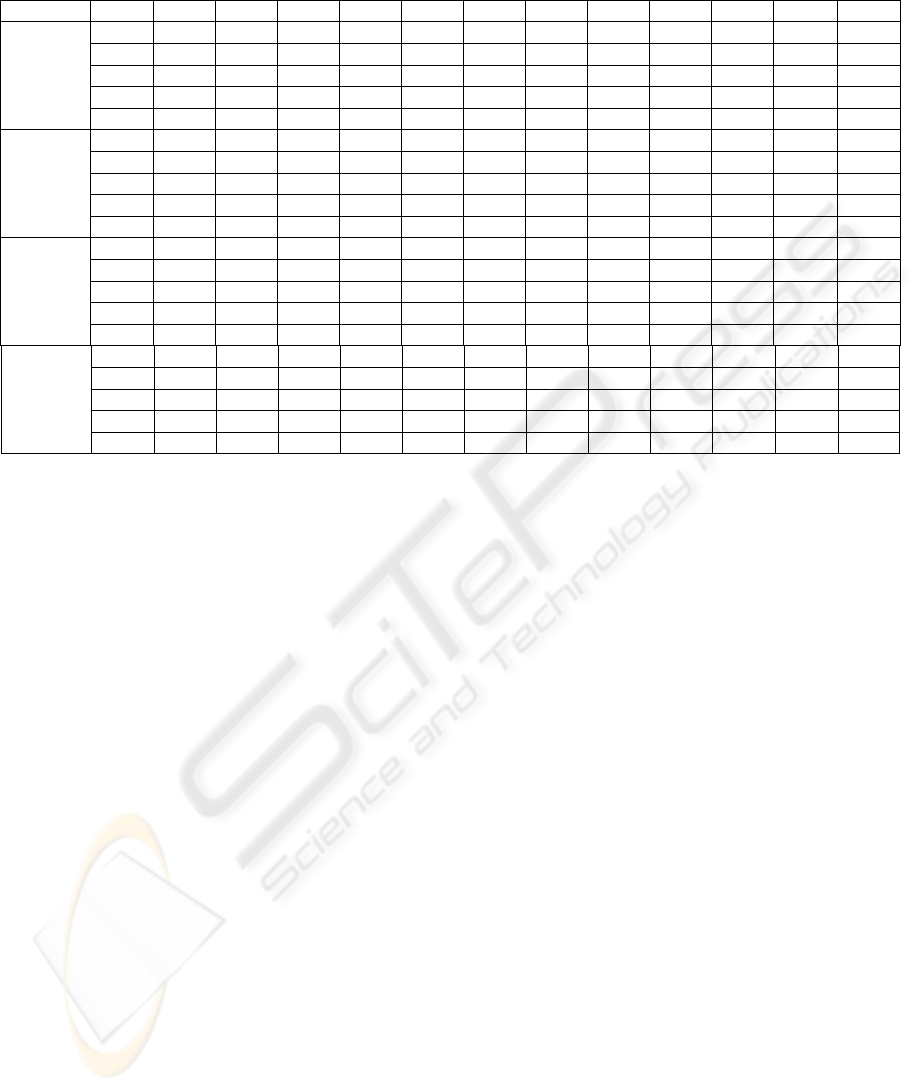
Table 3: Results of bookmark, save, print, memo indicators
Indicator
Score
User1
User2
User3
User4
User5
User6
User7
User8
User9
User10
User11
Sum
1
0
0
0
0
0
0
0
0
0
0
0
0
2
0
1
0
0
0
0
1
2
0
0
1
5
3
2
6
1
2
1
0
2
5
0
2
3
24
4
2
3
0
1
6
4
1
2
3
7
2
31
bookmark
5
5
7
6
1
9
1
3
1
2
6
0
41
1
0
0
0
0
0
0
0
0
0
0
0
0
2
0
0
0
0
0
0
0
1
0
0
0
1
3
0
8
1
0
0
1
0
2
0
0
0
12
4
0
4
3
5
0
1
0
0
0
2
0
15
save
5
0
10
6
0
1
3
0
1
2
6
0
29
1
0
0
0
0
0
0
0
0
0
0
0
0
2
0
0
0
0
0
0
0
0
0
0
0
0
3
0
2
0
1
0
1
5
2
0
0
1
12
4
0
4
1
2
0
1
0
0
0
2
1
11
print
5
0
15
7
1
3
4
2
1
4
3
0
40
1
0
0
0
0
0
0
0
0
0
0
0
0
2
0
0
0
0
0
0
0
0
1
0
0
1
3
0
3
0
1
0
1
2
1
0
0
0
8
4
0
1
2
2
1
0
0
0
3
1
2
12
memo
5
0
9
10
0
2
0
0
1
1
7
0
30
Of the web pages that were bookmarked, 95% of
them were scored more than or equal to “interested”
(3). The sum of bookmarked web pages across 11
volunteers tells us that users rarely bookmarked
uninteresting web pages – no bookmarked web
pages were scored as “not interested”. User 1 and 5
showed a tendency of book-marking more web
pages as the web pages became more interesting.
These results indicate that bookmark was a good
indicator.
Saved web pages were scored more than or equal
to “interested” 98% of the time. This means that
users rarely saved uninteresting web pages. Saved
web pages were never scored as “not interested.” All
users, except user 8, only saved pages that they
found interesting. Users 3, 6, and 10 showed a
tendency of saving more web pages as the web
pages became more interesting. These results
indicate that save is a good implicit indicator.
All of the printed web pages were scored more
than or equal to “interested”. This result tells us that
users did not print uninteresting web pages. User 2,
3, 6, and 10 showed a tendency of saving more web
pages as the web pages were getting more
interesting. These results indicate that print is a good
indicator.
Nearly all (98%) of the memoed web pages were
scored more than or equal to “interested.” No
memoed web pages were scored as “not interested.”
No user other than user 9 memoed on web pages for
which he was less than “interested.” User 1 did not
used the memo, but user 3, 5, and 10 showed a
tendency of saving more memos as the web pages
became more interesting. These results also indicate
that memo is a good indicator.
6 CONCLUSION
This paper identifies several implicit indicators that
can be used to determine a user’s interest in a web
page. This paper evaluates both previously studied
implicit indicators and several new implicit
indicators. All indicators examined were complete
duration, active window duration, look at it
duration, distance of mouse movement, number of
mouse clicks, number of scrollbar clicks, distance of
scrollbar movement, number of key up and down,
and size of highlighting text. The data was 11 users’
implicit indicator data and a 1-5 interest rating of
each page. During our experiment volunteers were
encouraged to behave normally.
Two evaluation criteria were used: (1) how
accurately an indicator can predict users’ interests
and (2) how many users’ interests an indicator can
predict. We used two data sets: “visits with
maximum duration” and “all visits”. We believe that
“visits with maximum duration” is more useful for
prediction than “all visits”, because users did not
tend to read a web page again, once users read about
the web page (Billsus and Pazzani, 1999). Over the
data set containing “visits with maximum duration”,
the implicit interest indicators Complete, Active,
LookAtIt, and MousMove were able to predict 8
users’ interests towards web pages, but over the data
WEBIST 2005 - WEB INTERFACES AND APPLICATIONS
276

set of “all visits” the indicators were able to predict
only 7 users’ interests. These facts also notified that
the “visits with maximum duration” data set is more
useful in predicting users’ interests more accurately
than the data set of “all visits”.
The experimental results told us that MousMove
could be the most practical indicator because this
event is simple to detect and has less risk than
Active. If a user leaves a web page open and leaves
the room, the MousMove indicator will not be
affected. The indicator of MousClk# was the next
best indicator, which was recognized as the best in
(Jung, 2001). Our results indicate that there was no
indicator that was valid for all users. Depending on
the user, an indicator may or may not be valid.
We also evaluated less-frequently-used indicators
of user interest: bookmark, save, print, and memo.
When we divided the data set less than “interested”
and more than or equal to “interested”, “95% of the
bookmarked web pages, 98% of the saved web
pages, 100% of the printed web pages, and 98% of
the memoed web pages belonged to the score of
more than or equal to “interested”.
We expected that the LookAtIt indicator would
be more accurate than the Complete and Active
indicators, but the results for all three were similar.
We believe that this was because volunteers did not
move around much and looked at the monitor most
of the time while browsing. Perhaps a longer
evaluation would give more accurate results for the
LookAtIt indicator, since users would act more
naturally after more than 1 or 2 hours of surfing. We
can combine this indicator to an application for
personalized web search results in the future. The
collected interesting web pages for a user can be
used for building a user interest hierarchy.
ACKNOWLEDGEMENT
We appreciate Stan Salvador’s valuable comments
and all volunteers who participated in our
experiment: Akiki, Michel, Timmy, Matthew
Scripter, Ayanna, Da-hee Jung, Jae-gon Park, Ji-
hoon, Jun-on, Chris Tanner, and Grant Beems.
REFERENCES
Billsus, D., and Pazzani, M.J., 1999. A Hybrid User
Model for News Story Classification, In Conf. User
Modeling.
Chan, P.K., 1999. A non-invasive learning approach to
building web user profiles, In KDD-99 Workshop on
Web Usage Analysis and User Profiling, 7-12.
Claypool, M., Le, P., Wased, M., and Brown, D., 2001.
Implicit interest indicators. In Proc. 6th international
conference on Intelligent User Interfaces, 33-40.
Goecks, J. and Shavlik, J., 2000. Learning users’ interests
by unobtrusively observing their normal behavior. In
Proc. 5th international conference on Intelligent user
interfaces, 129-132.
Granka, L. A., Joachims, T., Gay, G., 2004. Eye-tracking
analysis of user behavior in WWW search. In Proc.
27th annual international conference on Research and
development in information retrieval.
Jung, K., 2001. Modeling web user interest with implicit
indicators, Master Thesis, Florida Institute of
Technology.
Kim, H. and Chan, P. K., 2003. Learning implicit user
interest hierarchy for context in personalization. In
International Conference on Intelligent User
Interfaces, 101-108.
Kim, J., Oard, D.W., and Romanik, K., 2001. Using
implicit feedback for user modeling in internet and
intranet searching. College of Library and Information
Services, University of Maryland.
Li, W.S., Vu, Q., Agrawal, D., Hara, Y., and Takano, H.,
1999. PowerBookmarks: A System for personalizable
web information organization, sharing, and
management. In Proc. of the 8th Intl. World Wide Web
Conference, Toronto, Canada.
Liberman, H., 1995. Letizia: An Agent that assists web
browsing. In Proc. IJCAI, 924-929.
Maarek, Y.S. and Ben-Shaul, I.Z., 1996. Automatically
organizing bookmarks per contents, In Proc. 5
th
International World Wide Web Conference.
Oard, D. and Kim, J., 1998. Implicit feedback for
recommendation systems. In Proc. AAAI Workshop on
Recommendation Systems.
Resnick, P., Iacovou, N., Suchak, M., Bergstrom, P., and
Riedl, J., 1994. GroupLens: An open architecture for
collaborative filtering of netnews. In Proc. the
Conference on Computer Supported Cooperative
Work. ACM Press, 175-186.
Watson, A. and Sasse, M. A., 1998. Measuring perceived
quality of speech and video in multimedia
conferencing applications. In Proc. ACM Multimedia
Conference, 55-60.
IMPLICIT INDICATORS FOR INTERESTING WEB PAGES
277
