
A NOVEL REAL-TIME SELF-SIMILAR TRAFFIC
DETECTOR/FILTER TO IMPROVE THE RELIABILI
TY OF A
TCP BASED END-TO-END CLIENT/SERVER IN
TERACTION
PATH FOR SHORTER ROUNDTRIP TIME
Wilfred W. K. Lin, Allan K. Y. Wong, Richard S.L. Wu
Department of Computing, The Hong Kong Polytechnic University, Hung Hom, Kowloon, Hong Kong S.A.R.
Tharam S. Dillon
Faculty of Infornation Technology, University of Technology Sydney,Broadway, Sydney, Australia
Keywords: real-time traffic pattern detection (RTPD), stationary, asymptotically second-order self-similarity, CAB,
Gaussian property, fractal
Abstract: The self-similarity (
2
S ) filter is proposed for real-time applications. It can be used independently or as an
extra component for the enhanced RTPD (real-time traffic pattern detector) or E-RTPD. The
2
S
filter
basis is the “asymptotically second-order self-similarity” concept (alternatively called
statistical
OSS
nd
2 or OSSS
nd
2 ) for stationary time series. The focus is the IAT (inter-arrival times)
traffic. The filter is original because similar approaches are not found in the literature for detecting self-
similar traffic patterns on the fly. Different experiments confirm that with help form the
2
S
filter the FLC
(Fuzzy Logic Controller) dynamic buffer size tuner control more accurately. As a result the FLC improves
the reliability of the client/server interaction path leading to shorter roundtrip time (RTT).
1 INTRODUCTION
It is hard to harness the roundtrip time (RTT) of an
end-to-end client/server interaction path over a TCP
channel in time-critical applications. The problem is
the heterogeneity and sheer size of the Internet. If
the path error probability for retransmissions is
ρ
,
the average number of trials (ANT) for successful
transmission is
)1(
1
lim)]1([
1
1
ρ
ρρ
−
≈−
∞→
∞
=
−
∑
j
j
j
j
The value
ρ
encapsulates different faults and
errors, and one of them is caused by buffer overflow
along the end-to-end interaction path. There are two
levels of buffer overflows: a) system/router level
that includes all activities inside the TCP channel,
and b) user level that involves the buffer at the
receiving end. Methods to prevent network
congestion that causes router buffer overflow
include active queue management (AQM) (Braden,
1998). One effective approach to eliminate user-
level buffer overflow to improve the end-to-end path
reliability is dynamic buffer size tuning (Wong,
2002). The accuracy and stability of the tuning
process, however, are affected by the Internet traffic
patterns in terms of messages' inter-arrival times
(IAT). To resolve this problem the previous real-
time traffic pattern detector (RTPD) (Lin, 2004) was
proposed. With the detected results the dynamic
buffer size tuners can mitigate/nullify the ill effects
by traffic on system stability and performance in a
dynamic fashion. The RTPD, however, does not
detect self-similar traffic, and this leads to the
proposal of the self-similarity (
2
S
) filter in this
paper. Inclusion of the
2
S
filter into RTPD created
the enhanced RTPD (E-RTPD). It will be
demonstrated later how E-RTPD helps the Fuzzy
Logic Controller (Lin, 2004B) self-tune better on the
fly to gain more accurate and smoother user-level
dynamic buffer size tuning and shorter RTT as a
result.
The Internet involves many different client/server
interaction protocols (Lewandowski, 1998), and its
94
W. K. Lin W., K. Y. Wong A., S.L. Wu R. and S. Dillon T. (2005).
A NOVEL REAL-TIME SELF-SIMILAR TRAFFIC DETECTOR/FILTER TO IMPROVE THE RELIABILITY OF A TCP BASED END-TO-END
CLIENT/SERVER INTERACTION PATH FOR SHORTER ROUNDTRIP TIME.
In Proceedings of the Second International Conference on e-Business and Telecommunication Networks, pages 94-101
DOI: 10.5220/0001413000940101
Copyright
c
SciTePress
traffic follows the power law (Medina, 2000). Over
time the traffic in any part of the Internet may
change suddenly, for example, from LRD (long-
range dependence) to SRD (short-range
dependence) or vice versa (Willinger, 2003). Using
the Hurst (H) effect (i.e.
ss
H (Taqqu, 2003)) as the
yardstick then
15.0
<
< H
is for LRD and
5.00 ≤< H
for SRD. If }1:{ ≥= lXX
m
l
m
is
a time series aggregate of size
m
in a stochastic
process X, its autocorrelation function (ACF)
(correleogram) is
∑
−
=
N
l
mm
rlr
1
)(
, where
m
r
is the
autocorrelation of
m
X
and l for the aggregate level.
The ACF of LRD traffic is non-summable (i.e.
∞≈
∑
∞→
−
N
l
m
r
1
), but it is summable for SRD (i.e.
∞<
∑
∞→
−
N
l
m
r
1
).
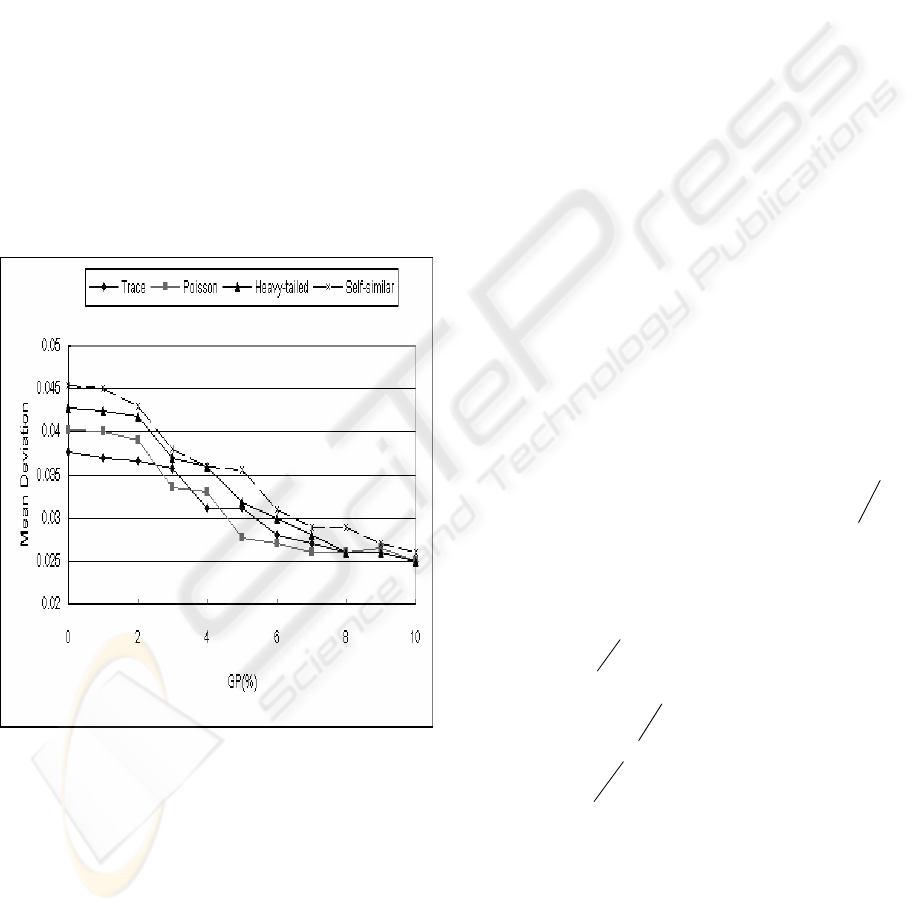
Figure 1: Internet traffic impact on FLC accuracy
It is impractical to monitor the overwhelming
number of network parameters in the Internet to
harness the client/server RTT. A practical approach
is to treat the Internet as a “black box” and measure
the end-to-end RTT to interpret the channel
behavior. This is the IEPM (Internet End-to-End
Performance Measurement (Cottrel, 1999))
approach. Any sudden changes in the IAT traffic
pattern affect the performance of applications
running on the Internet. The traffic’s ill effect on the
FLC stability and accuracy (Lin, 2004) is an
example. Figure 1 shows how the mean deviations
(MD) from the FLC steady-state reference due to
traffic changes in one deployment. Traffic self-
similarity (or self-affinity) consistently produces the
largest deviations compared to heavy-tailed and
Markovian traffic. Two objects are geometrically
similar if one is derived from another by linear
scaling, rotation or translation. The GP% (gradient
percentage) in Figure 1 is a derivative (D) control
parameter in FLC. For the same GP value different
traffic patterns produce different MD values. The
reconfigurable version of the FLC uses the RTPD to
detect a traffic pattern on the fly and utilizes the
result to neutralize traffic ill effects by choosing the
correct GP value accordingly (Lin, 2004). The
RTPD differentiates LRD from SRD and identifies
heavy-tailed traffic, but it does not detect self-
similar patterns. Combining the previous RTPD
model with the self-similarity (
2
S ) filter (or simply
2
S filter) creates the enhanced RTPD (E-RTPD),
which has the capability to identify self-similarity
and compute its dimension (D). If an object is
geometrically, recursively split into similar pieces,
then at the
th
K
iteration step the total measure of the
object is “product of the number of similar pieces
and
D
O ”. The parameter O is the splitting
resolution or reduction. The Cantor Set is an
example in which a line segment of interval [0,1] is
drawn as the first step (i.e.
0=K
). This line is then
manipulated by the subsequent steps: a) divide the
line into three equal portions (i.e. resolution is
3
1
)
and remove the middle portion (i.e.
1
=
K
), b)
remove the middle portions from the remaining two
(i.e.
2
=
K
), and c) repeat the last step ad infinitum.
The
th
K
iteration produces
K
2
similar line segments
of length
K
s )
3
1
(=
each. The Cantor Set’s self-
similarity dimension is defined by the
formula
=
s
D
K
2
*
K
)
3
1
(
or alternatively
63.0]
))3log((
))2log((
[ ≈=
K
K
D
s
An object is fractal if its D value is non-integer.
Different non-converging dimension definitions
exist, the Cantor Set provides only a conceptual
basis. A stochastic process
)(tX is
ss
H , self-
similar and fractal, provided that its two finite-
dimensional distributions ,
)(atX and )(tXa
H
are identical for
0>a
. That is, the following
expression holds:
A NOVEL REAL-TIME SELF-SIMILAR TRAFFIC DETECTOR/FILTER TO IMPROVE THE RELIABILITY OF A
TCP BASED END-TO-END CLIENT/SERVER INTERACTION PATH FOR SHORTER ROUNDTRIP TIME
95

≡)}()...(),({
21 n
atXatXatX
)}(),...({
1 n
HH
atXatXa
;
≡ means equality and H is the scaling exponent.
2 RELATED WORK
The previous RTPD is enhanced from the traditional
R/S (rescaled adjusted statistics) approach for non-
real-time (i.e. “post-mortem”) applications. The
enhanced R/S (i.e. E-R/S) is a real-time
“
filtrationSRRTM ++ /
3
” package.
The
RT
M
3
element is a micro Convergence
Algorithm (CA) or MCA implementation (Wong,
2001). The CA is the technique adopted from the
IEPM (Internet End-to-End Performance
Measurement) problem domain (Cottrel, 1999). The
MCA, which predicts the mean of a traffic
waveform quickly and accurately, operates as a
logical object to be invoked for service anytime and
anywhere by message passing. It helps the R/S
mechanism differentiates SRD from LRD on-line.
The filtration process activates an appropriate filter
to identify the exact traffic pattern; for example, the
modified QQ-plot filter identifies heavy-tailed
distributions. The main RTPD contribution is that it
can be a part of any time-critical application, which
uses it to detect traffic patterns on the fly. These
applications can then use the detected result to self-
tune for better system performance (Lin, 2004).
Similar to its R/S predecessor, the E-R/S calculates
the Hurst (H) parameter/value but on-line. The
15.0 << H
range means LRD traffic (e.g. heavy-
tailed and self-similar traces) and
5.00 ≤< H
for
SRD (short-range dependence, e.g. Markovian
traffic) (Molnar, 1999).
The traditional R/S is defined by
)var(
},...,2,1:min{},....,2,1:max{
X
kiWkiW
S
R
ii
=
−
=
=
The parameter
i
W is computed as
∑
=
−=
i
m
mi
XXW
1
)(
for i=1,2,…k, where
X
is the mean of.
∑
=
=
k
i
i
X
k
X
1
1
The best value for k is usually found by trial and
error, and this becomes the drawback because R/S
accuracy and speed depend on k. The R/S ratio is the
rescaled range of the stochastic process X over a
time interval k,
},...2,1:{ kiX
i
= . A useful R/S
feature is the log-log of
H
k
S
R
)
2
(≈
, which
yields the H value.
The CA operation, which is derived from the
Central Limit Theorem, is summarized by the
equations: (2.1) and (2.2). The estimated mean
i
M in the
th
i prediction cycle is based on the fixed
F (flush limit) number of data samples. The cycle
time therefore depends on the interval for collecting
the F samples. It was confirmed previously that
i
M has the fastest convergence for F=14 (Wong,
2001). Other parameters include: a)
1−i
M
is the
feedback of the last predicted mean to the current
i
M prediction cycle, b)
i
j
m
is the j
th
data item
sampled in the current i
th
i
M
cycle,
)1(,....,3,2,1
−
=
Fj
, and c)
0
M
is the first
data sample when the MCA had started running. In
the E-R/S,
i
M replaces
X
to yield .
∑
=
−=
i
m
imi
MXW
1
)(
This replacement makes the E-R/S more suitable for
real-time applications because the number of data
items (e.g. IAT) to calculate
i
W becomes
predictable (i.e.
14
=
F
). In real-life applications
∑
=
=
k
i
i
X
k
X
1
1
will need much longer computation
time than
i
M for two reasons: a)
k
is usually larger
than
F
, and b) the IAT among
i
X could be so
large that the product of “
k
and average IAT”
means a significant time delay. In an E-RTPD
implementation the E-/RS,
RT
M
3
and filter
modules are running in parallel. The E-RTPD
execution time depends on the E-R/S module, which
has the longest execution. The Intel’s VTune
Performance Analyzer (Intel VTune, 2002) records
from the Java RTPD prototype the following
average execution times in clock cycles: 981 for E-
R/S, 250 for
RT
M
3
, and 520 for the modified QQ-
plot filter. The novel
2
S
filter provides RTPD with
the additional capability to quickly detect self-
similar traffic on the fly.
1);2.2.(..........
);1.2(..........
1
00
1
1
1
≥=
+
=
=
=
−=
=
−
∑
imM
F
mM
M
i
j
Fj
j
i
ji
i
ICETE 2005 - GLOBAL COMMUNICATION INFORMATION SYSTEMS AND SERVICES
96

3 THE SELF-SIMILARITY
FILTER
LRD traffic has at two basic components: heavy-
tailed and self-similar. The proposed self-similarity
(
2
S ) filter differentiates heavy-tailed IAT patterns
from self-similar ones. Self-similarity in many
fractal point processes results from heavy-tailed
distributions, for example, FRP (Fractal Renewal
Process) inter-arrival times. The heavy-tailed
property, however, is not a necessary condition for
self-similarity because at least the FSNDPP
(Fractal-Shot-Noise-Driven Poisson Process) does
not have heavy-tailed property. The
2
S filter basis
is the “asymptotically second-order self-similarity”
concept, or simply called statistical
OSS
nd
2
or
OSSS
nd
2 , which associates with a sufficiently
large aggregate level or lag
l
in a stochastic process
X. For an aggregate
}1:{ ≥= lXX
m
l
m
of
size
m
in X, OSSS
nd
2 for ∞→
m
means that
the associated autocorrelation function (ACF),
namely
)(lr
m
(for
m
X
) is proportional to
)22( H
l
−−
. OSSS
nd
2 is LRD for its ACF is non-
summable, as indicated by .
=)(lr
m
∞=
∑
∞
−1l
m
r
The condition of “
)22(
)(
Hm
llr
−−
∝ for
∞
→
m
”
is mathematically equivalent to the slowly decaying
variance property. That is, the variance of the mean
of sample size
m
decays more slowly than
m
. This
phenomenon is represented by the expression:
β
−
∝ mXVar
m
)( . For a stationary OSS
nd
2
process X and
15.0 <
<
H
the value of
H22 −=
β
should apply. Equations (3.1) and
(3.2) summarize the
OSSS
nd
2 property and they
hold for the weaker condition in equation (3.3). The
slowly decaying variance property is clear if a log-
log plot is produced for equation (3.1). As shown by
equation (3.4),
))(log( XVar is a constant,
))(log(
m
XVar versus )log(m yields a straight
line with slope
β
− . The H value can then be
calculated by the
)
2
(1
β
−=H
formula. The
2
S filter finds
β
for
m
X
on the fly.
The
)(
m
XVar calculation uses the mean value
)(
m
XE estimated by the
RT
M
3
process.
)(
m
XE is
∑
+−=
−
lm
mln
n
Xm
1)1(
1
conceptually, and the
key for the
2
S filter operation is to choose a
sufficiently large
m
, which is the multiples (i.e. C)
of
14
=
F
to virtually satisfy ∞→
m
;
FCm *
=
for estimating
β
. The detected result
is available at the
Ag time point. In Figure 2 for
example, the
β
result for aggregate 2 is available at
the point of
2
=
Ag .
)1.3).....((
1
)(
)22(
XVar
m
XVar
H
m
−
=
)2.3)....(()( krlr
m
=
∞→m
lim
)3.3)....(()( krlr
m
=
)4.3)....(log())(log())(log( mXVarXVar
m
β
−=
The process in the
2
S filter to calculate
β
is the
“continuous aggregate based (CAB)” method. The
CAB evaluates if an aggregate is stationary by
checking its Gaussian property or “Gaussianity”
(Arvotham, 2001) by the kurtosis and skewness
metrics. A symmetrical normal distribution has
perfect Gaussianity indicated by
3
=
kurtosis
and
0
=
skewness
. Statistically measured kurtosis
and skewness values are rarely perfect, and
reasonable limits can be used to indicate the
presence of a bell curve, which belongs to the
exponential family of independent stationary
increments. The
2
S filter follows the CAB
procedure and finds
β
by linear regression, and the
quality of which can be judged by the coefficient of
determination or
2
R
between 0 and 1 (Jain, 1992).
Higher
2
R
implies better quality for the linear
regression. By the predefined threshold
2
R
Th (e.g.
0.85 or 85%) the
2
S filter can reject a hypothesis of
self-similarity in
m
X
for
2
2
R
ThR < . The CAB
operation in Figure 2 works with the aggregates
m
lAg
X
=
in a stochastic process X along the time axis.
Assuming: a) P1, P2, and P3 are the log-log plots for
three successive aggregates based on equation (3.4),
A NOVEL REAL-TIME SELF-SIMILAR TRAFFIC DETECTOR/FILTER TO IMPROVE THE RELIABILITY OF A
TCP BASED END-TO-END CLIENT/SERVER INTERACTION PATH FOR SHORTER ROUNDTRIP TIME
97
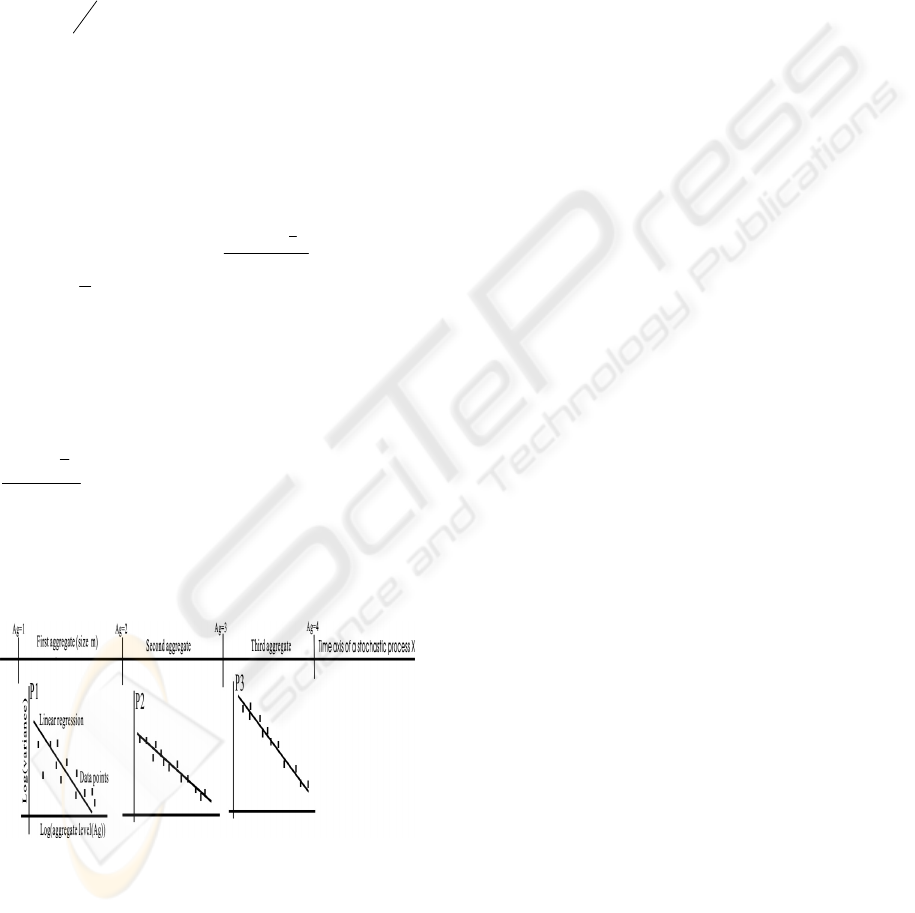
b) these plots yield different
β
values:
1
β
for P1
with
82.0
2
=R
,
2
β
for P2 with
98.0
2
=R
, and
3
β
for P3 with
95.0
2
=R
, c) lAg = is the aggregate
level, and d)
9.0
2
=
R
Th , then both P2 and P3
confirms self-similar traffic but not P1 (for
2
2
R
ThR <
). If P2 and P3 yield very
different
β
values, their H values by
)
2
(1
β
−=H
indicate different dimensions or D. The D value may
change over time due to various factors, for
example, the ON/OFF situations in the network
(Willinger, 2003). A changing D or H is a sign of
non-linearity in the stochastic process being
examined. A D/H correlation will be demonstrated,
but the focal discussion of how H or D could affect
system stability will be left out.
Skewness is represented by
(
)
sd
x
m
xi
N
i
3
1
3
)1( −
−
∑
=
, where
x
and
sd
are the measured mean and
standard deviation respectively for the aggregate of
m
samples. It measures the symmetry of a bell-
shape aggregate distribution. A positive value
indicates that the bell curve skews right and the right
tail is heavier than the left one. Kurtosis is
represented by
sd
x
x
m
i
N
i
4
1
4
)1(
)(
−
∑
−
=
, and its value decides whether the bell curve is
peaked (for positive value) or flat (or negative value)
compared to the normal distribution with
3=kurtosis
and
0
=
skewness
.
Figure 2: The “aggregate based (AB)” approach
4 EXPERIMENTAL RESULTS
The
2
S filter was verified by simulations based on
the CAB approach. The experiments were
conducted on the stable Aglets mobile agent
platform, which is designed for Internet applications.
The Aglets makes the experimental results scalable
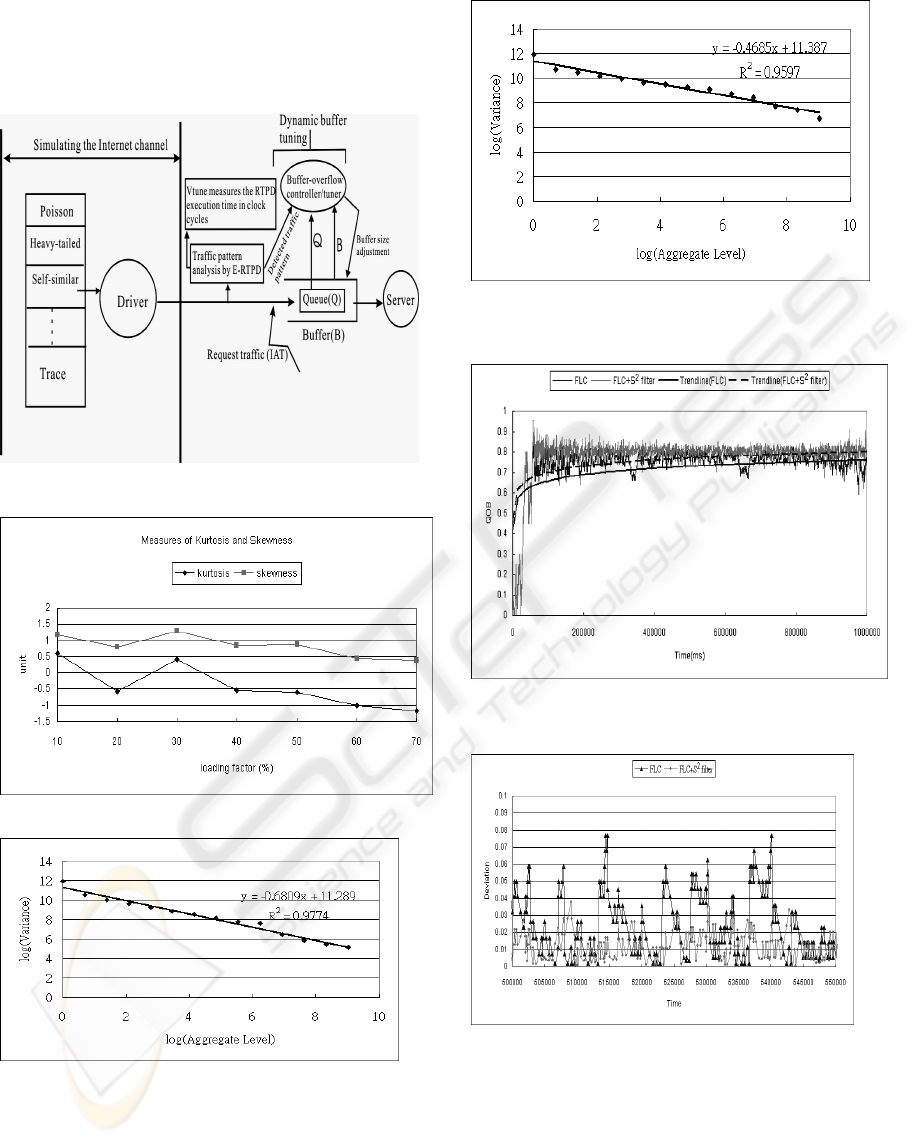
for the open Internet. The setup for the experiments
is shown in Figure 3, in which the driver and server
are both aglets (agile applets). The driver picks a
known waveform or a pre-collected IAT trace that
may embeds different traffic patterns over time. The
pick simulates the IAT among the requests that enter
the server queue. The FLC dynamic buffer size tuner
is the test-bed for the
2
S filter. It adjusts the buffer
size on the fly by leveraging the current queue
length, buffer length, and detected traffic pattern.
The traffic pattern(s) that drives the IAT is also
recorded by the E-RTPD that has included the
2
S
filter. This helps matching the FLC control behavior
with the specific traffic pattern. The VTune
measures the E-RTPD's average execution time so
that its contribution to time-critical applications on
the Internet can be evaluated. Experiments with
different IAT traffic patterns were carried out. The
results conclude that the
2
S filter indeed detects
self-similar traffic and helps the FLC deliver more
accurate dynamic buffer size tuning. The
experimental results presented here include: self-
similarity detections, traffic and FLC accuracy, and
D/H correlation.
Table 1 summarizes seven of the many different
simulations conducted. The self-similar traces,
which simulate the inter-arrival times (IAT) for the
request into the server’s buffer being controlled by
the FLC (Figure 3), are generated by using the
Kramer’s tool (Kramer, 2002). The useful
information from the Table 1 summary is listed as
follows:
The
2
S filter always detect and recognizes self-
similarity in the IAT traffic as long as the network
loading or utilization
ψ
is 50% (i.e. 0.5 simulated
by the same tool) or less.
ψ
is proportional to the self-similarity dimension
(explained later with Figure 9). For
4.0>
ψ
the
traffic self-similarity scales differently as indicated
Figure 5 and 6. Our analysis indicates that this is
possibly the beginning of non-linear scaling or a
sign of possible multifractal traffic. Both Figure 5
and 6 work with
9.0
2
=
R
Th .
The scaling exponent H (Hurst effect) changes with
ψ
, which is inversely proportional to the IAT
length that is the “reduction/resolution” in light of
traffic. For
4.0
≤
ψ
the scaling is basically the
same (i.e. a monofractal sign). The
β
value in
ICETE 2005 - GLOBAL COMMUNICATION INFORMATION SYSTEMS AND SERVICES
98
every case (row) in Table 1 is the average of several
aggregates for the same stochastic process X.
The kurtosis and skewness are different for the
different self-similar traces. Nevertheless they
always indicate the presence of a bell curve.
Figure 3: Setup for the
2
S filter experiments
Figure 4: Kurtosis and skewness measurements
Figure 5:
2
S filter yields slope = -0.6809(β = 0.6809),
R
2
= 97.74% for
2.0=
ψ
Figure 6:
2
S filter yields slope = -0.4685(β = 0.4685),
R
2
= 95.97% for
5.0
=
ψ
Figure 7: Faster convergence of the FLC+
2
S filter than
the FLC working alone
Figure 8: Less MD deviation by FLC+
2
S than the FLC
alone
A NOVEL REAL-TIME SELF-SIMILAR TRAFFIC DETECTOR/FILTER TO IMPROVE THE RELIABILITY OF A
TCP BASED END-TO-END CLIENT/SERVER INTERACTION PATH FOR SHORTER ROUNDTRIP TIME
99
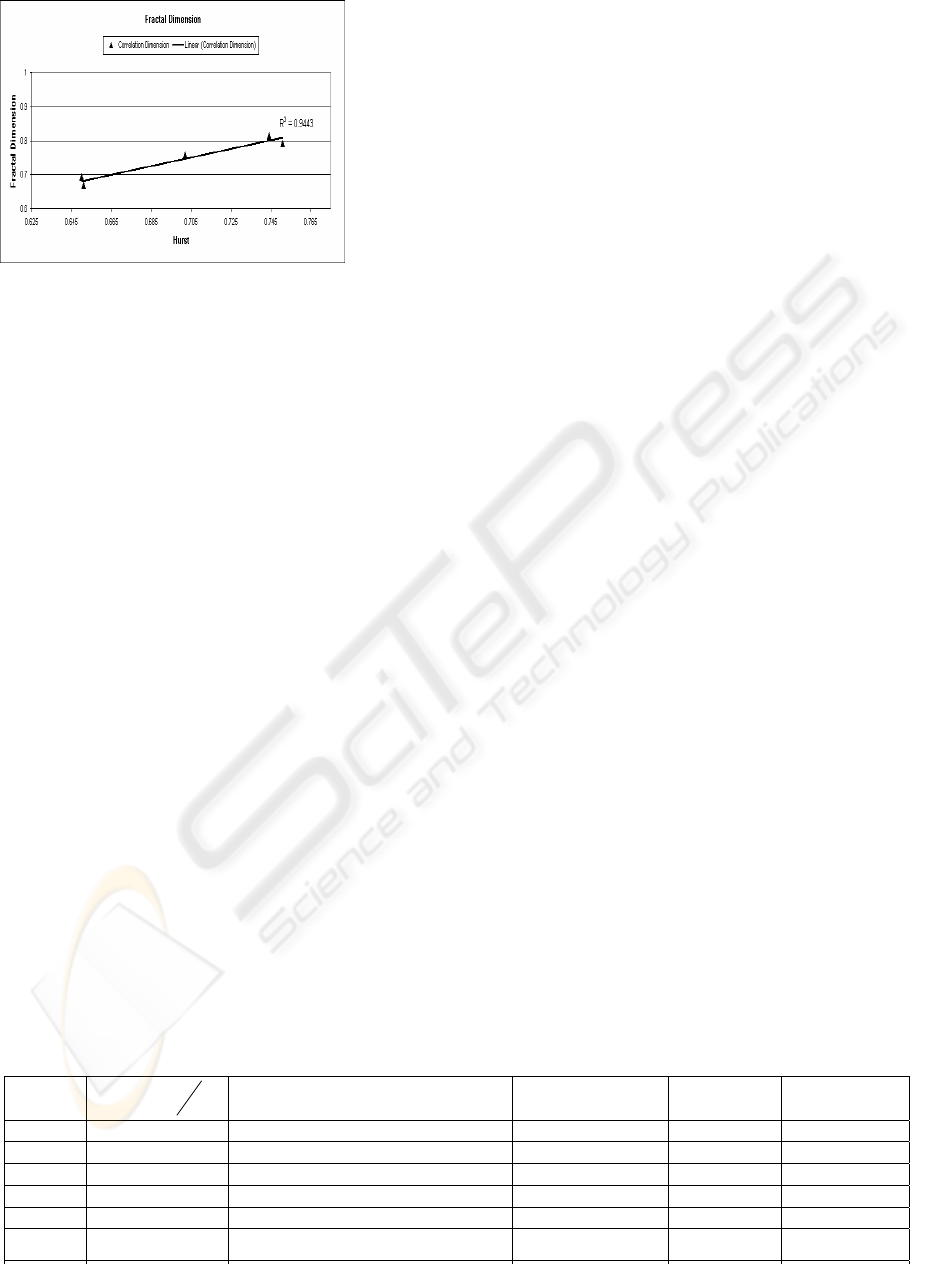
Figure 9: D/H correlation for Table 1
The kurtosis and skewness values for each case
(row) in Table 1 are plotted for comparison (Figure
4). These values are obviously affected by the
loading. When the loading is high (e.g. 60% and
70%) the bell curve tends to skew less but still to the
right. Meanwhile the bell curve tends to get flatter.
Comparatively the skewness of the bell curves for
the seven simulation cases in Table 1 are less than a
Weibull (
5.1=gamma ) distribution, which is
relatively more peaked (
5.4≈kurtosis
). The trend-
lines in Figure 7 for the IAT traffic trace in Figure 5
shows that the “
2
SFLC + filter” combination
converges much faster to given steady state than the
FLC working alone. With help from the
2
S filter
the FLC adjusts the GP value for the derivative (D)
control element on the fly according to the currently
detected self-similarity. As a result it produces less
MD than the FLC working alone (Figure 8). In the
experiments the FD3 tool (Sarraille, 2004), which
confirms if an image (e.g. a time series generated by
the Kramer’s tool) is really fractal and measures its
dimension D, was used. The purpose is to evaluate
the D/H correlations (Peitgen, 2004). This
correlation for Table 1 is plotted and shown in
Figure 9. It shows that if D changes suddenly, H also
rescales accordingly to indicate possible traffic
nonlinearity. In contrast, if H scales linearly, it is a
sign of monfractal traffic. The intrinsic average
2
S filter execution time as observed from all the
experiments is 1455 clock cycles as measured by the
Intel’s VTune Performance Analyzer. It is intrinsic
because it works with immediately available data
(without any actual IAT delay) in a trace. For a
platform of 100 mega hertz the corresponding
physical time is
)10*100/(1455
6
or 14.55 micro
seconds. In real-life applications the
2
S filter has to
collect enough IAT samples on the fly before
computing
β
. This sampling latency can be
significant, and therefore the success of
2
S filter
application depends of choosing size
m
for the
m
X
aggregate correctly. For example, if the average IAT
is one second,
1000
=
m
means 1000 seconds. On
the contrary for the same size
m
and mean IAT of 1
ms, the physical time is only one second. Therefore,
the
m
value for the
2
S filter Java prototype is a
variable rather than a chosen constant, and the
user/tester should fix the time span
T
instead of
collecting the fixed
m
samples on the fly. That is,
the number of samples (i.e.
m
) in an aggregate
within
T
depends on the IAT; shorter IAT delays
yield a larger
m
. Then, the
2
S filter works
adaptively with the
m
value decided by the IAT for
the “timed aggregate” based on the chosen T.
5 CONCLUSION
The novel self-similarity (
2
S ) filter is proposed for
real-time applications. It is based on the
“asymptotically second-order self-similarity”
concept (alternatively called statistical
OSS
nd
2
or
OSSS
nd
2 ) for stationary time series. As a
component in the enhanced RTPD or E-RTPD it
helps the FLC dynamic buffer tuner yield more
accurate control by detecting self-similarity in the
IAT traffic. This means improved reliability for the
client/server interaction path and shorter roundtrip
time. The
2
S filter is original because there is no
Table 1:
2
S
filter’(log(variance) versus log (aggregate level) to find
β
β
)
2
1(
β
−=H
2
R
(coefficient of determination)
loading
ψ
kurtosis skewness
0.6583 0.671 0.956 (95.6%) 0.1 (10%) 0.597045 1.180861
0.6809 0.660 0.975 (97.5%) 0.2 -0.56218 0.798282
0.6425 0.679 0.977 (97.7%) 0.3 0.40215 1.277175
0.6473 0.677 0.972 (97.2%) 0.4 -0.53386 0.861215
0.4685 0.766 0.959 (95.9%) 0.5 -0.58417 0.892037
0.3762 0.812
0.885 (88.5%) (less than
2
R
Th
)
0.6 (rejected)
-1.01033 0.446756
0.1978
0.901
0.605 (60.5%)
0.7 (rejected)
-
1.16043
0.388599
ICETE 2005 - GLOBAL COMMUNICATION INFORMATION SYSTEMS AND SERVICES
100

previous examples in the literature that can detect
self-similarity in a time series on the fly. The next
step in the research is to perfect the CAB approach
by enabling it to determine the range of aggregate
size
m
that can produce accurate traffic detection
but without any unnecessary and significant latency
in the process.
ACKNOWLEGEMENT
The authors thank the Hong Kong PolyU and the
Department of Computing for funding the RTPD
research with grants APG51 and HJZ91.
REFERENCES
S. Arvotham, R. Riedi and R. Barabniuk, Connection-
Level Analysis and Modeling of Network Traffic,
Proc. of the IEEE/ACM Internet Measurement
Workshop, 2001
B. Braden et al., Recommendation on Queue Management
and Congestion Avoidance in the Internet, RFC2309,
April 1998
L. Cottrel, M. Zekauskas, H. Uijterwaal, and T.
McGregor, Comparison of Some Internet Active End-
to-End Performance Measurement Projects,
http://www.slac.stanford.edu/comp/net/wan-
mon/iepm-cf.html, 1999 Intel’s VTune Performance
Analyzer,
http://ww.intel.com/support/performancetools/vtune/v
5
R. Jain, The Art of Computer Systems Performance
Analysis – Techniques for Experimental Design,
Measurement, Simulation, and Modeling, Wiley, 1992
Kramer, Generator of Self-Similar Network Traffic,
http://wwwcsif.cs.ucdavis.edu/~kramer/code/trf_gen1.
html
S.M. Lewandowski, Frameworks for Component-based
Client/Server Computing, ACM Computing Surveys,
30(1), March 1998, 3-27
Wilfred W. K. Lin, Richard S.L. Wu Allan K. Y. Wong,
and Tharam S. Dillon, A Novel Real-Time Traffic
Pattern Detector for Internet Applications, Proc. of the
Australasian Telecommunication Networks and
Applications Conference, Sydney, Australia
(ATNAC’04), Dec 2004, 224-227
Wilfred W. K. Lin, Allan K. Y. Wong, and Tharam S.
Dillon, A Novel Adaptive Fuzzy Logic Controller (A-
FLC) to Reduce Retransmission and Service
Roundtrip Time for Logical TCP Channels over the
Internet, Proc. of the EU2004 Conference, August
2004, Japan, 942-951
A. Medina, I. Matta and J. Byers, On the Origin of Power
Laws in Internet Topologies, ACM SIGCOMM, 30(2),
2000, 18-28
Wilfred W. K. Lin, Allan K. Y. Wong, and Tharam S.
Dillon, A Novel Fuzzy-PID Dynamic Buffer Tuning
Model to Eliminate Overflow and Shorten the End-to-
End Roundtrip Time for TCP Channels, Lecture Notes
in Computer Science, Springer Verlag LNCS
Electronic Journal,
http://www.springerlink.com/index/VF155CH38XFL
LB4H
S. Molnar, T.D. Dang and A. Vidacs, Heavy-Tailedness,
Long-Range Dependence and Self-Similarity in Data
Traffic, Proc. of the 7
th
Int’l Conference on
Telecommunication Systems, Modelling and Analysis,
Nashville, USA,18-21, 1999
H.O.Peitgen, H.Jurgens, D.Saupe, Chaos and Fractals:
New Frontiers of Science 2
nd
edition, Springer, 2004,
pp.686
J. Sarraille and P. DiFalco, FD3,
http://life.bio.sunysb.edu/morph/fd3.html
M.S. Taqqu, Fractional Brownian Motion and Long-
Range Dependence, in Theory and Applications of
Long-Range Dependence, P. Doukhan et al., Eds.,
Birkhuser 2003, 5-38
W. Willinger, V. Paxson, R.H. Hiedi and M.S. Taqqu,
Long-Range Dependence and Data Network Traffic,
in Theory and Applications of Long-Range
Dependence, P. Doukhan et al., Eds., Birkhuser 2003,
373-408
Allan K.Y. Wong and Joseph H.C. Wong, A Convergence
Algorithm for Enhancing the Performance of
Distributed Applications Running on Sizeable
Networks, The International Journal of Computer
Systems, Science & Engineering, vol. 16, no. 4, July
2001, 229-236
Allan K.Y. Wong, Wilfred W.K. Lin, May T.W. Ip and
Tharam S. Dillon, Genetic Algorithm and PID Control
Together for Dynamic Anticipative Marginal Buffer
Management: An Effective Approach to Enhance
Dependability and Performance for Distributed Mobile
Object-Based Real-time Computing over the Internet,
Journal of Parallel and Distributed Computing (JPDC),
vol.62, Sept. 2002, 1433-1453
A NOVEL REAL-TIME SELF-SIMILAR TRAFFIC DETECTOR/FILTER TO IMPROVE THE RELIABILITY OF A
TCP BASED END-TO-END CLIENT/SERVER INTERACTION PATH FOR SHORTER ROUNDTRIP TIME
101
