
RELIABILITY EVALUATION OF WDM NETWORKS WITH
LINK CAPACITY AND HOP CONSTRAINTS
Hehong Fan, Mingde Zhang, Xiaohan Sun
Lab of Optical Communications and Photonics, Southeast University, Nanjing, 210096, China
Keywords: network performability, WDM network, link capacity, reliability evaluation, channel-related elements,
multiple working-states object (MWSO)
Abstract: A reliability evaluation module is presented for study of WDM network reliability. In this module, WDM
networks are assumed to consist of three kinds of network elements - nodes, links and wavelength channel-
related elements. And a network performance index – network ‘function value’, was introduced here as a
quantitative representation of working-state of WDM network under certain link capacity and hop
requirements. In addition, WDM networks here are assumed to be a survivable network, which can operate
in a degradative manner against destruction and thus have multiple working-states instead of two opposite
states. The reliability evaluation module was used to analyse the reliability of a WDM network with
CERNET topology. Simulation results indicate that different link capacity requirement as well as different
working-state requirements may lead to different reliability evaluation results, and the differences will
enlarge very quickly with the increasing of network element failure rates. This implies that the study of
WDM network reliability should be performed under multiple working-states assumption and the addition
of the new network element kind - a wavelength channel-related element is necessary.
1 INTRODUCTION
The restoration techniques used in large-scale
network systems make it possible for networks to
survive in a degradative manner against destruction.
Therefore the assumption that network systems have
only two opposite working-states is not justifiable
any more. It was suggested in our former paper (Fan
Hehong et. al, 2005) that large-scale network
systems should be regarded as having multiple
working-states. Such idea has appeared in some
other studies recently, in which large complex
systems like network are deemed as multi-failure-
state systems
(Julia V. Bukowski, William M.
Goble., 2001)
, or having additional working states,
e.g. failure sectioning state
(Enrico Carpaneto et. al,
2002). Thus a network performance index is needed
for the classification of working states. Whereas not
only network connectivity
(Kent Fitzgerald et. al,
2003), (AboElFotoh et. al, 2001) but also network
performance
Ali M. Rushdi (1998). is important for
communication, a composite performance and
reliability measure for network, i.e. performability
(J. F. Meyer, 1980), (B. R. Haverkort, I. G.
Niemegeers, 1992), is worthwhile to examine.
Thereby, an index, function value, representing the
percentage of network meeting certain Qos
requirement is introduced in this paper. For WDM
networks, PLR (packet loss ratio) and delay are two
fundamental Qos indexes and has tight relationship
with link capacity and hop separately. So network
function value are calculated with link capacity and
hop constraints.
Considering that there exist such kind of
elements in WDM network whose failure affect
neither the nodes nor the entire links but certain
wavelength channels in the links, such as
transponders in OLTs (optical line terminals), a new
kind of network element is added to the traditional
elements (nodes and links) of network reliability
evaluation module, namely wavelength channel-
related elements. In this way, links in WDM
network may be up or totally down or only shrink in
capacity. The necessity of this addition is reinforced
by the fact that WDM network protection/restoration
schemes may operate in different layers, such as in
optical multiplex section (OMS) layer, which
restores the entire group of lightpaths on a link, and
the optical channel (OCh) layer, which restores only
one lightpath at a time.
In the following parts, some knowledge for
reliability of multiple working-states object
210
Fan H., Zhang M. and Sun X. (2005).
RELIABILITY EVALUATION OF WDM NETWORKS WITH LINK CAPACITY AND HOP CONSTRAINTS.
In Proceedings of the Second International Conference on e-Business and Telecommunication Networks, pages 210-215
DOI: 10.5220/0001419902100215
Copyright
c
SciTePress
(MWSO) as well as the reliability evaluation module
for WDM networks was introduced in the second
part. Then the algorithm of the network
performability index – function value was described
in the third part for the first time. In the fourth part
the reliability of CERNET (China Education and
Research Network) topology was studied as an
example to demonstrate the use of this module.
Finally, a conclusion will be drawn in the final part.
2 RELIABILITY EVALUATING
OF MWSO
2.1 Network performability index -
network function value
Performability index in different papers may be
different, such as service availability, frame loss
(V.Catania et. al, 1990), network delay and capacity
(Alexander A.Hagin, 1994)
etc. While communication
network systems are used to ensure all the nodes in
the network to normally communicate with each
other, here the performability index - function-value,
v
f
, was defined as the percentage of node pairs in the
network that can communicate with each other under
certain performance requirement. And the
performance requirement includes link capacity and
maximum hop of connections. In other words,
network function value represents the degree in
which the network nodes as a whole can accomplish
their required communication tasks.
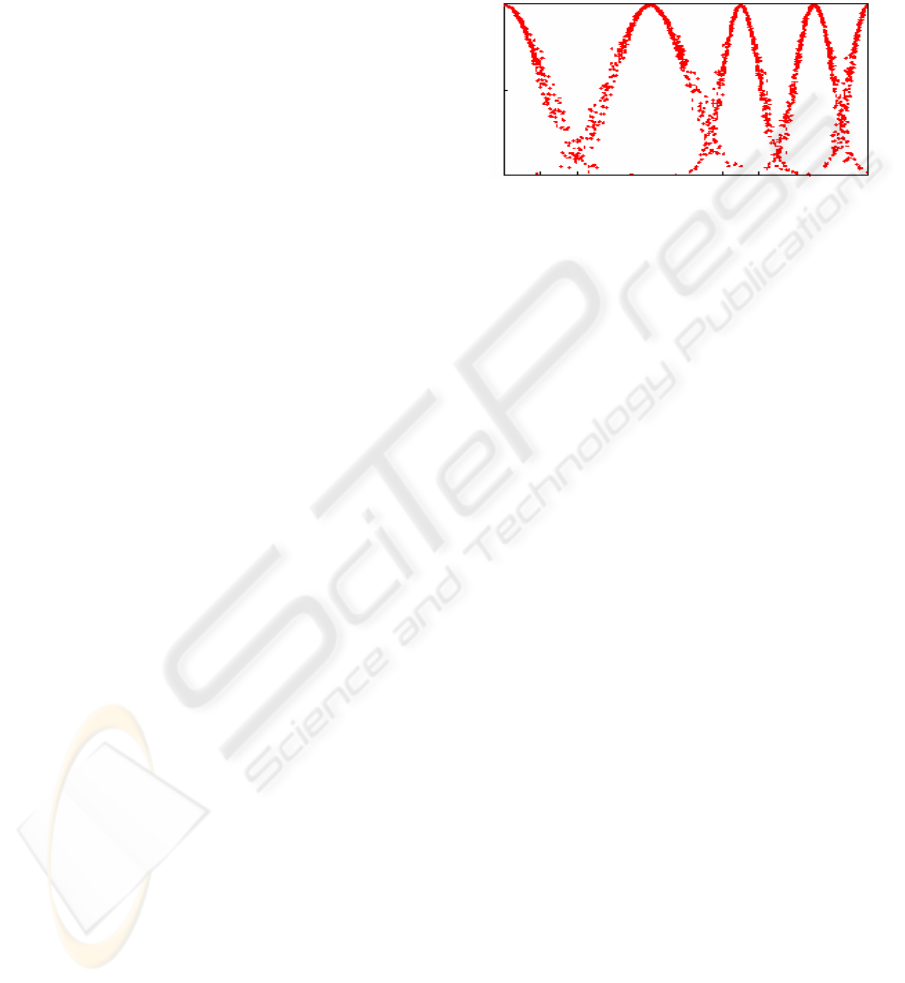
2.2 State term cloud series (STCS)
and reliability of MWSO
Whereas network function value of network can be
regarded as a quantitative representation of network
working states, it’s not necessary for us to study
network reliability according to each function value.
In other words, working states of network can be
classified to several states. As we can always use a
series of linguistic terms, such as “very good”,
“fairly good”, “medium”, “bad”, “worst” and words
alike to describe all kinds of variables, working
states of network can also be classified to several
kinds like this. Relation between the qualitative
description (working state) and the quantitative
description (v
f
) for working states can be explained
explicitly by Linguistic Cloud Model (LCM) (Huang
Haifeng et. al, 2001), (Li De-yi et. al, 2000). And a
series of linguistic term cloud - state term cloud
series (STCS)
(Fan Hehong et. al, 2005), as showed
in figure 1, demonstrate the qualitative description
of a variable at the full length of its defined value
area with reference to its quantitative values. With
STCS we can scientifically differentiate the multiple
working-states of network easily.
With respect to the reliability of MWSO, the
parameters should be confined by not only stated
conditions and time but also certain state linguistic
term (SLT), w. Reliability of MWSO confined by
term w is:
{
}
0,
( ) | ( ) (1)
wfw
Rt Ptv x b=>−
Here
0,w
x
refers to the expected value (information
center) of word w, and b refers to the bandwidth of
its membership cloud (fuzziness of the concept).
And the availability of MWSO, A
b
, in time interval
between t1 and t2, is defined as the time weighted
function value percentage:
2
,max
1
( ) / ( 2 1) (2)
t
bff
t
Avdtvtt=⋅−
∫
Additionally, for repairable MWSO, useful life
under certain circumstances and repair rate was
defined as the operating time before its availability
of certain period length drops to an unacceptable
value.
2.3 Mapping form WDM network
elements to elements in the
Reliability evaluation module
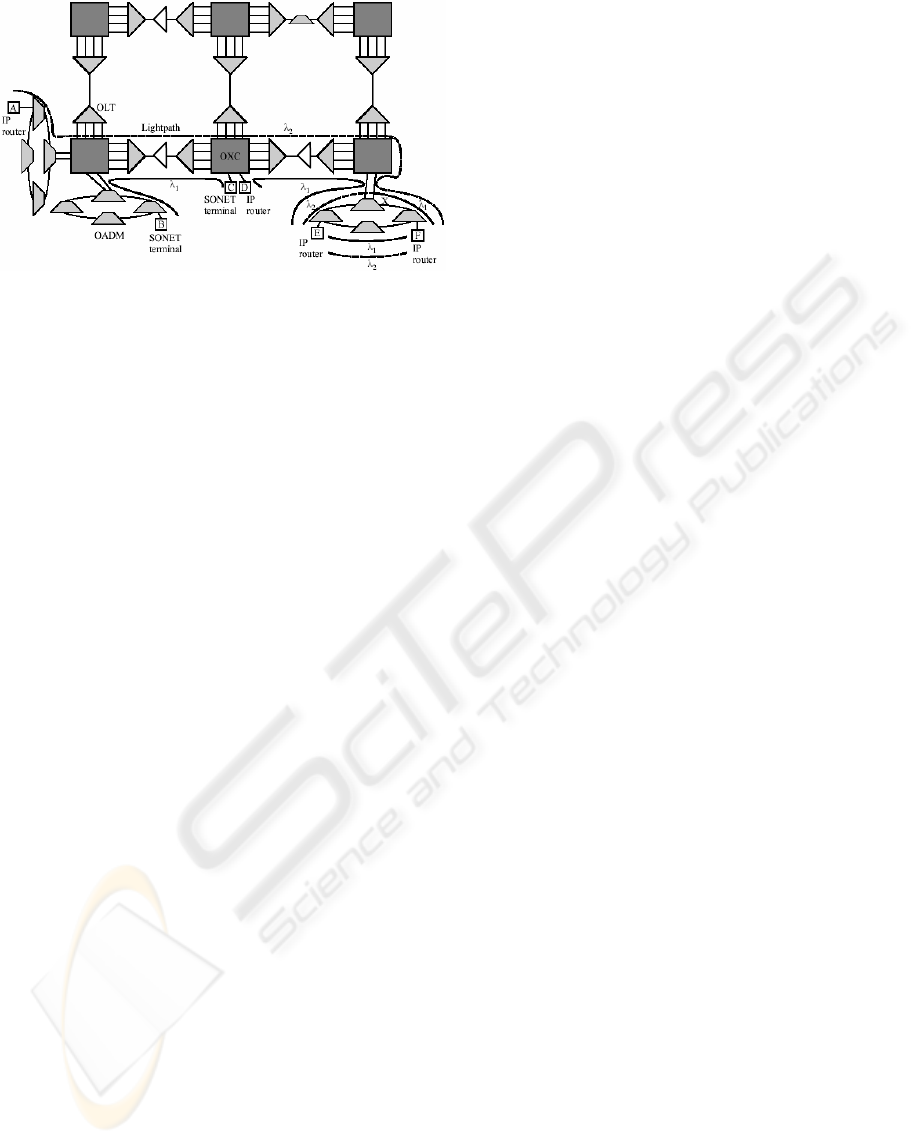
WDM networks are typically consisting of OXCs
(optical crossconnects), OLTs (optical line
terminals), OADMs (optical add/drop multiplexers),
fibers and sometimes OAs (optical amplifiers)
(Rajiv
Ramaswami, Kumar Sivarajan)
. Furthermore,
transponders and optical multiplexer/demultiplexers
are two fundamental units that make up OLTs and
OADMs of parallel architectures. As transponders
operate on and affect certain wavelength channels in
the link, they may be regarded as the channel-related
elements, which affect only capacity of the related
Figure 1: Diagram of STCS.
0 20 40 60 80 100
worst bad medium good very good
U
(
%
)
RELIABILITY EVALUATION OF WDM NETWORKS WITH LINK CAPACITY AND HOP CONSTRAINTS
211
link. While OXCs and multiplexer/demultiplexers in
the OLTs and OADMs always handle all the
wavelength channels in a link together, they can be
considered as composing the nodes in the traditional
network reliability module. Different from OADMs
of parallel architectures, some OADMs are
composed of wavelength selective units in series.
This kind of OADM can be considered as being
composed of node in serial with wavelength
channel-related elements. In addition, the failure of
fibers or fiber bundles and OAs will affect all the
wavelength channels in it at the same time.
To sum up, the mapping from the WDM network
elements to the elements in the reliability evaluation
module can be implemented as follows: each
conjunction node in the topology in backbone WDM
networks, either OADM or made up of OXC and
OLTs, can be deemed as composed of a node and
channel-related elements in series; Fibers (or fiber
bundles) and sometimes OAs consist the network
links.
2.4 Reliability evaluation module for
WDM network
Based on the reliability information of the nodes,
links and channel-related elements (mainly
transponders), reliability of WDM networks can be
figured out by way of Mont Carlo simulation. The
main steps to evaluate the reliability of networks are
listed as follows:
1). Make use of the failure distribution function
knowledge of the elements, by way of Mont Carlo
method, to simulate function value, v
f
, under certain
link capacity and maximum connection hops
requirement, and A
b
of certain period length of the
network system (by Eq. (2)) changing over time.
2). Repeat step 1 to obtain the distribution of the
system’s v
f
and A
b
at different time as well as
average short period A
b
and useful life distribution,
confined by certain capacity and hop requirement
and SLT of STCS.
3). Reliability confined by a SLT at t can be
calculated by Eq. (1).
4). SLT to describe the system’s running state and
reliability level can be determined according to
STCS.
3 ARITHMETIC OF NETWORK
FUNCTION VALUE
Different from some former methods (K. K.
Aggarwal, 1998) which begin with the minimum
sets to calculate network capacity, we’ll begin with
the weighted adjacency matrix A=[a
ij
]
m
×
m
, working-
state vector of nodes B=[b
1
b
2
…b
m
] and working-
state matrix of channel-related elements C=[c
ij
]
n
×
k
in
the network to calculate the function value, v
f
, of the
network. Here, the element a
ij
in A represent the
maximum capacity of the link directs from node i to
node j. If there isn’t a direct edge connects from
node i to node j, the link capacity from link i to link j
is regarded as 0. So the total link number is the
number of non-zero elements in A. b
i
(0 or 1) in B
indicates whether the node i is up or down. c
ij
in C
refers to the channel j in link i. The total number of
node and link are separately m and n while the
maximum number of channel in each link is k. In
this method we don’t want to calculate the minimum
sets as even the minimum path may have more hops
than required.
Whereas undigraph can be transferred to digraph
easily by replacing each directionless link with a
couple of directional links in opposite direction, only
the algorithm for digraph is given below:
Step 1: For each link i, calculate the available
capacity, that is, to subtract the number of failure
channels,
ij
i
c
∑
in it from the maximum capacity.
Step 2: current adjacency matrix,
=[ ]
ccij
Aa, can be
reckoned by delete (or set zeros) columns and arrays
in A according to the zeros in B.
Step 3: calculate the reachable matrix, R, under
certain capacity requirement for the links within h
hops of the remaining adjacency matrix, A
c
:
The reachable matrix of l hops,
() ()
=[ ]
ll
ccij
Aa, can
be obtained from the reachable matrix of l-1 hops,
(1) (1)
=[ ]
ll
ccij
Aa
−−
, by
Figure 2: A WDM wavelength-routing network
OA
ICETE 2005 - SECURITY AND RELIABILITY IN INFORMATION SYSTEMS AND NETWORKS
212

(
)
(
)
(
)
(
)
11
cc1c1cc
max(min( , ),...,min( , )) 3
ll l
ij i j im mj
aaaaa
−−
=
Thus reachable matrix R can be work out by
()
(
)
2
cc c
max( , ,..., ) (4)
l
ij ij ij ij
raaa=
As any nodes in the network are not required to
communicate with themselves, the diagonal of R is
set to be zero for further calculation.
Setp4: Two kinds of v
f,system
are defined and used
here. One kind is a normal one which is the amount
of elements in R that are no less than the required
capacity; and the other is a normalized one which
denotes the percentage of maximum minimum link
capacity of all the routes between node pairs in the
network with reference to maximum minimum link
capacity of all the routes between node pairs in the
failure-free network:
()
,
/ ( 1) 5
fsystem
ij
ij
vrmmk=×−×
∑
It can be easily figured out that the maximum
traditional function value and maximum normalized
function value of an m-node WDM network with k
channels in each link are separately
(1)mm×−
and 1.
4 APPLICATION OF THE
EVALUATION MODULE
0 1
2
3
4
5
6
7
8
300
9
1300
1000
1300
500
1300
50
50
50
1600
1300 1350
900
1000
650
Figure 3: topology of 10-node CERNET
To demonstrate the reliability evaluation module,
WDM network of CERNET topology is used here as
an example. The elements are supposed to follow
Weibull failure distribution in order to examine the
system reliability parameters changing with failure
rates rising. Figure 2 showed the topology of
CERNET, and the nodes in the topology, either
made up of OXC or OADM, are all assumed to
consist of node and 2x16 parallel channel-related
elements in series with connected link. The shape
parameters and location parameters of the elements
are assumed to be 3 and 0 separately. And the scale
parameters of nodes, channel-related elements
(transponders) and links are assumed to be 20000h,
50000h and 50000h, respectively. As operation of
the nodes in the WDM networks need power supply,
the reliability of such equipment is considered to be
much lower than the passive element – fiber link. In
addition, while nodes in WDM networks are larger
and more complexly configured than transponder,
scale parameters of transponders are also deemed as
larger than those of nodes. MTTR here is assumed to
be 2h. The simulation is repeated 100 times and the
time step is 96h (4 days). Every node is assumed to
have full wavelength conversion capability, so that
traffic in some failed wavelength channels can be
restored in other working or backup channels. The
maximum hops between each node pairs are limited
to 4.
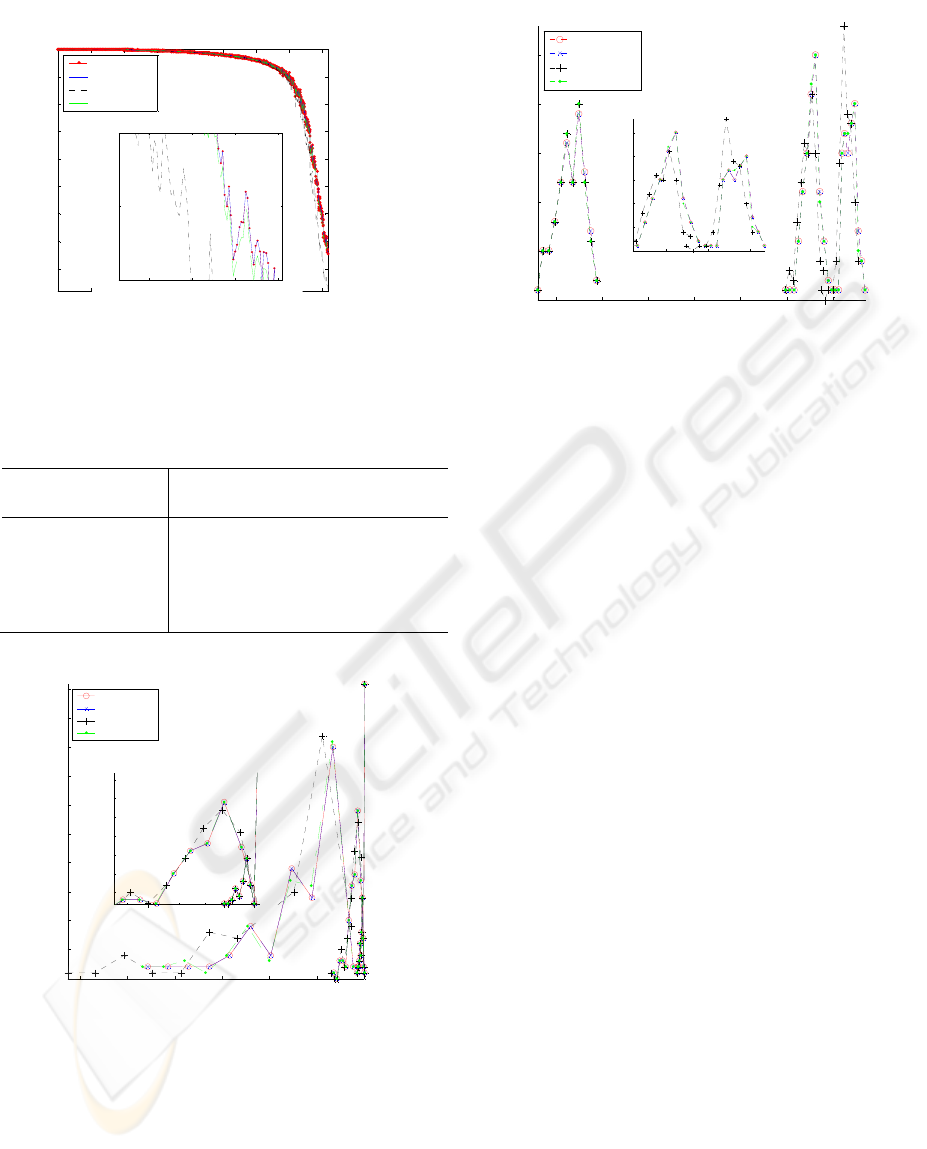
The simulation results are showed in the
following three figures. Fig (4) shows that while
there is no perceptible difference between average
availability between different link capacity demands
when failure rates are rather low, the network
availability under full channel requirements (16
channels) are lower than availability of all the other
three conditions, and the distance between them
become more and more larger with failure rates went
higher. This is further proved by the figures listed in
table 1, during which there is no difference between
different capacity requirement at 47904h, and only
0.0002 in difference between capacity requirement
of 16 channels and that of the other three at 95904h,
while the difference arise to about 0.025 after
another 47904h and finally reached 0.13 at 163104h;
the slightly lower value of normalized availability
than the availability under two lower channel
number demands, and the same value of availability
under 8 and 1 channel demands indicate that such
kind of channel demand may be easy to meet and
there’re very little chance for only a few channels
left under the element failure distribution
assumptions given above.
RELIABILITY EVALUATION OF WDM NETWORKS WITH LINK CAPACITY AND HOP CONSTRAINTS
213
2 4 6 8 10 12 14 16
x 10
4
0.2
0.3
0.4
0.5
0.6
0.7
0.8
0.9
1
t
A
b
1 channel
8 channels
16channels
normalized
Figure 4: Average CERNET availability of 96h under
different link capacity requirements changing with
working time (and failure rates)
Table 1: Average CERNET availability of 96h under
different link capacity requirements at four different
working time (denote different failure rates)
Working time(h)
Capacity demand
47904 95904 143904 163104
1
8
16
normalized
0.9969 0.9802 0.8573 0.2550
0.9969 0.9802 0.8573 0.2550
0.9969 0.9800 0.8317 0.1199
0.9969 0.9802 0.8556 0.2441
0.4 0.5 0.6 0.7 0.8 0.9 1
0
0.05
0.1
0.15
0.2
0.25
0.3
0.35
0.4
0.45
0.5
A
b
1 channel
8 channels
16channels
normalized
Figure 5: CERNET availability distribution of 96h
changing with working time and failure rates. The three
groups of lines from left to right are separately at working
time of 47904h, 95904h and 143904h.
Figure 5 told us that when failure rates are rather
low, the short period availability concentrated near
1, but as failure rates going up, the distribution of
availability becomes widen, from 0.01 at 47904h, to
0.05 at 95904h, to about 0.6 at 143904h, which
implies that the system begun to be unstable.
2 4 6 8 10 12 14
x 10
4
0
0.05
0.1
0.15
0.2
0.25
l
p
1 channel
8 channels
16channels
normalized
Figure 6: distribution of CERNET useful life under
different capacity and SLT requirements. Performance
requirement SLTs of the line groups from left to right be
separately “perfect”, “very good” and “good”.
From figure 6 we can see that useful life become
longer and longer with SLT of network performance
become lower. What is more important is that
although the distance of availability requirement
between “perfect” (expected value is 1 and
bandwidth 0) and “very good” (expected value is 1
and bandwidth 0.05) are very small, their useful life
are far cry from similar: the average useful life of
“very good” performance requirement are almost 5
times the length of “perfect”, separately 1.30х105h
and 0.26х105h. Which have a sharp contrast with it
is that, although the distance of availability
requirement between “good” (expected at 0.85) and
“very good” are much larger than the former two,
useful life of them hasn’t that big difference. These
results show that while reliability level and useful
life increases with performability requirement
decrease, the extent that useful life increases are not
proportional to the decrease of performability
requirement. Only a very small step down from the
requirement of “perfect” will lead to a great longer
useful life but further decrease of performability
requirement will have much lower effect on
lengthening useful life.
5 CONCLUSION
Simulation results indicated that different link
capacity requirement for network may lead to
different evaluation results, especially when failure
rates are high and the differences enlarge very fast
with the increasing of failure rate; different working-
state requirements may lead to fairly different
reliability evaluation results as well: the lower the
0.95 0.96 0.97 0.98 0.99
0.05
0.1
0.15
0.2
0.25
0.3
0.35
1.54 1.56 1.58 1.6
x10
5
0.4
0.45
0.5
1.3 1.4 1.5
x 10
5
0
0.05
0.1
0.15
0.2
0.25
ICETE 2005 - SECURITY AND RELIABILITY IN INFORMATION SYSTEMS AND NETWORKS
214

performability requirement the higher the reliability
level, and the lengthening of useful life are not
proportional to the decrease of performability
requirement - a small step down from the
requirement of “perfect” (to “very good”) will be
enough to lengthen the network useful life
remarkably.
All these results imply that study of network
reliability should be performed under multiple
working-states assumption and the addition of the
new network element kind - wavelength channel-
related elements for reliability analysis of WDM
network is necessary.
REFERENCES
Fan Hehong, Sun Xiaohan, Zhang Mingde (2002). A novel
fuzzy evaluation method to evaluate the reliability of
FIN. Retrieved January, 2005, from Southeast
University, Library Web site:
http://www.lib.seu.edu.cn/database/disp.asp?info_id=4
2
Julia V. Bukowski, William M. Goble. (2001). Defining
Mean Time-to-Failure in a Particular Failure-State for
Multi-Failure-State Systems. Retrieved January, 2003,
from Southeast University, Library Web site:
http://www.lib.seu.edu.cn/database/disp.asp?info_id=4
2
Enrico Carpaneto, Alessandra Mosso, Andrea Ponta,
Emiliano Roggero (2002). Comparison of Reliability
and Availability Evaluation Techniques for distribution
Network Systems. Proceedings of RAMS, 563-568.
Kent Fitzgerald, Shahram Latifi, Pradip K. Srimani
(2002). Reliability Modeling and Assessment of the
Star-Graph Networks. Retrieved March, 2003, from
Southeast University, Library Web site:
http://www.lib.seu.edu.cn/database/disp.asp?info_id=4
2
Manzi E., Labbe M., Latouche G.., Maffioli F. (2001).
Fishman's sampling plan for computing network
reliability. Retrieved March, 2003, from Southeast
University, Library Web site:
http://www.lib.seu.edu.cn/database/disp.asp?info_id=4
2
AboElFotoh, H.M.F., Al-Sumait, L.S. (2001). A neural
approach to topological optimization of
communication networks with reliability constraints.
Retrieved March, 2003, from Southeast University,
Library Web site:
http://www.lib.seu.edu.cn/database/disp.asp?info_id=4
2
V.Catania, A. Puliafito, L. Vita (1990). Availability and
performability assessment in LAN interconnection.
Retrieved March, 2002, from Southeast University,
Library Web site:
http://www.lib.seu.edu.cn/database/disp.asp?info_id=4
2
Alexander A.Hagin (1994). Performability, reliability, and
survivability of communication networks: system of
methods and models for evaluation. Retrieved March,
2002, from Southeast University, Library Web site:
http://www.lib.seu.edu.cn
K. K. Aggarwal (1998). A fast algorithm for the
performance index of a telecommunication network.
Retrieved March, 2002, from Southeast University,
Library Web site:
http://www.lib.seu.edu.cn/database/disp.asp?info_id=4
2
Ali M. Rushdi (1998). Performance indexes of a
telecommunication network. Retrieved March, 2002,
from Southeast University, Library Web site:
http://www.lib.seu.edu.cn/database/disp.asp?info_id=4
2
J. F. Meyer (1980). On evaluating performabiity of
degradable computing systems. IEEE Trans. Comput.,
C-29, 720-731.
B. R. Haverkort, I. G. Niemegeers (1992). A
performability modelling tool based on the dynamic
queueing network concept. Retrieved 2002, from
Southeast University, Library Web site:
http://www.lib.seu.edu.cn
Huang Haifeng, Sun Xiaohan, Dai Wen, Zhang Mingde
(2001). Reliability analysis based on membership
cloud model in Distributed Optical fiber Industrial
network. Retrieved January, 2005, from Southeast
University, Library Web site:
http://www.lib.seu.edu.cn
Li De-yi, Di Kai-chang, Li De-ren, Shi Xue-mei (2000).
Mining Association Rules with Linguistic Cloud
Models. Retrieved March, 2001, from Southeast
University, Library Web site: http://
http://www.lib.seu.edu.cn/database/disp.asp?info_id=1
7
Rajiv Ramaswami, Kumar Sivarajan, Optical Networks: A
Practical Perspective. Morgan Kaufmann Publishers,
2nd edition.
RELIABILITY EVALUATION OF WDM NETWORKS WITH LINK CAPACITY AND HOP CONSTRAINTS
215
