
METRIC SUITE FOR DIRECTING THE FAILURE MODE
ANALYSIS OF EMBEDDED SOFTWARE SYSTEMS
Guido Menkhaus, Brigitte Andrich
Computer Science Department
University of Salzburg, Austria
Keywords:
Failure mode and effects analysis, software metrics, software design.
Abstract:
Studies have found that reworking defective requirements, design, and code typically consumes up to 50
percent of the total cost of software development. A defect has a high impact when it has been inserted in
the design and is only detected in a later phase of a project. This increases project cost, time and may even
jeopardize the success of a project. More time needs to be spent on analysis of the design of the project.
When analysis techniques are applied on the design of a software system, the primary objective is to anticipate
potential scenarios of failure in the system. The detection of defects that may cause failures and the correction
is more cost effective in the early phases of the software lifecycle, whereas testing starts late and defects found
during testing may require massive rework. In this article, we present a metric suite that guides the analysis
during the risk assessment of failure modes. The computation of the metric suite bases on Simulink models.
We provide tool support for this activity.
1 INTRODUCTION
The success of mission-critical applications depends
very much on the correctness of the contributing em-
bedded software systems. To ensure correctness, such
software systems are developed in accordance with
strict standards that dictate the steps to be taken in
its development process, the objectives that must be
accomplished, the reviews to be performed, and the
documents that are required to be produced (Pasetti,
2002). Systems that fail and cause catastrophic
consequences on the system are said to be safety-
critical (Kopetz, 1997).
The workload in the design and implementation
of embedded systems is shifting continuously from
hardware to software. At the same time the complex-
ity is growing due to the increasing functionality pro-
vided by embedded systems. Validating the correct-
ness of the software systems in mission-critical ap-
plications with series of tests is paramount to show
that hardware and software failures cannot place the
application in an unsafe state (Goddard, 2000). How-
ever, testing has its limits: The deviation between the
operational and the testing environment and the dif-
ficulty to reproduce those operational environments
limits the failure rates that can be verified empirically
and thus the detection of the number of risky compo-
nents of a system. This can lead to a misunderstand-
ing of the systems reliability properties.
To reduce the risk of software failures, an early and
thorough analysis identifying critical components in
the design is necessary. The Failure Mode and Effects
Analysis (FMEA) is a reliability analysis method that
aims at eliciting and evaluating potential risks by
identifying failure modes of system components. It
determines their effects and influence on the system
and recommends actions to suppress these effects and
eliminate the causes of the failure modes (Pentti and
Atte, 2002). A FMEA on the design level assessing
the risks can be performed early in the software de-
velopment process. The objective is to minimize the
impact of failure modes resulting from the analysis
at a time when changes to the software system can
be made cost effectively (Goddard, 2000). The de-
sign phase is a critical phase in the lifecycle of a soft-
ware system, since reworking a defective design and
resulting code can consume 40 to 50 percent of the to-
tal cost of software development (McConnell, 1996).
This indicates the necessity to analyze the design of
a software system thoroughly prior to construction
and testing. A FMEA is applied in regular inter-
vals and checks whether the recommended actions
266
Menkhaus G. and Andrich B. (2005).
METRIC SUITE FOR DIRECTING THE FAILURE MODE ANALYSIS OF EMBEDDED SOFTWARE SYSTEMS.
In Proceedings of the Seventh International Conference on Enterprise Information Systems, pages 266-273
DOI: 10.5220/0002519902660273
Copyright
c
SciTePress

were taken and successfully implemented to guaran-
tee constant improvement of the system under analy-
sis. This makes the FMEA tedious, laborious and
time-consuming to carry out. Therefore it is neces-
sary to be focused when conducting a FMEA (Parkin-
son et al., 1998; Montgomery et al., 1996).
In this article we present a suite of metrics that
guide the analysis team during the risk assessment of
failure modes during a FMEA. Metrics are computed
in the design process as soon as models of the soft-
ware system exist. They identify the most complex
and instable and thus most error-prone parts of a soft-
ware system. Their results support the analysis team,
which performs the FMEA, in their decision-making
process and let them focus the analysis on the risky
parts of a software system.
The remaining of the paper is structured as follows:
Section 2 discusses related work. The FMEA method
is reviewed in Section 3 and Section 4 discusses a
metric suite providing support to perform a FMEA.
Results are presented in Section 5 and Section 6 con-
cludes the article with a brief talk about our future
work.
2 RELATED WORK
Analysis techniques can broadly be divided into three
categories. Formal verification, simulation and in-
formal analysis processes. Formal verification is a
model-based technique. Models are built from system
and software specifications. Simulation uses models
that are built during the development process to ver-
ify the design of the software and informal analysis
processes build models during the analysis process.
• Formal verification. Formal verification requires
models that can be mathematical exploited to show
correctness of a system (Yovine, 1998). For the
models to be correct, they must be built from un-
ambiguous specifications (Hohmann, 2004). How-
ever, complete and unambiguous specifications are
difficult to attain. Any simplification or abstraction
may hide details that may be critical to the correct
verification of the application (Hailpern and San-
thanam, 2002). This is the reason why only specific
aspects are formally verified. For example, the reli-
ability of a system does not necessarily depend on
the complete correctness of the system, but rather
on a set of aspects and features (such as timing
constraints) that the system should exhibit (Amnell
et al., 2002; Halbwachs, 1997; Yovine, 1997).
• Simulation. Rapid prototypes can be viewed as
simulating systems. The simulation allows early
validation of the system. Ideally, production code
can be generated from the simulated systems to
avoid wasting resources and the risk of introduc-
ing new defects during the reimplementation of the
code (Burnard, 2004; MathWorks, 2004). Goseva
et al. present a risk analysis on the architectural
level using UML models (Goseva-Popstojanova
et al., 2003). UML models are developed early in
the development process. A Markov model is con-
structed to obtain risk factors for specific scenarios
that are used to estimate the overall system risk fac-
tor.
• Informal analysis. Most analysis techniques are in-
formal and use the insight of the system architect.
The failure mode and effect analysis (FMEA) is an
analysis method that has been traditionally applied
at the hardware level. The FMEA methodology is
here applied to software system. Goddard proposes
different techniques for a software FMEA (God-
dard, 2000).
The architecture tradeoff analysis method (ATAM)
is used to base architectural design decisions on ra-
tional goal-based attributes (Kazman et al., 1999).
Quality attributes such as modifiability, reliability,
and security are measured using inspections. Sce-
narios guide the analysis in the identification of
risks, non-risks, sensitivity and tradeoff points in
the architecture.
We present an approach that uses simulation mod-
els that are later used for production code generation.
Metrics help identifying critical components that are
candidates to careful informal analysis, and design,
implementation, and testing.
3 OVERVIEW OF FMEA
The FMEA was originally developed for the system
and hardware level, where potential risks and failure
modes are known due to the natural limits of the world
of engineering and immutable physical laws. US Mil-
itary, for example, applied the method to evaluate the
reliability of system and equipment and to predict the
impact of their failure on the military mission’s suc-
cess. It was adopted by the aerospace and automo-
tive industry and incorporated into their quality con-
trol plans.
The FMEA helps determining failure modes, pro-
jecting their effects, identifying their causes, design-
ing detection and prevention mechanisms, and ad-
vising recommended actions (SAE, 2002). Figure 1
shows the line of causal relationship between faults,
errors and failures. The FMEA is developed along
that line of cause and effect (Doerenberg, 2004).
• Fault. The cause of a failure is a fault that ranges
from specification and design defects to physical or
human factors.
METRIC SUITE DIRECTING THE FAILURE MODE ANALYSIS OF EMBEDDED SOFTWARE SYSTEMS
267
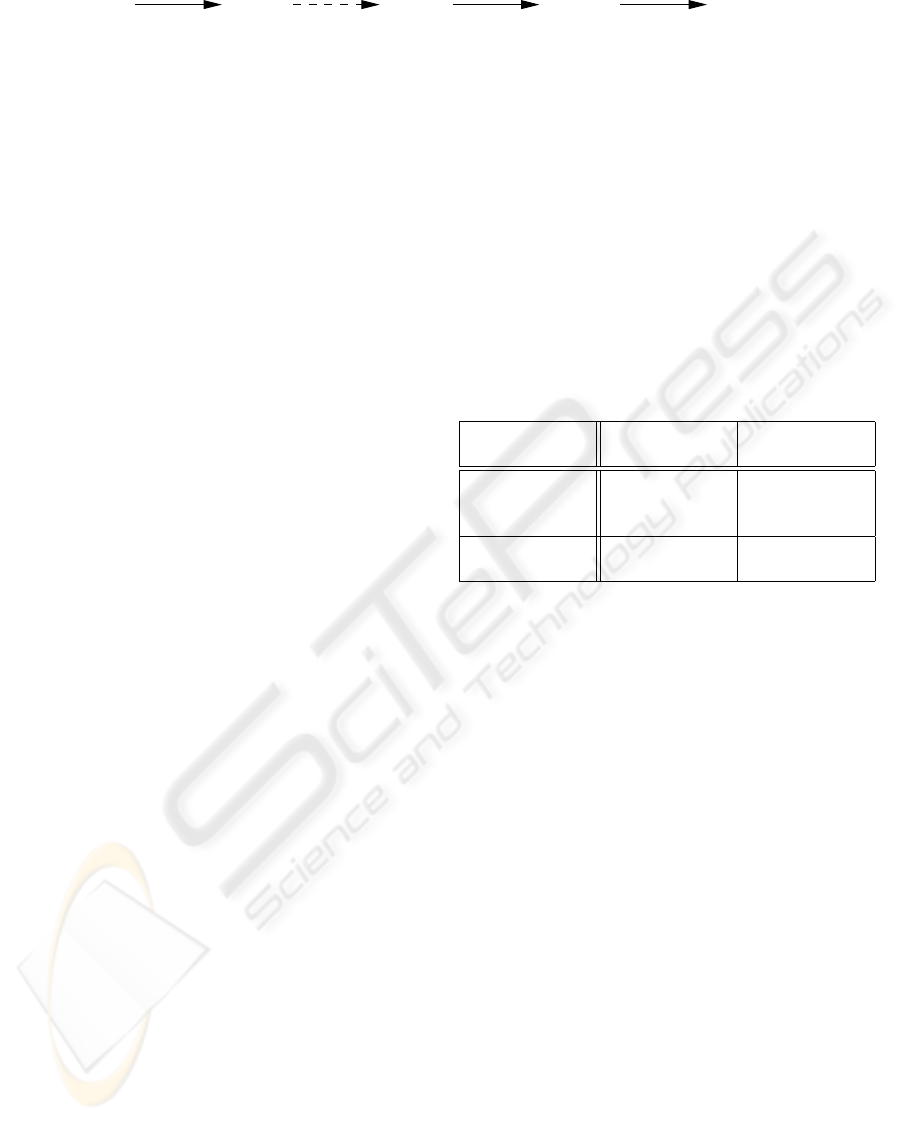
causes
Fault
propagates
Failure Fault
activates
Error Error
...
leads to
Figure 1: Causal relationship between faults, errors, and failures.
• Error. An error is a design flaw or a deviation from
the desired or intended state of a system.
• Failure. A failure mode is defined as the manner
in which a component, subsystem, or system could
potentially fail to meet or deliver the intended func-
tion.
• Failure Effect. The actual consequences of a sys-
tem behavior in the presence of a failure.
• Screening Questions. Screening questions (Kaz-
man et al., 1999) aim at detecting design deficien-
cies for specific quality requirements, such as per-
formance, safety, or robustness that the software
system requires to meet.
• Recommended Actions. Actions that are rec-
ommended for implementation to identify failure
modes and to reducing the probability of their oc-
currence.
• Risk priority number. Failure modes are ranked
according to the risk priority number (RPN). The
RPN of a failure is computed as the product of (1)
the severity of the failure’s effect, (2) the likelihood
of the detection of the error leading to the failure
and (3) the frequency of the occurrence of the error
cause.
When conducting an FMEA, the following four
steps need to be performed:
1. Identification of the system and its subsystems and
components.
2. Determination of failure modes, effects, and possi-
ble causes, associated with the subsystems and its
components.
3. Assessment of the risk of the failure modes.
4. Documentation and risk reduction activities.
3.1 FMEA in the Software System
Lifecycle
The software system lifecycle can be represented by
the V-model (Figure 2) (Burnard, 2004). The left side
of the V describes the design process for the construc-
tion of the system, starting from the requirements de-
finition, followed by the system design and becom-
ing more detailed at every step until the implementa-
tion phase, where the code is created. The implemen-
tation phase lies between decomposition and design
(left side of the V) and the integration and verification
(right side of the V). The right side of the V covers
the different testing phases, which relate to specific
design phases of the left side of the V. The Design
FMEA is applied in parallel to the decomposition and
design phase of the software system lifecycle and cov-
ers the analysis process performed during the specific
design phases.
Both approaches, analysis and testing, aim at pro-
ducing more reliable and safe software (Doerenberg,
2004). For the comparison of the two different ap-
proaches a taxonomy of analysis and testing is estab-
lished (Fenelon et al., 1994). The taxonomy in Table 1
Table 1: Taxonomy of analysis and testing
Known Unknown
causes causes
Known Testing: Testing:
effect Behavioral Deductive
analysis analysis
Unknown Inductive Exploratory
effect analysis analysis
distinguishes four different categories, which are rep-
resented as behavioral, deductive, inductive, and ex-
ploratory analysis. Each of the categories is identi-
fied by two characteristics, whether causes and effects
are known or unknown. Referring to the taxonomy of
analysis, software testing and analysis techniques are
each mapped onto two categories.
• Behavioral Analysis. If software testing validates
the software system behavior, the causes and the
effects are known.
• Deductive Analysis. If software testing is used as
deductive analysis to find defects and remove their
faults, the causes are unknown and the effects are
known.
• Inductive Analysis. The FMEA is reliability analy-
sis method that deals with known causes and un-
known effects. The FMEA aims at fault avoidance.
• Exploratory Analysis. Using lists of failure modes
and screening questions, neither causes nor effects
are known and the analysis process is exploratory.
The results of a FMEA include failure modes, ef-
fects, causes, and detection and protection mecha-
nisms. The analysis team identifies design prob-
lems, analyzes them and improves test design. Failure
modes are prioritized using the RPN that is computed
for each failure mode. The failure modes with the
highest ranking RPN are selected and recommended
ICEIS 2005 - INFORMATION SYSTEMS ANALYSIS AND SPECIFICATION
268
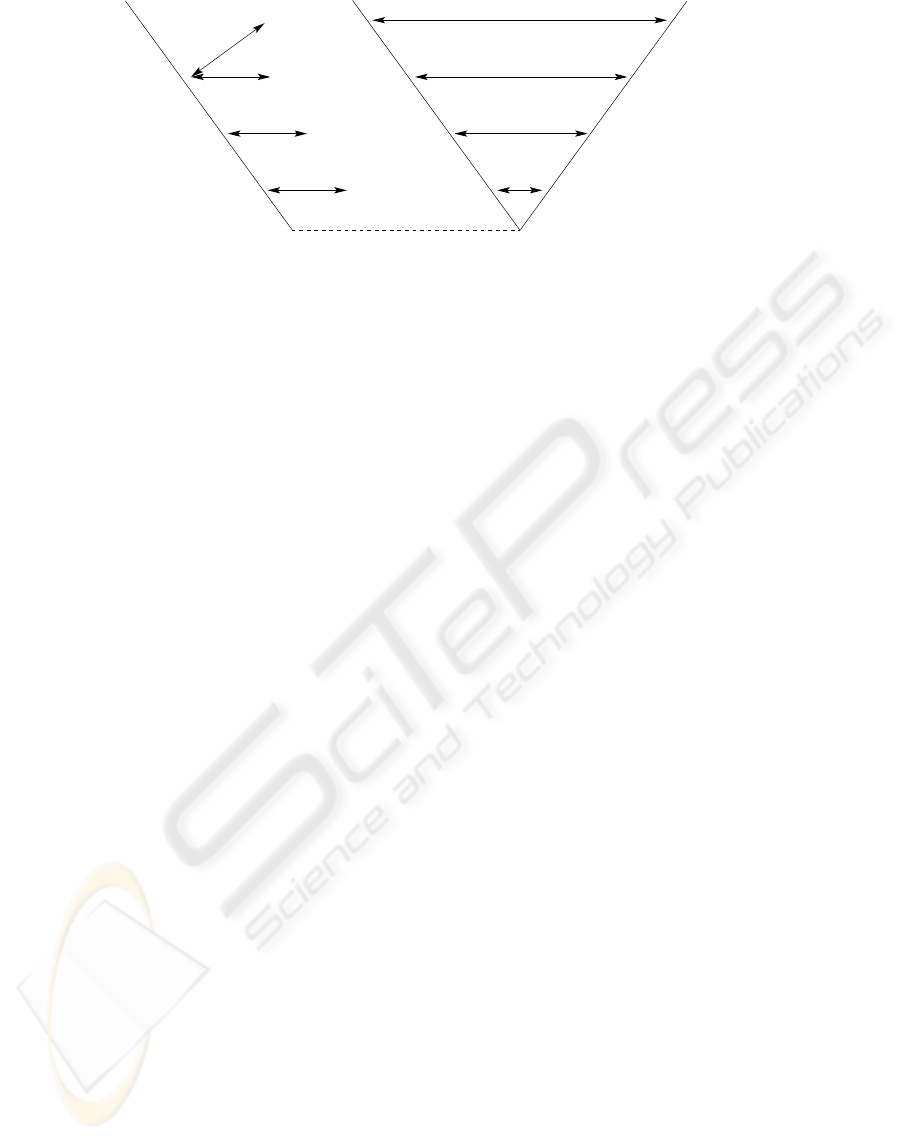
Design
Design
Unit Test
System Test
Integration Test
Implementation
Requirements
Component, Module
Design FMEA
System Design
Definition
applied to
subsystems
Design FMEA
FMEA
applied to
components
system
applied to
Acceptance Test
Subsystem
Figure 2: FMEA applied to the software system lifecycle.
actions are determined, such as changes in the design
that reduce the probability of the occurrence of a po-
tential failure.
The implementation of a FMEA demands team ef-
fort. Performing and controlling a FMEA in regular
intervals is laborious and time-consuming. Therefore,
the analysis requires focusing on components that are
more likely to cause failures. Identifying those com-
ponents allows for redesigning them early in the soft-
ware system lifecycle and directing intensive testing
effort towards those components. The use of met-
rics early in the design process guides the analysis
team during the risk assessment with RPNs, which is
the most exigent part of the FMEA. Metrics are used
to identify the most complex, instable and thus most
error-prone parts of the system. This reduces the time
spent on the assessment of failure modes and their re-
lated components for the analysis team.
4 METRICS IN MODEL-BASED
DEVELOPMENT
Model-driven architecture specifies a system using a
set of models. Models separate the specification of
system functionality from the specification of the im-
plementation of that functionality on a specific tech-
nology platform (Mukerji, 2001). The trend to spec-
ifying a system using models as a representation of
the system is growing in the embedded industry. The
increase of the computing power of microprocessors
has been reinforcing the benefits of implementing em-
bedded control functionality in software (Horowitz
et al., 2003). As the complexity of embedded con-
trol applications increases, it is essential to introduce
means to master the complexity of the application
and to define adequate methods and tools for building
such control applications (Kopetz and Bauer, 2003;
Menkhaus et al., 2004).
Models provide abstractions of a system that al-
low for reasoning about that system by ignoring ex-
traneous details while focusing on relevant ones. All
forms of engineering rely on models to understand
complex, real-world systems. Models are used in
many ways: to predict system qualities, reason about
specific properties and provides characteristics of the
overall confidence in the behavioral software proper-
ties. The models may be developed as a precursor
to the implementation of the physical system, or an
implementation can be derived from the model auto-
matically (Brown, 2004). However, models are likely
to become complex and instable as the model is de-
veloped, extended and modified. The quality of the
model suffers as the complexity increases (Lehmann,
2003).
Analysis activities are means to improve the de-
sign of a model and help decreasing design deficien-
cies. Metrics guide the analysis activities. They can
broadly be classified into two categories: Source code
based syntactic metrics and semantic metrics:
• Syntactic metric. Syntactic metrics are computed
on the basis of source code. They are applied to
identify the most complex and therefore most error-
prone and hard to test parts of a system. However,
source code-based metrics are subject to distortion
due to the programmer’s style and they can only be
applied after the implementation phase (Stein et al.,
2004a).
• Semantic metric. Semantic metrics assess the qual-
ity of software (Stein et al., 2004b). Because se-
mantic metrics do not rely on the syntax or struc-
ture of source code, they can be computed early
in the software system lifecycle from requirements
or design specifications before the system has been
implemented. However, semantic metrics lack of a
common and universal representation and are based
on the vague notion of ideas and concepts. There-
fore, semantic metrics cannot be automatically
computed. Worse, in most projects requirements
and specifications are incomplete, change often and
most completed systems have implemented only a
small fraction of the originally-proposed features
METRIC SUITE DIRECTING THE FAILURE MODE ANALYSIS OF EMBEDDED SOFTWARE SYSTEMS
269

and functions specified in the requirements (Group,
2004).
Automatic computation is possible only if the no-
tion of concepts and ideas are mapped onto a nota-
tion of models for software system representation.
We have specified and implemented a metric suite
that is computed from hierarchical Simulink mod-
els (MathWorks, 2004).
Simulink was originally designed for the simula-
tion of control laws, but has recently established itself
as standard modeling tool for embedded software de-
velopment. For modeling, Simulink provides a graph-
ical user interface for building models as block dia-
grams. It includes a comprehensive block library of
sinks, sources, components, and connectors. Blocks
interact via connectors and input and output ports de-
fine logical points of interaction between blocks. Af-
ter the model has been defined it can be simulated and
code can be produced automatically using a code gen-
erator. Using the generated code, syntactic based met-
rics could be applied, but the code generator produces
unreachable code, which represents inefficiency in the
code generators implementation of the model that fal-
sifies the results of the metrics (Burnard, 2004). Us-
ing metrics, design models that cannot even be simu-
lated but are developed already early in the software
system lifecycle, can be submitted to analysis.
We compute metrics for two categories of design
aspects: Complexity and instability of models. The
metrics implemented in our Simulink Model Metrics
Calculator (SMMC) are the following:
• Cyclomatic Complexity (CC). CC measures the
complexity of the control flow graph of a sys-
tem (Watson and McCabe, 1996).
• Instability of block (IOB). A block in a system is in-
stable if there is a high probability that it is subject
to changes and modifications (Martin, 1995).
• Instability of system (IOS). IOS is closely related
to the IOB metric, except that the complete system
(current system or subsystem of the model) influ-
ences the metrics computation.
Simulink models are directed graphs and the met-
ric calculations are based on directed graphs, repre-
senting simplified Simulink models. Simulink models
consist of a set of subsystems S. A subsystem con-
tains a set of other subsystems and blocks. Consider-
ing a Simulink model as a directed graph, Simulink
blocks are denoted as vertices, and connectors are
considered as edges. Two vertices are connected to
one another if there is an edge directly connecting the
two vertices. Formally, a directed graph
−→
G = (V,
−→
E )
is a pair consisting of a vertex set V and a set of di-
rected edges
−→
E ⊆ V × V =:
−→
E
∗
where
−→
E
∗
is the set
of all possible directed edges.
Cyclomatic Complexity. The cyclomatic complex-
ity is based on the structure of a software control flow
graph and measures its complexity. It is the min-
imum number of paths that can, in (linear) combi-
nation, generate all possible paths through the mod-
ule (Watson and McCabe, 1996). In a Simulink model
the control flow graph is already given.
Each flow graph of a Simulink subsystem s ∈ S
consists of vertices (blocks) v ∈ V and edges (con-
nectors) e ∈ E. The vertices represent computational
statements or expressions, and the connections repre-
sent transfer of control and data between vertices. The
cyclomatic complexity is defined for each subsystem
s to be:
CC(s) = e
s
− v
s
+ 2,
where e
s
and v
s
represent the number of edges and
vertices in the control flow graph of a Simulink sub-
system. The normalized CC (CC
n
) of a subsystem
is obtained by normalizing the CC with respect to the
sum of complexities of all subsystems in a model
CC
n
(s) =
CC(s)
P
t∈S
CC(t)
The cyclomatic complexity measure correlates with
defects in software modules. Complex software is
error-prone, hard to understand, to modify and to test.
With the CC
n
metric complex parts of a software sys-
tem are identified.
Instability of Blocks. Blocks that are stable are
both independent and highly responsible. Blocks are
independent, if they do not depend upon the results
of other blocks. Blocks are called responsible, if
changes of this block have a strong and wide-ranged
impact on other blocks (Martin, 1995). The responsi-
bility, independence and stability of a category can be
computed by measuring the interaction of blocks with
other blocks.
The number of connections between blocks
(CBB) represents the number of blocks to which a
block is connected. A block v has a set of connected
blocks that include the number of source blocks
(S(v)) and the number of destination blocks (D(v)).
Source blocks are blocks from which the output is
used as input for the block under analysis. Destina-
tion blocks use the output of the block under analysis
as input.
Efferent CBB counts the number of source blocks
for each block, i.e. the number of blocks on which
the block under analysis depends: CBB
e
(v) =
S(v). Afferent CBB counts the number of destina-
tion blocks for each block, i.e. the number of blocks
that depend on the block under analysis. CBB
a
(v) =
D(v). The IOB of a block v is then defined as the
number of blocks the block v depends on divided by
ICEIS 2005 - INFORMATION SYSTEMS ANALYSIS AND SPECIFICATION
270

the number of blocks v depends on plus the number
of blocks that depend on v:
IOB(v) =
CBB
e
(v)
CBB
e
(v) + CBB
a
(v)
IOB is an indicator of the blocks resilience to
change. A value of zero means maximal stability and
a value of one means maximal instability. Instable
subsystems are generally undesirable and are recom-
mended for careful design, implementation and test-
ing.
Instability of System. The IOS is closely related
to the IOB and draws identical conclusions. How-
ever, its computation is more global and it accounts
for influences of the complete system (i.e., current
system or subsystem of the model) on a block. The
IOS of a block v is defined as
IOS(v) =
BET
n
(v)
BET
n
(v) + CLO
n
(v)
where BET
n
denotes the normalized betweenness
metric and CLO
n
the normalized closeness metric.
The closeness metric was originally defined
by Sabidussi for strongly connected networks
in (Sabidussi, 1966) and has been generalized
in (Gulden, 2004). The betweenness metric was de-
fined by Freeman in (Freeman, 1977).
• Closeness. The closeness is a measurement of
responsibility that assigns high values to blocks
from which a multitude of other blocks can be
reached within a short average distance. The hori-
zon hor(v) of a block v ∈ V is defined as
hor(v) = {r ∈ V | there is a path from v to r}.
Let R(v) be the number of reachable blocks from
v (excluding v),
R(v) = |{r ∈ hor(v) − {v}}|
and D(v) the sum of the shortest distances to reach-
able blocks
D(v) =
X
r∈hor(v)−{v}
d
G
(v, t).
The outgoing distance d
G
(s, t) of a block t from a
block s in a network
−→
G = (V,
−→
E ) is defined by the
minimum length of all paths from s to t. Then the
closeness for block v is defined as follows:
CLO(v) =
(
R(v)
2
D(v)
if D(v) > 0
0 otherwise
The normalized closeness is obtained by normal-
izing the closeness with respect to the sum of the
closeness measures for all vertices:
CLO
n
(v) =
CLO(v)
P
u∈V
CLO(u)
.
A high CLO
n
value of a block reflects responsi-
bility and points out that many other blocks can be
reached within a short average distance. In case of
an error originating in a faulty block the error prop-
agation correlates to the CLO
n
value of the faulty
block. A high CLO
n
value means that a possible
error reaches many other blocks in a short time.
• Betweenness. The betweenness is a measurement
that assigns high values to blocks on which other
blocks are most dependent. For the calculation of
betweenness the dependency (DEP) is computed.
Let SP (s, t) be the number of the shortest paths
from s to t, and let SP (s, t|v) be the number of the
shortest paths from s to t using v as an inner block.
The dependency of a block s on a single block v is
then defined as follows:
DEP (s|v) =
X
tǫV
SP (s,t|v)
SP (s,t)
if SP (s, t) > 0
0 otherwise
The betweenness is calculated according to:
BET (v) =
X
sǫV
DEP (s|v)
The normalized betweenness is then defined as
BET
n
(v) =
BET (v)
P
u∈V
BET (u)
A high BET
n
value of a block indicates a high av-
erage dependency on that block of all other blocks
in the model. The calculation of this metric iden-
tifies blocks that are most important to the model
and for which the most analysis and testing effort
should be spent.
5 RESULTS
The automated computation of metrics fosters per-
forming a focused and effective FMEA. It supports
the analysis team during the application of a FMEA.
We have developed the Simulink Model Metrics Cal-
culator (SMMC) that computes the metric suite on
Simulink models. The SMMC parses Simulink mod-
els and stores the information in a database. Based
on this information, the SMMC computes the metric
suite and presents the results in a graphical user inter-
face.
We show the computation of the metric suite on
the well-known Simulink Automotive Engine Tim-
ing Model (Figure 3). It presents a model of a four-
cylinder spark ignition engine from the throttle to the
crankshaft output. Within this simulation, a triggered
subsystem models the transfer of the air-fuel mixture
from the intake manifold to the cylinders via discrete
valve events. This takes place concurrently with the
METRIC SUITE DIRECTING THE FAILURE MODE ANALYSIS OF EMBEDDED SOFTWARE SYSTEMS
271
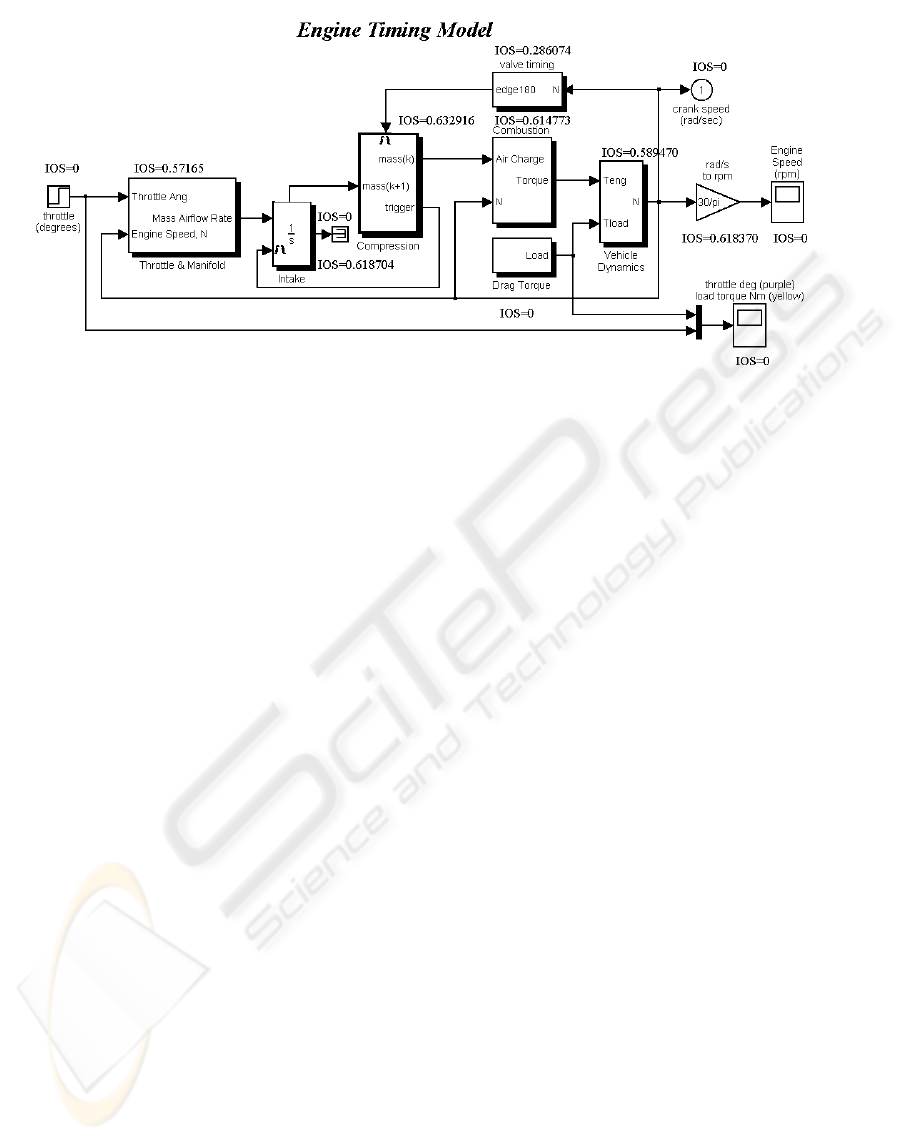
Figure 3: Instability of system metric for the top-level subsystem of the Simulink Engine Timing Model.
continuous-time processes of intake flow, torque gen-
eration and acceleration (MathWorks, 2004).
The results of the computation of CLO
n
, BET
n
and IOS for the Engine Timing Model are shown in
Figure 3. Figure 3 shows that the results for the IOS
recommend the Compression and the Intake subsys-
tem as candidates for detailed analysis and testing ef-
fort. They account for the two highest IOS metric
values. The two subsystems are central to the Engine
Timing Model having a multitude of input and output
ports and their outputs influence several other blocks.
6 CONCLUSION
The Failure Mode and Effect Analysis (FMEA) is
a projective analysis method. It helps determining
failure modes, effects, causes, and recommended ac-
tions suggesting additional detection and prevention
mechanisms. The FMEA is an analytical technique
utilized to analyze systems, subsystems, and com-
ponents. It focuses on failure modes caused by de-
sign deficiencies and is applied in the design phase of
the software system lifecycle. The risk priority num-
ber (RPN) computation helps prioritizing the failure
modes, identifying the most critical ones, and deter-
mining recommended actions that could eliminate or
reduce the likelihood of potential failures to occur.
Design deficiencies uncovered by the FMEA might
cause a change of the current design. Changing the
design is least expensive if the project is still in the de-
sign phase. Metrics are essential in guiding the analy-
sis team during the risk assessment of failure modes.
They are applied to identify the most complex and in-
stable and thus most error-prone parts of a software
system. Useful information is elicited automatically
with the help of the Simulink Model Metric Calcula-
tor.
In our future work we will refine the risk priority
quality statement to allow its application to arbitrary
Simulink models. We will extend the computation of
metrics on Simulink models and investigate how met-
rics can be used to derive test data and test cases from
models automatically.
ACKNOWLEDGEMENTS
This work was supported by MagnaSteyr
Fahrzeugtechnik and the FIT-IT Embedded Sys-
tems initiative of bmvit, Austria via the project
Model-Based development of Distributed Embedded
Control Systems (MoDECS). It is the result of the
ongoing work on ”Embedded System Quality and
Safety Analysis - Failure Mode and Effects Analysis
(FMEA) applied to Embedded Software”.
REFERENCES
Amnell, T., Fersman, E., Mokrushin, L., Pettersson, P., and
Yi, W. (2002). Times - A Tool for Modelling and Im-
plementation of Embedded Systems. In Proceedings
of 8th International Conference, TACAS 2002, volume
2280 of LNCS Springer, pages 460 – 464.
Brown, A. (2004). An Introduction into Model Driven Ar-
chitecture. Technical report, IBM.
Burnard, A. (2004). Verifying and Validating Automatically
ICEIS 2005 - INFORMATION SYSTEMS ANALYSIS AND SPECIFICATION
272

Generated Code. In Proc. of International Automotive
Conference (IAC), Stuttgart, Germany.
Doerenberg, F. (2004). Analysis and Synthesis of Depend-
able Computing and Communication Systems, chapter
Dependability Impairments: Faults, Errors and Fail-
ures. www.nonstopsystems.com. to be published.
Fenelon, P., McDermid, J., Nicholson, M., and Pumfrey,
D. (1994). Towards Integrated Safety Analysis and
Design. ACM Computing Reviews, 2(1):21 – 32.
Freeman, L. (1977). A set of measures of centrality based
on betweenness. Sociometry, 40:35 – 41.
Goddard, P. L. (2000). Software FMEA Techniques. In
IEEE Proceedings Annual Reliability and Maintain-
ability Symposium.
Goseva-Popstojanova, K., Hassan, A., Abdelmoez, A.
G. W., Nassar, D., Ammar, H., and Mili, A. (2003).
Architectural-Level Risk Analysis Using UML. IEEE
Transaction on Software Engineering, 29(10):946 –
960.
Group, T. S. (1994 – 2004). CHAOS: A Recipe for Success.
Technical report, The Standish Group.
Gulden, C. (2004). Algorithmic analysis of large net-
works by computing structural indices. Technical re-
port, Fachbereich Mathematik und Statistik, Univer-
sit
¨
at Konstanz, 78457 Konstanz, Germany.
Hailpern, B. and Santhanam, P. (2002). Software debug-
ging, testing and verification. IBM Systems Journal,
41(1):4–12.
Halbwachs, N. (1997). Synchronous Programming of Reac-
tive Systems. Kluwer.
Hohmann, W. (2004). Supporting Model-Based Develop-
ment with Unambiguous Specifications, Formal Veri-
fication and Correct-By-Construction Embedded Soft-
ware. Technical report, Esterel Technologies.
Horowitz, B., Liebman, J., Ma, C., Koo, T. J., Sangiovanni-
Vincentelli, A., and Sastry, S. (2003). Platform-
Based Embedded Software Design and System Inte-
gration for Autonomous Vehicles. IEEE Transaction,
91(1):100 – 111.
Kazman, R., Klein, M., and Clements, P. (1999). Evalu-
ating Software Architectures for Real-Time Systems.
Annals of Software Engineering, 7:71 – 93.
Kopetz, H. (1997). Real-time Systems: Design Program-
ming for Distributed Embedded Applications. Kluwer.
Kopetz, H. and Bauer, G. (2003). The Time-Triggered Ar-
chitecture. IEEE Special Issue on Modeling and De-
sign of Embedded Software, 23(1).
Lehmann, M. (2003). Software evolution - cause and ef-
fects. In Proceedings of the 9th International Stevens
Awards at IEEE ICSM.
Martin, R. (1995). OO Design Quality Metrics (An Analy-
sis of Dependencies). ROAD.
MathWorks (2004). Simulink. www.mathworks.com.
McConnell, S. (1996). Software Quality at Top Speed.
http://www.stevemcconnell.com/articles/art04.htm.
Menkhaus, G., Holzmann, M., and Fischmeister, S. (2004).
Time-triggered Communication for Distributed Con-
trol Applications in a Timed Computation Model. In
Proceedings of DASC04.
Montgomery, T., Pugh, D., Leedham, S., and Twitchett, S.
(1996). FMEA Automation for the Complete Design
Process. In IEEE Proc Annual Reliability and Main-
tainability Symposium, pages 30 – 36.
Mukerji, J. (2001). Model driven architecture. Technical
Report ormsc//01-07-01, OMG.
Parkinson, H., Thomson, G., and Iwnicki, S. (1998). The
development of an FMEA methodology for rolling
stock remanufacture and software quality. ImechE
Seminar Publication, 20:55 – 66.
Pasetti, A. (2002). A Software Framework for Satellite Con-
trol Systems Methodology and Development. Springer,
LNCS Serie.
Pentti, H. and Atte, H. (2002). Failure mode and effects
analysis of software-based automation systems. Tech-
nical Report STUK-YTO-TR 190, STUK, Helsinki.
Sabidussi, G. (1966). The centrality index of a graph. Psy-
chometrica, 31:581 – 603.
SAE (2002). Surface vehicle recommended practice. Tech-
nical Report SAE-J1739, Society of Automotive En-
gineers, Warrendale, USA.
Stein, C. et al. (2004a). A new suite of metrics for object-
oriented software. Computer Science Department,
University of Alabama in Huntsville, Huntsville, AL
35899 USA.
Stein, C., Etzkorn, L., and Utley, D. (2004b). Comput-
ing Software Metrics from Design Documents. In
ACMSE.
Watson, A. H. and McCabe, T. J. (1996). Structured Test-
ing: A Testing Methodology Using the Cyclomatic
Complexity Metric. Technical Report NIST Spec.
Publ. 500-235, National Institute of Standards and
Technology, Gaithersburg.
Yovine, S. (1997). A verification tool for real-time systems.
International Journal of Software Tools for Technol-
ogy Transfer, 1(1/2):123 – 133.
Yovine, S. (1998). Embedded Systems, chapter Model-
checking timed automata. LNCS. Springer.
METRIC SUITE DIRECTING THE FAILURE MODE ANALYSIS OF EMBEDDED SOFTWARE SYSTEMS
273
