
MODEL DRIVEN DEVELOPMENT OF BUSINESS PROCESS
MONITORING AND CONTROL SYSTEMS
Tao Yu
Department of Computer Science, University of California at Irvine, USA
Jun-Jang Jeng
IBM T.J. Watson Research Center, New York, USA
Keywords: Model-Driven Development, Bus
iness Process, Monitoring, Control
Abstract: This paper describes a model-driven approach in monitoring and controlling the behaviour of
business
processes. The business-level monitoring and control requirements are first described by a series of policies
that can be combined together to construct a Directed Acyclic Graph (DAG), which can be regarded as the
Platform Independent Model (PIM) for the high level business solution. PIM provides a convenient and
clear way for business users to understand, monitor and control the interactions in the target business
process. Then the PIM is transformed to an executable representation (Platform Specific Model, PSM), such
as BPEL (Business Process Execution Language for Web Service) by decomposing the DAG into several
sub-processes and modelling each sub-process as a BPEL process that will be deployed to runtime.
1 INTRODUCTION
Business process monitoring and control systems
provide real-time information about execution status
of business process as well as performance
evaluation. By having this capability, business users
can configure, track and analyze desired key
performance indicators (KPI) and take actions. For
example, business managers want to identify and
resolve business problems such as whether customer
orders are delivered promptly, out of stock, etc.
Generally, business users that are doing process
monitoring and control are divided into three roles:
(1) Business Analyst
who defines KPIs to be
observed. An example of KPI can be the cycle time
to process customer order. (2) Data Specialist
who
defines the data logic required to filter, cleanse, and
correlate events. Correlation rules (patterns) are used
to specify what event patterns need be caught and
data carried in them should be extracted. (3)
Operation Manager
who defines what business
situations (or exceptions) must be monitored or
resolved as well as actions to be taken when some
situation occurs. E.g. when a server unreachable
exception occurs, monitoring system should send a
notification to administrator to ask him restart the
server.
Business users work together to design a
busi
ness process monitoring and control system.
After system design has been finished, KPIs,
correlation patterns and business situations are
defined and data sources identified. Traditional
development methods require the solution to be
developed from scratch. In this paper, we propose
using model-driven approach to develop business
process monitoring and control systems. Two
advantages can be stated for model-driven approach:
(1) Save cost and reduce development time:
Monitoring and control solution can be defined at
the business process level without being burdened
by implementation detail of target platform. There is
no need of navigating through development
lifecycle. (2) Increase the software quality: The
transformation algorithm to transform platform-
independent model (PIM) to executable
representation is similar to language compilers that
translate the higher-level instructions into native
processor instructions, which can be interpreted by
the machine. Once the transformation tool has been
well developed and thoroughly tested, it can be
reused and the quality of the software generated by it
can be guaranteed.
In general, the method of developing such
sy
stems consists of 5 steps as shown in Figure 1.
161
Yu T. and Jeng J. (2005).
MODEL DRIVEN DEVELOPMENT OF BUSINESS PROCESS MONITORING AND CONTROL SYSTEMS.
In Proceedings of the Seventh International Conference on Enterprise Information Systems - DISI, pages 161-166
Copyright
c
SciTePress
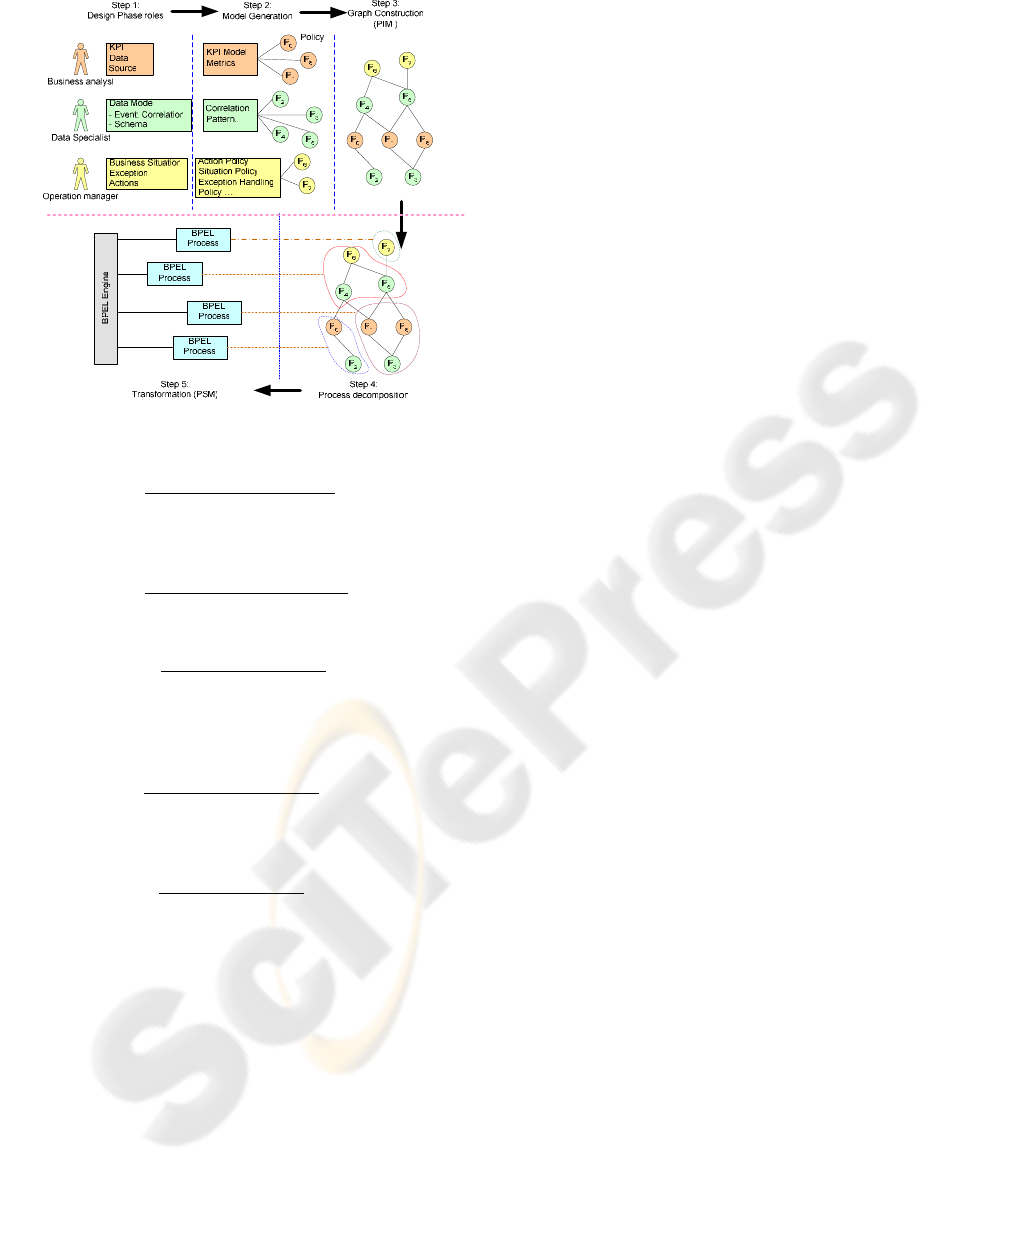
Figure 1: Model-Driven Approach for Business Process
Monitoring and Control
Step 1:
Business Design Phase where different
roles define the subset of the monitoring and control
solution at the business level (e.g. KPIs, situations,
actions, correlation rules).
Step 2:
Model Generation Phase where system
designers create a set of enforceable policies for the
models defined in step 1;
Step 3:
Composition Phase where policies
defined in Step 2 are composed into a directed
acyclic graph (DAG) that represents the platform-
independent model (PIM) for the monitoring and
control systems.
Step 4:
Decomposition Phase where the system
decomposes the generated DAGs from Step 3 into
several sub-processes that are transformable to
executable modules in the target platform;
Step 5:
Transform Phase where each sub-
process is transformed into an executable module. In
this paper, BPEL is used as the example of such
modules. Each BPEL process can be wrapped as a
service and they can communicate with each other
through event bus. By doing so, the PIM (policies)
can be transformed into PSM (BPEL) that can be
executed by an executable runtime engine.
The rest of this paper is organized as follows.
Section 2 introduces some background information
and related work. Section 3 talks about MDA and
our proposed MDA approach for business process
monitoring and control. Section 4 presents the
detailed information about process decomposition
and transformation. Section 5 gives an account of
our experience of using model-driven approach for
developing business process monitoring and control
systems. Section 6 summarizes the whole paper.
2 RELATED WORK
Model-Driven Architecture (MDA) that has been
defined by the Object Management Group (OMG) is
a new approach to application design and
implementation. It helps computer users solve
integration problems by supplying open, platform-
neutral interoperability specifications (OMG, 2001).
MDA approach is widely used for information and
service integration (Siegel, 2002). Our approach
provides a domain specific model-driven approach
based on MDA with specific target on business
process monitoring and control. Many business
process monitoring and control tools are developed
by different organizations, such as QName! from
mqsoftware (MQSoftware, 2004), TransactionVision
from Bristol Technology (TransactionVision, 2004).
The benefit brought by monitoring and control
include lower the process cost and faster the process
execution. However, they do not use model-driven
approaches.PloarLake Inc. (PolarLake, 2004),
provides a technology how to use BPEL and XML
to automating business process management. BPEL
is simply an example of transformation target in our
paper. Our approach can help BPEL solutions in a
much simpler way.
3 MODEL-DRIVEN APPROACH
FOR BUSINESS PROCESS
MONITORING AND CONTROL
MDA (Soley, 2000) is a framework of software
development. Models and model driven software
development are the key elements in MDA. A
typical model-driven development process includes
three steps: (1) Build a model with high level
abstraction. This model is a PIM that is independent
of any implementation technology. In our business
process monitoring and control system, the PIM is
the DAG constructed by a set of policies as shown in
step 3 of Figure 1; (2) Transform PIM into one or
more PSM. A PSM is related to a specific
implementation technology, such as J2EE model,
EJB model. In our system, we choose BPEL process
as target PSM; (3) Transform PSM to code to be
executed by machine. This step is usually completed
by the implementation technology related to the
PSM. In our system, BPEL process is interpreted
and executed by a BPEL engine.
ICEIS 2005 - INFORMATION SYSTEMS ANALYSIS AND SPECIFICATION
162

3.1 Policy Description
There are three groups of policies defined by
business analyst, data specialist and operation
manager: KPIs expressions, Correlation rules and
Action policies.
A KPI expression is made up of parameters and
operators. Based on parameter data types in KPI,
there are several categories of operators: Boolean,
Arithmetic, Relational, Set, String, Calendar, Vector
and etc. Table 1 shows some common operators in
each category. Some Examples of KPIs: (1)
process_time=response.timestamp-
request.timestamp (2) Server_Down = (Count
(serverdown_events) > 30) within 30 seconds
Business processes interact with one another and the
environment through events. Events are captured by
business process monitoring and control system.
Many of the captured events are meaningless to
specific monitoring and control system while others
need to be considered in a specific pattern.
Correlation rules (patterns) are used to specify the
event patterns that need be caught and data carried in
them should be extracted according to requirements.
The definition of a correlation rule includes a
number of rule-specific parameters (such as
threshold, time period), event selection criteria to
select events that relevant to the rule and actions
should take (defined by action policy) once the rule
fires (Bussani, 2003).
We define seven basic correlation rules for our
system: Match, Block Duplicates, Update Last,
Collection, Threshold, Sequence and Sequence
Absence. Match is the only stateless rule, in which
event are treated independently. All the others are
stateful, in which events rely on previous detected
events and they depend on each other. These rules
are defined based on IBM Zurich Correlation Engine
rule definition (Bussani, 2003). Correlation rules can
be defined using XML syntax. The format of rule
definition is shown in Figure 2 as follows.
<rule id = “rule identification”> --- Rule identifier
<rule type [attributes]> --- Rule Type
<selection criteria> --- Event selection criteria
…….
</selection criteria>
</rule type>
<action policy = “policy name”> … </action>
------------ Actions to take, defined by action policy
</rule>
Figure 2: Correlation Rule Definition
Action policy provides policy rules for system
behaviour in response to business situation. A
simple example of action policy is send notification
to administrator once server unreachable event has
been detected by correlation rules defined above.
Action policy can also be defined using XML
syntax. The definition of action policy includes a
number of policy-specific parameters, the target of
the policy ---- messages generated by action policy
will be sent to the defined target, a series of KPIs
used by policy (defined by KPI expression), a set of
correlation rules that triggered this policy (defined
above) as well as actions will take once the policy
has been triggered.
<policy name = “policy name”> --- policy name
<parameters> …. </parameters>
--- parameters will be used in policy
<target> …. </target>
--- destination for message generated by action policy
<metrics> …. </metrics> --- metrics used
<correlation rules>
--- correlation rules that trigger the policy
<rule id = “”>… </rule>
</correlation rules>
<action list> --- actions will take
<action function = “function name”>
….
</action>
</action list>
</policy>
Figure 3: Format of action policy definition
3.2 PIM construction
In a business process monitoring and control system,
business analyst, data specialist and operation
manager define different policies (KPIs, correlation
rules and action policies) for a business situation.
After all policies have been defined, the system will
compose them to form a DAG as the PIM for high
level business solution (as shown in step 3 of Figure
1).
The question is: How to combine different
policies into a DAG? Which policies should be
connected to each other? Each policy has a set of
input and output interface definitions describing the
message formats it expects to accept and to generate,
finding policy pairs is to match an input and an
output interface definition of two policies.
This problem is quite similar to the service
composition problem in Web service field, where we
need to integrate different services into a business
process. A lot of researches have been done in
semantic web service composition ([9,10]).
MODEL DRIVEN DEVELOPMENT OF BUSINESS PROCESS MONITORING AND CONTROL SYSTEMS
163
Currently only simple interface match checking
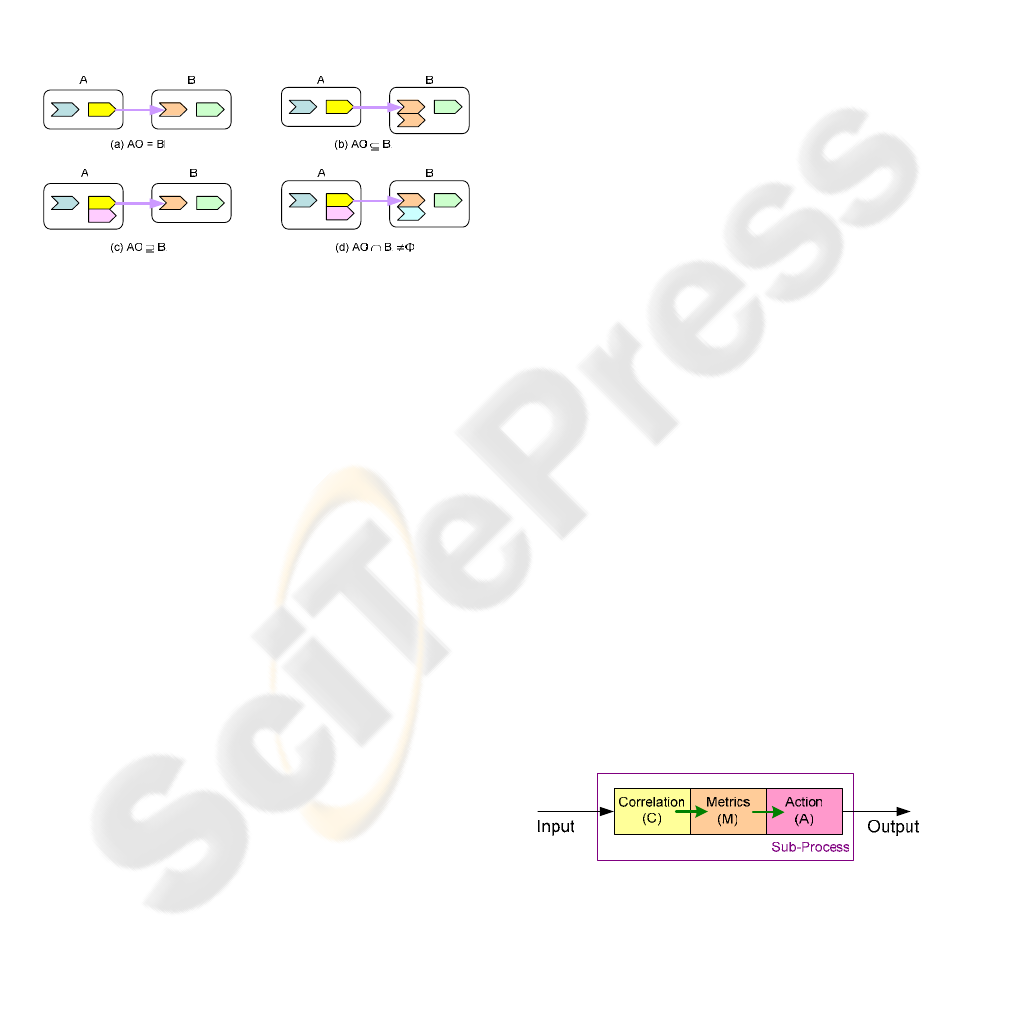
is used in our system . In following four conditions,
we define the condition when two policies’
interfaces match with each other. More matching
conditions will be added in our future work. (AO:
output of policy A, BI: input of policy B):
1. If AO == BI, match successful; (Figure 4.(a))
2. If AO
⊆
BI, match successful; (Figure 4.(b))
3. If AO
⊇
BI and the matching part can be
separated out from AO, match successful.
(Figure 4.(c)).
4. If AO ∩ BI ≠ ∅ and the matching part can be
separated out from AO and also from BI, match
successful. (Figure 4.(d))
Figure 4: Policy Interface Matching Condition
Obviously, the similarities of two policies
interfaces are decreased from condition 1 to
condition 4. If two policies interfaces match
successfully, we can add a directed link (from policy
A’s output to policy B’s input) between them.
Considering each policy as a node, a graph can be
constructed by adding links between all the
matching policy pairs. And because the special
features of business process monitoring and control
system, it must be a DAG. If there’s a loop exist in
the constructed graph, we can remove the link that
has the minimal similarity in the loop and continue
this step until there is no loop in the graph. This
DAG is the PIM for high level business solutions.
4 MODEL-DRIVEN APPROACH
FOR BUSINESS PROCESS
MONITORING AND CONTROL
A composed DAG cannot be transformed into
executable modules unless it can be decomposed
into sub-graphs each of which is transformable to
executable modules in target runtime platform. After
the DAG (PIM) has been constructed by connecting
policy pairs, we need to transform the PIM into one
or more PSM.
There are many kinds of PSM, e.g., BPEL,
workflows, Web services. We have been using
BPEL as our target PSM. Usually, it is too
complicated to present the entire PIM by a single
BPEL process. Firstly, the DAG is divided into
several parts, each of which is a sub-process and can
be transformed into a BPEL process. This task is
calle
P4, P5, P6,
whi
nt sets of sub-processes, which one is the
best
ppable when each sub-part is
pres
e
1.
ies can reside in more
2.
take the
predefined actions to generate outputs.
d model decomposition.
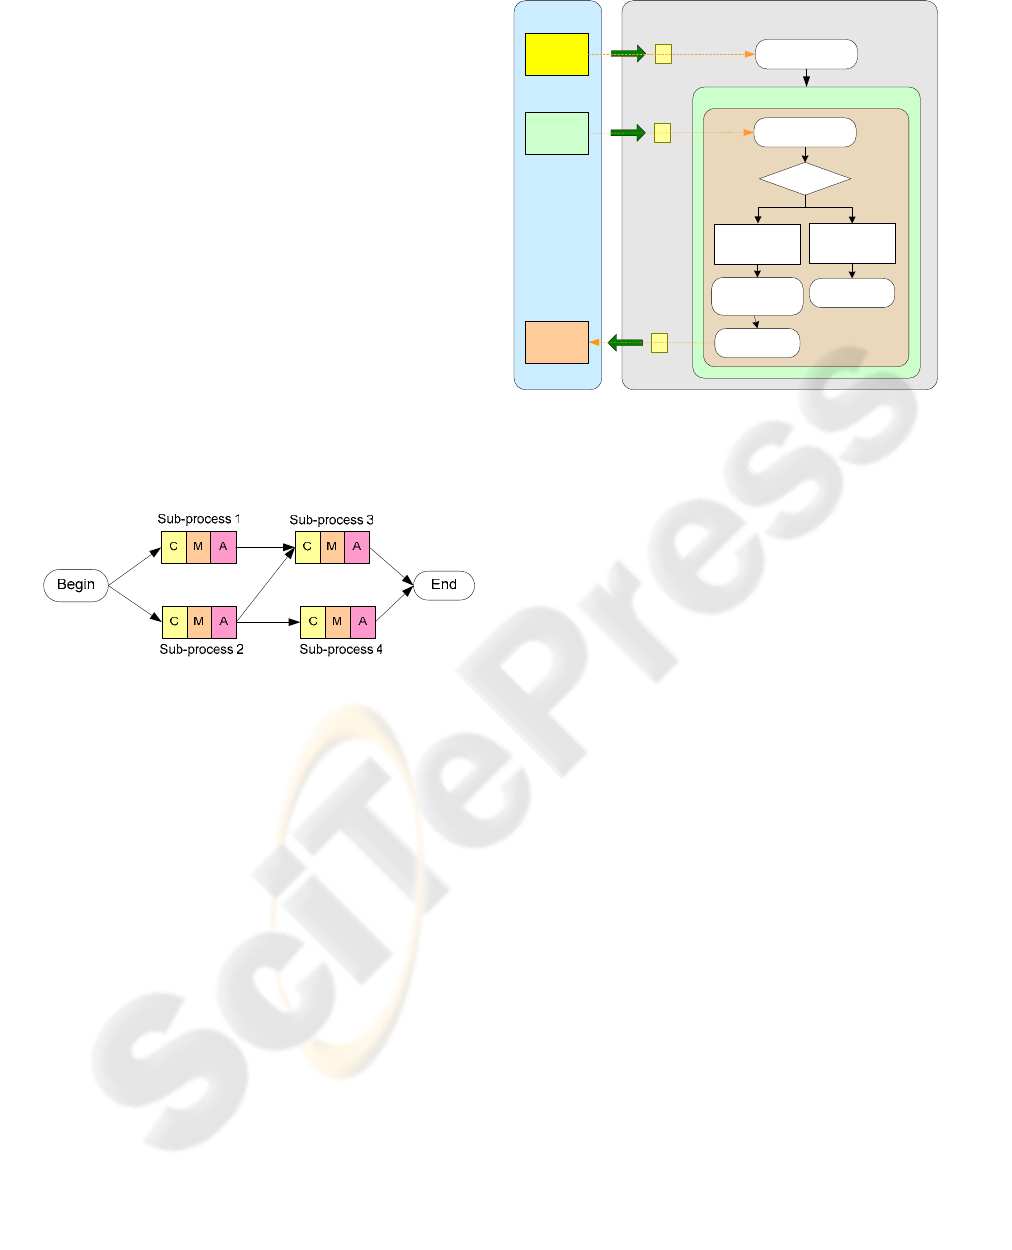
For example, we can decompose the DAG
shown in step 3 of Figure 1 into four sub-processes,
as shown in step 4. The sub-process 1 contains
policy P1, P3 and P8, sub-process 2 contains policy
P0 and P2, sub-process 3 contains policy
le sub-process 4 contains policy P7.
Several issues need to be considered during the
decomposition process: (1) Are there any criteria for
establishing a bottom level process component?
Which means, how do we decide when to stop the
process decomposition? (2) If there exists more than
one way to do the decomposition and generate
differe
?
The reason of decomposing models into smaller
ones is because, in many cases, it’s too difficult
(sometimes impossible) to transform the entire
complex PIM into one executable modules (for
example, a single BPEL process). So the basic
criterion for decomposition is to make sure the fact
that after decomposition, each sub-process can be
presented by a BPEL process and all generated
BPEL processes can communicate each other to
achieve the original objective. Thereby, model
decomposition is sto
entable as PSM.
To show the concepts, we show several basic
rul s to perform process decomposition as follows.
Each policy must be included in at least one
sub-process; Some polic
than one sub-processes;
Each sub-process contains at least one
correlation rule, one KPI expression and one
action policy, as shown in Figure 5. The
correlation rule takes inputs from outside or
from the output of other sub-processes and
passes them to metrics for some calculation.
The results produced by metrics expressions
will be passed to action policy and
Figure 5: Sub-process
3.
Decomposition based on correlation rules:
KPI calculations are based on the information
carried in events that are caught by correlation rules.
After KPIs are generated, action policies will be
triggered. So in model decomposition, the
ICEIS 2005 - INFORMATION SYSTEMS ANALYSIS AND SPECIFICATION
164
decomposition of PIM (i.e. DAG) can be divided
according to given correlation rules. Each rule can
be considered as a starting point of a sub-process,
and the KPIs and action policy related to the
correlation rule will be added to generate a complete
-
4. imple sub-processes to be
be s
ach of them
will e transformed to a BPEL process.
sub process.
Combine some small s
a bigger sub-process:
For all the sub-processes constructed on
correlation rules, some of them are very simple. For
example, the sub-process that contains Match
correlation rule may only filter some special events
out and extract the message from the event and
assign to another variable, finally, the message will
ent out to another sub-process by action policy.
If there are two sub-processes with Match rules,
one takes the other one’s output as its input, we can
combine them into a new bigger sub-process that
contains two Match rules. Figure 6 shows what the
system model looks like after decomposition. Four
sub-processes have been generated and e
b
Figure 6: Business process decomposition
and message exchanges among
sub-
ecomposition will be reported
in o
here the rule
is sequential event patterns (Figure 7).
There is always a tradeoff between the
complexity of each sub-process and the efficiency of
the whole system. If the whole system is divided to
very fine-grained, each sub-process only performs a
simple task but there are lots of sub-processes exist
and they must communicate with each other to
achieve the original objective. In this case, system
efficiency is decreased by large amount of
communications
processes.
On the other hand, if the whole system is
divided to a very few large-grained sub-processes,
each sub-process need to perform a lot of work and
tend to be complicated. Of course, there will be less
communications overhead and the system turns to be
more efficient. The detailed information and
algorithms for model d
ur future work.
Due to the space limitation, the detail of
generated BPEL modules is not presented in this
paper. Only an example of using BPEL to model
correlation rules is given as follows, w
Process Match
Partners
Event
<variable>
Montior
Admin
<Receive>
Process
Initializer
Initialization
<variable>
Notification
<variable>
Yes
While (true)
Sequence
<Switch>
<Pick>
OnMessage
<Invoke>
<case>
crietria
Match
<Assign>
Set Notification
<otherwise>
<Empty>
Figure 7: Rule Match
This process describes (1) Receiving “start
process” command from partner “Process Initializer”
(command =1 in Initialization variable) through
<Receive> activity defined by BPEL; (2) Keep
running to receive events messages from “Monitor”
through <Pick>; (3) A <Switch/Case> is used to
check whether the received event matches the
selection criteria; (4) If event matches the selection
criteria, contents of notification will be set by
<Assign> activity and sent out to “Admin” through
<Invoke>; (5) Go back to Step 2 and repeat Step 2 –
4 to detect all events that match the selection
criteria.
5 LESSONS LEARNED
We have applied this approach to developing supply
chain management systems in the domain of
microelectronic manufacturing (Jeng, 2004) and
transportation management systems. The
development time has been greatly reduced to 30-
40% of the originally defined development cycle. As
long as the policies defined by the business roles are
accurate and precise, the software generated is
guaranteed to run almost correctly.
As mentioned, we have used BPEL as our target
PSM. Our approach lead to a systematic way of
developing BPEL modules based on models that are
developed in a distributed fashion. The only factor
hard to be predicted is the overhead induced by
those generated BPEL modules. Since current
implementation of BPEL engine heavily depends on
database synchronization and our transformation
algorithms have not considered concurrency issues,
database access deadlock happen frequently. Hence,
MODEL DRIVEN DEVELOPMENT OF BUSINESS PROCESS MONITORING AND CONTROL SYSTEMS
165

generated BPEL modules need manual tuning to
achieve satisfied performance. Another issue is
tooling.
To make model driven approach to be
successful, high level business policies need to be
captured in an accurate manner. Due to lack of
policy tools, the early phases of development
process become disproportionately large.
In general, the contribution of our work lies on:
1. Propose a new approach (MDA approach) to
provide solution for business process
monitoring and control system, which is faster,
more cost-effective and reliable compared to
traditional way;
2. Present PIM by a DAG, which is constructed by
a series of policies (includes KPIs, correlation
rules and action policies) through interface
matching;
3. Transform PIM to executable representation
(BPEL in this paper) by first decomposing the
entire PIM into several sub-processes to
increase the feasibility and decrease the
complexity of transformation;
4. Show how to model different correlation rules,
which is the foundation of PIM, in BPEL
process. We are among the first ones that are
doing this kind of work.
6 CONCLUSION
In this paper, we have presented the model-driven
approach for developing business process
monitoring and control systems. The solution is first
described by the high level abstract model (PIM),
which is independent from platform and
implementation technologies. This PIM is presented
as a DAG that is constructed by a series of policies
described in XML. Then the PIM is decomposed
into several sub-processes that can be easily
transformed into an executable representation, such
as BPEL or JAVA. We use BPEL as the example to
show the model transformation.
There is still a lot of work need to be done in the
future: (1) Algorithms/rules for PIM construction
through interface matching; (2) Algorithms for
process decomposition in order to find a optimal
division for entire PIM; (3) More correlation rules
definition (currently, only 7 rules are defined); (4)
Prototype implementation for using BPEL to model
correlation rules; and (5) Prototype implementation
for business process monitoring and control system
to verify our proposed approach.
REFERENCES
Bussani, A., and Feridun, M., “Zurich Correlation Engine
(ZCE) --- Rule and Predicate Specification Document”
June 12, 2003
Fujii, K. and Suda, T., “Loose Interface Definition: An
Extended Interface Definition for Dynamic Service
Composition”. Proc. Of the First Annual Symposium
on Autonomous Intelligent Networks and Systems,
Los Angeles, CA. May 2002.
Jeng, J.-J., “Policy Driven Business Performance
Management”, to be presented in DSOM 2004.
“
Real-Time Business Transaction Monitoring”, Product
introduction in mqsoftware
http://www.mqsoftware.com/products/docs/QNamiFac
tSheet.pdf
OMG. "Model Driven Architecture - A Technical
Perspective",
by OMG Architecture Board MDA
Drafting Team, July, 2001. http://
www.omg.org/cgi-
bin/doc?ormsc/2001-07-01
“Automating Business Process Management with BPEL
and XML
”, a PolarLake Whitepaper.
http://www.polarlake.com/en/assets/whitepapers/Auto
matingBusinessProcesseManagement_BPEL_XML.pd
f
“Specification: Business Process Execution Language for
Web Services Version 1.1”
http://www-
106.ibm.com/developerworks/library/ws-bpel/#scopes
,
May 2003
Siegel, J., “Using OMG’s Model Driven Architecture
(MDA) to Integrate Web Services.” Object
Management Group. May, 2002.
http://www.omg.org/mda/presentations.htm
Soley, R., and OMG Staff Strategy Group, “Model Driven
Architecture,” November 2000.
TransactionVision, product information in Bristol
Technology.
http://www.bristol.com/transactionvision/
Zhang, R., Arpinar, B., and Aleman-Meza, B., “Automatic
Composition of Semantic Web Services”, ICWS’03,
Las Vegas, Nevada, June23-26, 2003.
ICEIS 2005 - INFORMATION SYSTEMS ANALYSIS AND SPECIFICATION
166
