
Automatic Recognition of Pollutants in
Packaged Foods from x-ray Imaging
Giorgio Grasso, Rosa Maria Gembillo, Maria Schepis
Facoltà di Scienze,
Università degli Studi di Messina,
Salita Sperone, Messina, Italy
Abstract. Th
e quality and purity of industrially packaged foods is today of
fundamental importance, given the level of expectation of consumers and the
current laws imposing serious liabilities on producers. This paper presents a
novel method for automatic recognition of pollutants in packaged foods for
industrial applications. To maximize the contrast between foods and pollutants
a dual acquisition method has been applied to obtain a pair of images taken at
two different x-ray source voltages. Taking advantage from the wavelength
dependence of absorption coefficient for different materials. In order to further
increase the classification potential of the algorithms, the HΣ color spectrum
was adopted, for its high discrimination capabilities. The analysis of images is
performed on-line utilizing three independent methods. Over a series of
experiments each of the three strategies have given a correct classification rate
of pollutants ranging from 83% to 95%. To further increase the degree of
reliability of the automatic recognition process, the three methods have been
combined into a pollution coefficient. The confidence achieved on the
experimental set resulted in a 92% correct classifications, for pollutants larger
than 2mm.
1 Introduction
In today’s food industry the level of attention towards quality assurance is ever
increasing, mainly due to two factors: expectations of consumers; laws imposing large
liabilities to producers. Packaged foods are processed in a highly complex
environments, characterized by several stages through which products are funneled at
very high speeds. It is not unusual that during the initial stages of processing or in the
packaging phase itself, unwanted inclusions end up embedded inside the packages
(metal parts, screws, stones, glass fragments, wood, plastics, etc). Sending out to the
market polluted products has a high cost in terms of company image and can have
serious financial implications. For these reasons various methods have been
developed and applied for automatic selection of polluted foods, ranging from metal-
detector based systems to visible and multi-spectral imaging solutions. The x-ray
based strategies are widely applied due to their potential for metallic and non metallic
inclusion detection [1], but they suffer from a low contrast between pollutants and the
product itself [2, 3]. In general the detection of inclusions on x-ray images involves
Grasso G., Maria Gembillo R. and Schepis M. (2005).
Automatic Recognition of Pollutants in Packaged Foods from x-ray Imaging.
In Proceedings of the 5th International Workshop on Pattern Recognition in Information Systems, pages 63-72
DOI: 10.5220/0002542100630072
Copyright
c
SciTePress

sophisticated grey-level edge detection methods and results in low reliability. On the
other hand x-ray is potentially the most effective tool, due to its ability to penetrate
the matter. The method proposed here uses pair of images taken at different x-ray
wavelength [4]; this allows to take advantage of different relative absorption
dependencies of materials on wavelength, thus it increases substantially the pollutant-
product contrast. Obviously the better discrimination potential of dual acquisition
images is not by itself sufficient to obtain good recognition rates, a proper image
processing is required.
The two images should be overlapped and compared pixel by pixel to discriminate
the location of materials having different absorption coefficients and thus different
transmission rates in the x-ray data.
When multiple images of the same product are taken into account for pollutant
detection, the first processing step to be taken is their alignment – i.e. corresponding
pixel locations in different images have to represent the same physical location within
the product. The solution to alignment proposed in this paper, is a rigid roto-
translation based on the principal momentum method [5,6,7].
To choose the best pair of x-ray voltages (wavelengths) a series of experiments has
been carried out on different products with different pollutants. The resulting data has
been used to calculate the absorption coefficient ratios. The two voltages giving the
best results for all experimental data have been chosen for the general setup.
From the combination of the two image acquisitions of the same product, as the red
and blue components, a color image is constructed. Color spectra are then derived
using the HΣ method [8,9], which has a high discrimination potential for low dynamic
range images.
In order to extract the pollutant regions from the pair of images three conceptually
independent methods have been developed, implemented and tested, to ensure the
highest classification reliability:
− Neural Network Segmentation
− K-Means Clustering
− Seeded Region Growing
All the three methods, implemented with original C software developed in Linux
environment, performed well in recognizing pollutant regions, with varying rates of
success, ranging from 83% to 95%. The individual results of the above strategies have
been combined into a single image, representing for each pixel the degree of
belonging to the pollutant class. The image values are constructed through a
combination of the three maps deriving from the three above mentioned methods. A
threshold is finally applied to the combined image, which gives the final classification
of polluted products.
2 Two Voltage x-ray Imaging
The absorption of x-rays in matter is highly dependent on the wavelength of the
radiation. This dependence is non-linear and characteristic of different materials – on
the other hand the radiation spectrum of an x-ray tube, even though continuous, is
peaked on a specific value, which is determined by the voltage applied to the tube.
The relative variation in x-ray absorption at two different voltages is in general
64
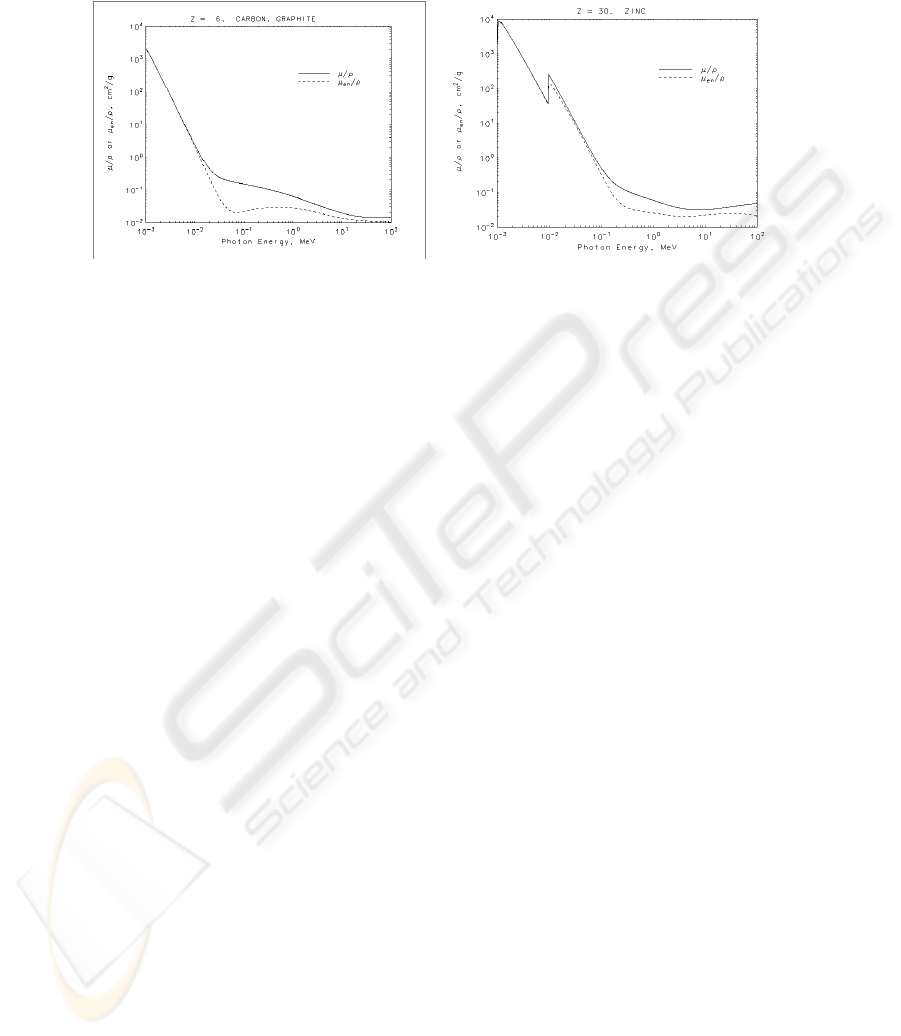
dependent on the material being crossed. This feature of x-ray transmission can be
exploited to maximize the discrimination between foods and pollutants.
(a) (b)
Fig. 1. X-ray typical absorption spectra for two different materials: carbon (a) and zinc (b)
In order to combine images taken at two x-ray tube voltage settings, the objects
contained in the two frames have to be aligned. Actually the images of products are
taken at two different points in time and in general in two different positions, due to
the fact that products proceed into the x-ray inspection chamber through a fast moving
conveyor belt. The alignment procedure is performed through a rigid roto-translation,
based on the principal momentum method. Firstly a threshold of each image is
applied to discard acquisition noise surrounding the product. Secondly coordinates of
the image center of mass (c.o.m.) are computed, through a sum of pixel coordinates
weighted by their intensity. Subsequently the second momentum matrix is computed,
diagonalized and the principal axes of symmetry extracted. Finally the second image
of the acquired pair is aligned and overlapped to the first, on the basis of the
respective principal axes and centers of mass. The roto-translation is applied
according to the following formula:
12
1
12cob b
TTRRT
−
=
o
where T
c
is the composed spatial transformation; T
ob1
is the translation from the
origin to the first image c.o.m.; T
b2o
is the translation from the second image c.o.m. to
the origin; R
1
and R
2
are the rotations of respectively the first and the second image to
align their principal axes to their reference axes.
Alignment worked very well in all cases in which products do not change their
shape between the two acquisitions, giving an alignment accuracy (pixelwise) ranging
from 89% to 98%, with an average of 95%, the success rate of recognition is much
higher on the complete images (see later). In some cases, in which liquid contents
packaged inside flexible membrane were tested, when a considerable change in shape
occurred between the two acquisitions the process resulted in bad alignment. To
overcome this limitation the two acquisitions for soft products have to be performed
one right after the other on the same conveyor belt without any handling in-between.
65
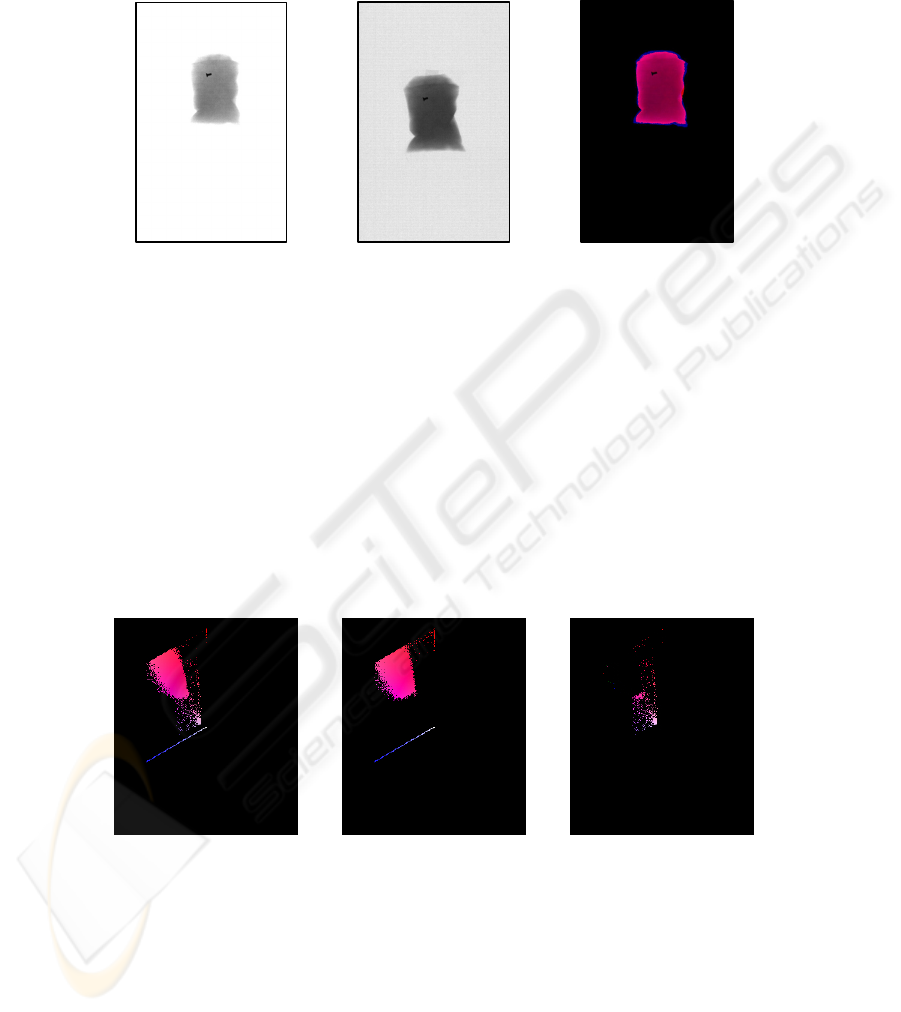
An example of the resulting aligned superimposed pair of x-ray images is shown in
Fig. 2, where false colors are used to represent the two independent components of
the data (red for high voltage; blue for low voltage).
(a) (b) (c)
Fig. 2. Alignment example: (a) high voltage image; (b) low voltage image; (c) overlay
alignment result.
Though an acquisition setup could be put into place for simultaneous acquisition
of the two voltage images, this arrangement is in general not available in normal
industrial inspection machines. The alignment procedure is thus extremely important
for the most wide applicability of the method proposed in existing industrial
environments, making use of two independent standard inspection machines.
The false color representation allows to perform a color segmentation, instead of
the simple grey level thresholding and edge detection, used on single image x-ray
methods. This means that due to the variation of the x-ray absorption with voltage,
dependent on the material, pollutants appear in the composed image with a different
hue compared to rest of the product. The resulting images are suitable for a robust and
most effective discrimination of unwanted pollutants.
(a) (b) (c)
Fig. 3. Typical HΣ spectrum for product with pollutants (a), product without pollutants (b),
difference between (a) and (b), representing the pollutant spectrum (c).
The color spectrum of a typical composed image (Fig. 3) shows a distribution of
pixels which does not lay on a line. Actually when the information contained in two
different color channels are linearly correlated the resulting spectrum is a line in two
66
dimensions. On the contrary experiments show that in the HΣ color spectrum pixels
spread over a rather wide area across the magenta direction, indicating that the two
images, acquired at two different voltages, contains uncorrelated information. In fact
size of the area covered by the spectrum cannot be accounted for by the presence of
random acquisition noise, given the high quality of the component images.
In Fig. 3 a spectrum for a typical acquisition is depicted, showing the complete
pixel distribution of a product with (a) and without (b) pollutants; Fig. 3 (c) shows the
spectrum difference - i.e. the HΣ spectrum corresponding to the pollutant. It is clear
from the figure that the two clusters of pixels (product and pollutant) are well
separated.
3 Image Classification Methods
To automatically recognize the pollutant regions within the combined two voltage
pair of images three independent methods have been employed. A brief description of
each of them is given in the following subsections.
3.1 Neural Network Segmentation
A classical implementation of a multilayer perceptron [10,11,12] was adopted to
classify pollutant pixels within the dual acquisition composed images. False colors
were used to construct an image spectrum according to the HΣ representation.
Portions of acquired images where used to construct the training and test sets. A
subset of these images where obtained including pollutant pixels only, whereas the
rest of the set contained product sub-images only.
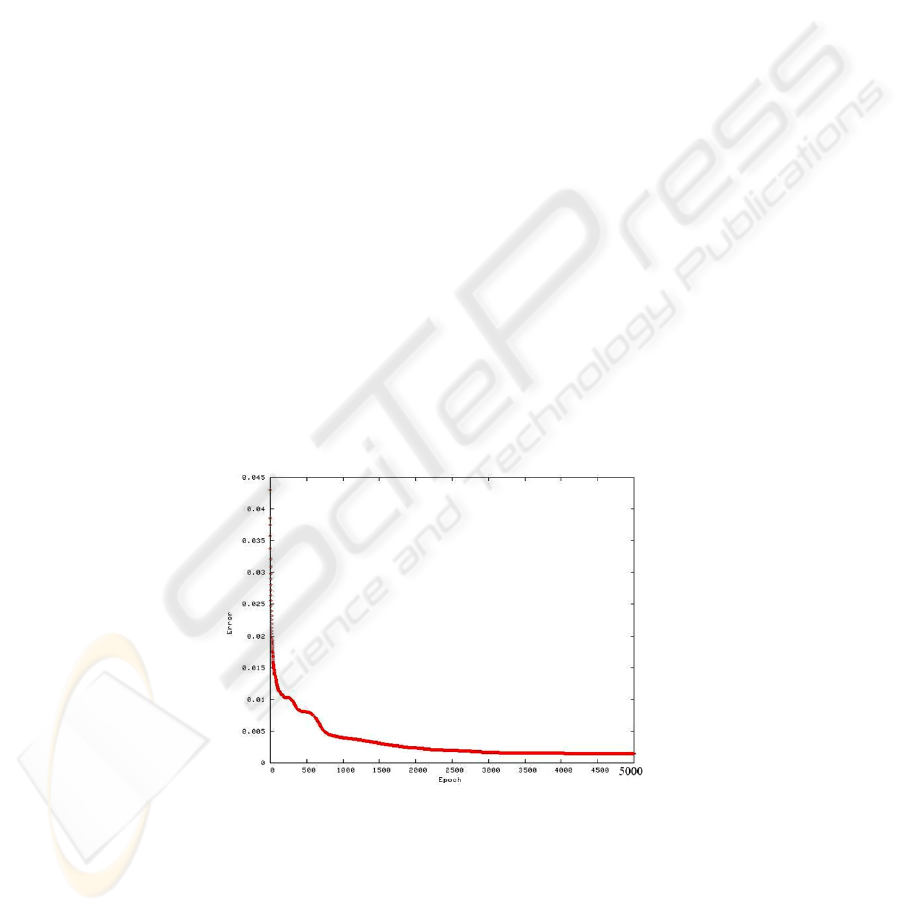
Fig. 4. Error against epochs for a typical NN training session.
The architecture of the NN has 5 neurons in the hidden layer; this figure for the
hidden neurons number was derived from experimental tests. The training process
was performed on 5000 epochs, on a training set of 17 (10 containing product only, 7
67
containing pollutant only) image portions, for a total of 26135 training pixels. In all
cases taken into account the NN converged within 1000 epochs, giving a
classification error lower than 0.04%.
Fig. 4 shows the classification error against epochs for a typical training session of
the NN.
3.2 K-means Clustering
A second method for classification of pollutant pixels within composed dual voltage
color images is based on the k-means algorithm [13]. This unsupervised clustering
strategy was applied to the bi-dimensional HΣ spectrum of sample images. No a-
priori knowledge of the color spectral characteristics of pollutants was given to the
algorithm. An initial set of 10 clusters are initialized in random positions within the
HΣ spectrum. After 30 iteration cycles the algorithm converges fixating the cluster
positions, then a pruning strategy is applied. To remove overlapped and dead clusters
positions and radii of individual clusters are compared. Dead clusters are identified as
the ones which are chosen by the algorithm less than 2% of the times; whereas
overlapped clusters are removed when the distance between them is lower than sum
of their radii, where the highest score cluster is kept.
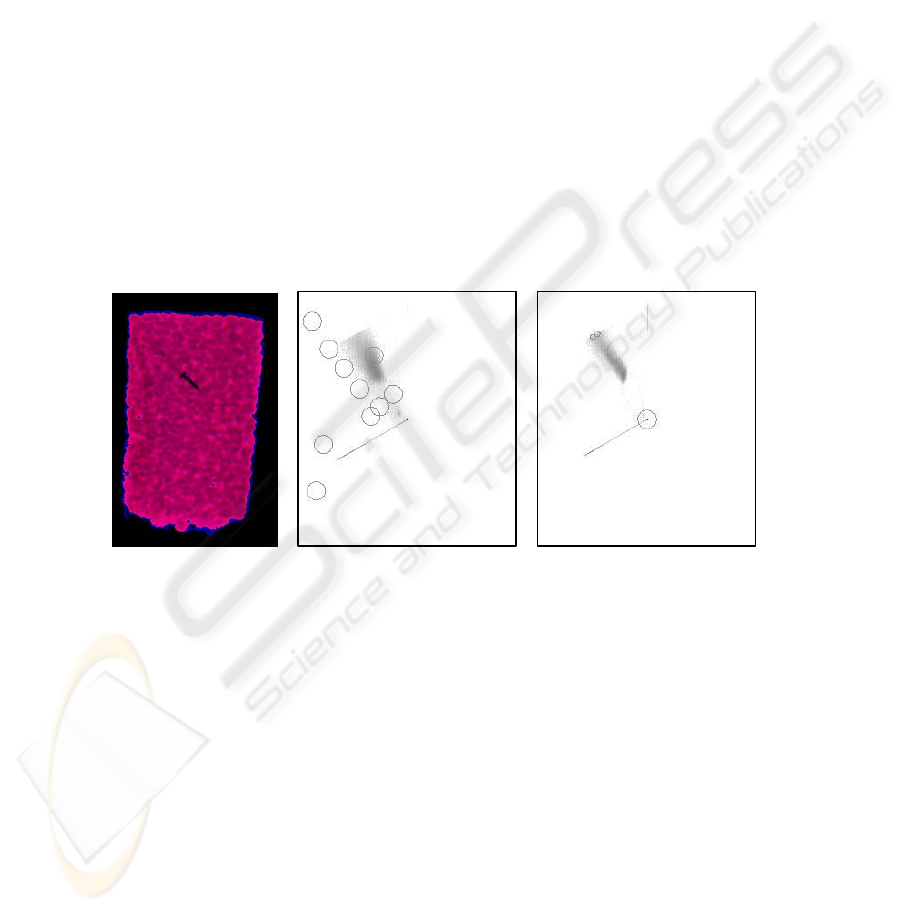
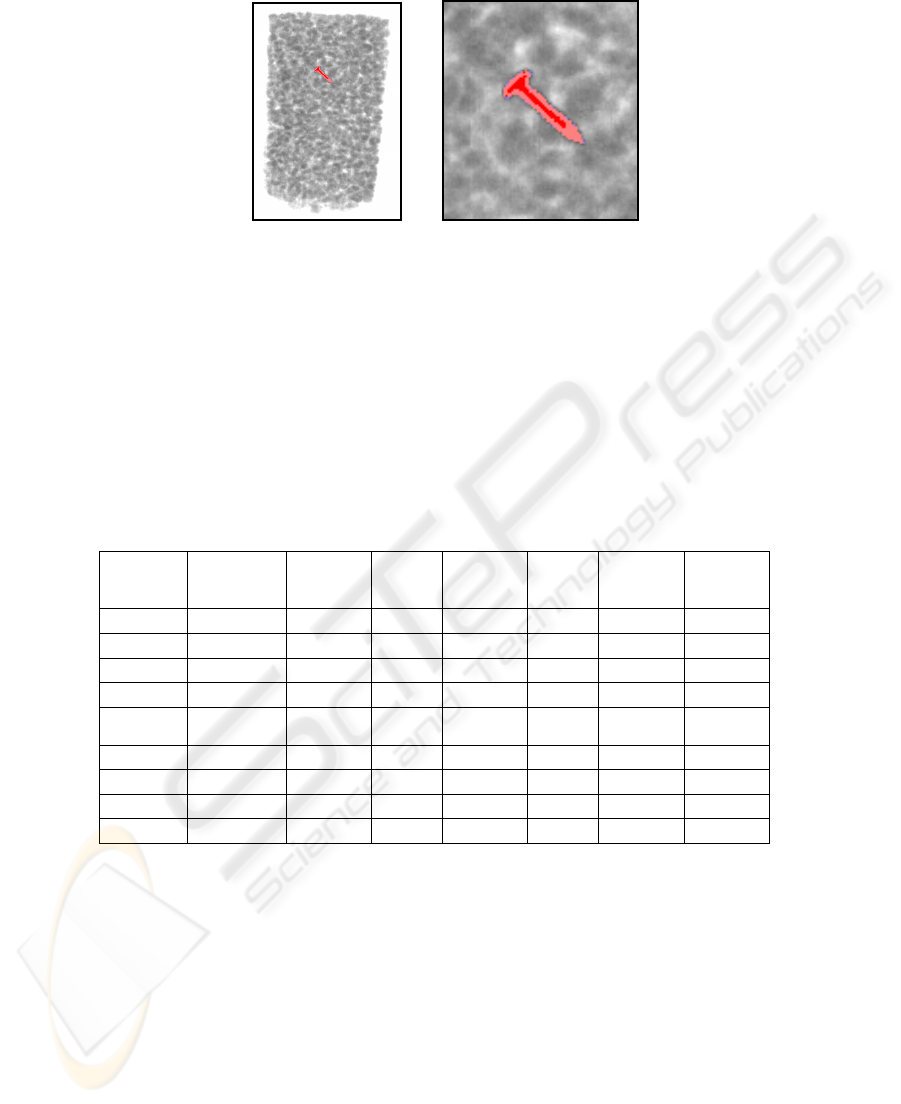
(a) (b) (c)
Fig. 5. Sample run of the k-means algorithm on peanut with metal pollutant (small screw) (a),
initial stage of clusters (b) and final cluster positions (c).
Fig. 5 shows the classification result for a package of peanuts containing a small
screw (a), the initial positions of the clusters (b) and the final resulting positions of the
survived clusters after 30 iteration cycles (c).
3.3 Seeded Region Growing
The third method used for classification of pollutants is a variant of the Seeded
Region Growing (SRG) algorithm [14]. As it is well known SRG allows to perform a
complete segmentation of images, given that proper seeds are provided for all
separated regions. In our case the input of the algorithm is a certain number of seeds
68

located inside pollutant regions, ranging from 0 to 6. These seeds are chosen from the
classification results of the two previously illustrated methods. To avoid the choice of
a seed wrongly classified by the other methods the following selection criterion is
adopted: only pixels centered inside a pixel 4-neighborhood classified as pollutant are
considered.
The stopping strategy for the SRG is a combination of three conditions: the
absolute value of the intensity difference with the seed is above a given threshold –
i.e. the pixel considered is not homogeneous with the seed; the modulus of the
gradient is above a certain threshold – i.e. the pixel considered is a border pixel
between two adjacent regions; the Euclidian distance from the seed, in the original
composed image is above a certain threshold – the pixel considered is too far away
from the seed.
4 Multi-method Integration
The results of the classification methods, described in the previous sections, are
combined into a single image. Each pixel value is computed according to the
following formula:
P
r
= (P
1
+ P
2
+ P
3
)
n
where, for a given pixel, P
r
is the value of the combination, P
1
, P
2
and P
3
are the
corresponding pixel values of the three components, deriving from the classification
methods. The values of P
1
, P
2
and P
3
are binary, therefore the result of the
combination has value 1, 2
n
and 3
n
when only one method, two methods or three
methods, respectively, classify the pixel as pollutant. Typical values for n were
chosen in the range between 3 and 4.
The final decision on whether to reject a polluted product is performed on the basis
of the pollution coefficient, which is the sum of all pixel values P
r
, contained in the
final multi-method resulting image. The pollution coefficient for each analyzed
packaged product is compared against a fixed threshold value, derived from
experimental results. Packages with a pollution coefficient above the threshold value
are rejected.
Fig. 6 (a) shows an example of image resulting from the integration of the three
classifications methods. In the detail of the pollutant, Fig 6 (b), it is visible that three
colors are used to indicate different classification conditions: red means three methods
agree in classifying a pixel as pollutant, pink two methods agree in the classification,
blue only one method has detected a pollutant pixel.
69
(a) (b)
Fig. 6. A typical color image resulting from the integration of the three classification methods
(a) and a blowout of the pollutant (b). Red indicates that three methods, pink two methods and
blue only one method, classified the pixel as pollutant.
5 Results and conclusions
This section reports the results obtained on the experimental data, collected on an
industrial x-ray inspection machine, for 9 packages and 4 different types of
inclusions.
Table 1. Results for classification of different packaged product, with and without pollutants
Product
description
Pollutant Pollutant
pixels
(NN)
Pollutant
pixels
(k-means)
Pollutant
pixels
(SRG)
Pixels
correctly
classified
Pollution
coefficient
Package
correctly
classified
Penut Screw 413 395 118 96 % 7713 Y
Rice Stone 282 232 180 88 % 6047 Y
Olive Screw 236 221 64 94 % 4290 Y
Olive Glass 181 14 211 84 % 2564 Y
Coffee Metal,Glass,
Wood
86 76 25 88 % 1525 Y
Penut none 0 0 0 100 % 0 Y
Rice none 197 40 237 76 % 1155 Y
Olive none 0 0 0 100 % 0 Y
Coffee none 0 0 0 100 % 0 Y
Table 1 reports the results for the application of the classification method presented
in this paper. It is noticeable as the single algorithms show varying rates of success in
discriminating the individual pollutant pixels. The composition of all methods shows
a complete recognition capability, on the set of data investigated. The pollution
coefficient, introduced above, revealed effective as a single parameter to apply
rejection decisions. The threshold for this parameter, obtained from experiments, sets
to the value of 1300.
70
(1)
(2)
(3)
(4)
(5)
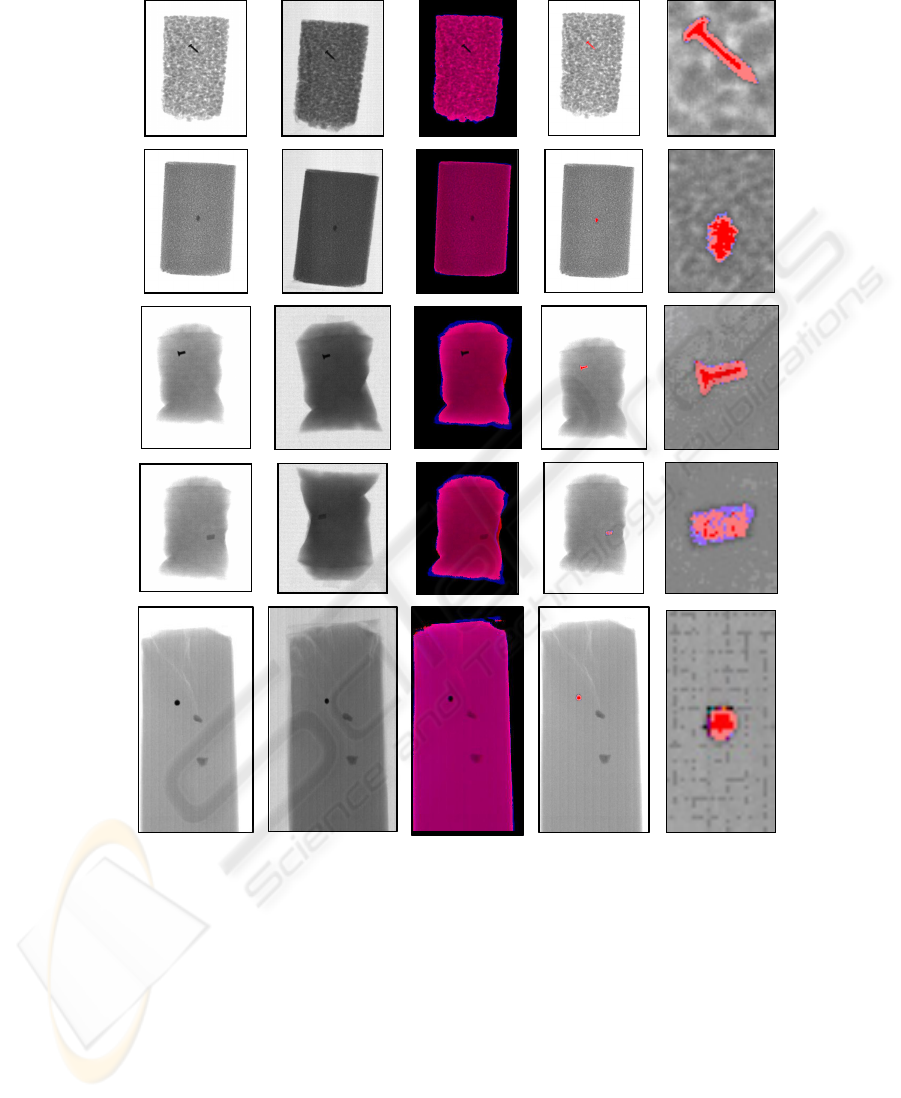
(a) (b) (c) (d) (e)
Fig. 7. Examples on different product and pollutants (see text).
In Fig. 7 a series of result examples are reported; rows refer to different
product/pollutant samples: in row (1) a peanut package containing a small screw; in
(2) a rice package with a stone inclusion; row (3) and (4) an olive package containing
a small screw and a glass fragment respectively; row (5) a coffee package with metal,
glass and wood inclusions. Columns represent: the original high voltage and low
voltage images, (a) and (b) respectively; the aligned image (c); the full classified
composed image (d); the detail blowout of the pollutant (d). False colors indicate with
71

red, single pixels recognized as pollutant by all three methods, with pink, single pixels
classified as pollutant by two methods and with blue, single pixels recognized as
pollutant by only one method.
The developed method for automatic classification of pollutants in packaged foods
has shown an overall good performance on the test samples. Its robustness to different
types of pollutants and products makes the algorithm promising for general industrial
application, especially in existing production lines with standard x-ray inspection
hardware. In addition the computational performance on standard PC hardware seem
compatible for in-line use, given that a DSP version is implemented.
References
1. Casasent, D., Sipe; M.A., Schatzky, T.F., Keagy, P.M., Lee, L.L.: Neural Net Classification
of X-Ray Pistachio Nut Data, Lebensm.-Wiss. u.-Technol. 31 (1998) 122-128
2. Casasent, D. Talukder, A., Lee, H.W.: X-Ray Agricultural Product Inspection:
Segmentation and Classification, In: Proc. SPIE 3205 (1997) 46-55
3. Keagy, P.M., Schatzky, T.: Machine Recognition of Weevil Damage in Wheat Radiograph,
Cereal Chemistry 70 (1993) 696-700
4. Subbiah, J., Kranzler, G., Kotwaliwale, N., Weckler, P.: Predicting Beef Tenderness using
Dual Energy X-ray Absorption, Biosystems & Agricultural Engineering Oklahoma State
University, Internal Report (2002)
5. Bini, D., Capovani, M., Menchi, O.: Metodi numerici per l'algebra lineare, Zanichelli,
Bologna (1993)
6. Abeasis, S.: Algebra lineare e geometria, Zanichelli, Bologna, (1994)
7. Gonzalez, R.C., Woods, R.E.: Digital image processing Second Edition, Prentice Hall, New
York (2001)
8. Grasso, G., Recce, M.: Scene analysis for an orange picking robot. In: Proc. 6th Inter.
Congress for Computer Technology in Agriculture (ICCTA'96) eds. C. Lokhorst, A.J.
Udink ten Cate, and A.A. Dijkhuizen, VIAS, The Netherlands (1996) 275-280
9. Plebe, A., Grasso, G.: Localization of spherical fruits for robotic harvesting. Machine
Vision and Applications, 13(2) (2001) 70-79
10. Rosemblatt F.: The Perceptron: A probabilistic model for information storage and
organization in the brain. Psychological Review 56 (1958) 386-408
11. Rumelhart D. E., Hinton G. E., Williams R.J.: Learinig representations by back-
propagating errors, Nature 323 (1986) 533-536
12. Bose, N.K., Liang, P.: Neural Networks Fundamentals with Graphs, Algorithms, and
Applications, McGraw-Hill, International Editions, Singapore (1996)
13. MacQueen, J.: Some method for classification and analysis of multi-variate observation. In:
Proc. Of the Fifth Berkeley Symp on Math., Statistic and Probability, LeCam, L. M. and
Neyman, J, (eds.), Berkeley: U. California Press, 281 (1967)
14. Adams, R., Bischof, L.: Seeded region growing. IEEE Trans. On PAMI, 16(6) (1994) 641-
647
72
