
MULTIDIMENSIONAL SELECTION MODEL FOR
CLASSIFICATION
Dymitr Ruta
British Telecom, Research & Venturing
Adastral Park, Orion Building, 1
st
floor - pp12
Martlesham Heath, Ipswich IP53RE, UK
Keywords:
Classification, feature selection, classifier fusion, genetic algorithm.
Abstract:
Recent research efforts dedicated to classifier fusion have made it clear that combining performance strongly
depends on careful selection of classifiers. Classifier performance depends, in turn, on careful selection of
features, which on top of that could be applied to different subsets of the data. On the other hand, there is
already a number of classifier fusion techniques available and the choice of the most suitable method relates
back to the selection in the classifier, feature and data spaces. Despite this apparent selection multidimen-
sionality, typical classification systems either ignore the selection altogether or perform selection along only
single dimension, usually choosing the optimal subset of classifiers. The presented multidimensional selection
sketches the general framework for the optimised selection carried out simultaneously on many dimensions
of the classification model. The selection process is controlled by the specifically designed genetic algorithm,
guided directly by the final recognition rate of the composite classifier. The prototype of the 3-dimensional
fusion-classifier-feature selection model is developed and tested on some typical benchmark datasets.
1 INTRODUCTION
There is a large evidence of various selection mod-
els applied to classification (Roli and Giacinto, 2002),
(Ruta and Gabrys, 2005). Even within a single classi-
fication model it was observed that selection of cer-
tain subset of features, rather than taking them all,
could improve the performance of a classifier (Zenobi
and Cunningham, 2001). It is also well known that
not all the data are suitable for training of the clas-
sification model. Quite often data need some sort of
cleaning, for example to discard outliers believed to
be a faulty data (H. Ishibuchi and Nii, 2001). When
the multiple classifier systems (MCS) emerged as
a new source of further improvement of classifica-
tion performance, almost immediately emerged the
classifier selection methods which proved that some
combinations of classifiers perform better than oth-
ers (Kuncheva, 2004). At present, given quite a few
well-performing classifier fusion methods to choose
from, the issue of the combiner selection reemerges
this time on the classifier fusion abstraction level. Ef-
fectively, what is being observed on this course is that
emerging new dimensions of classification systems
are always paired with the relevant selection method-
ology. The issue of selection in the context of classi-
fication has clearly multidimensional nature. What is
surprising however, is that when more and more com-
plex classification systems are developed, they seem
to be blind to the opportunities of multidimensional
selection. Such systems typically ignore the strength
of selection methodology and achieve a moderate per-
formance improvement by combining as many rele-
vant components as is allowed by the computational
power capabilities. The other group of composite
classification systems acknowledges the usefulness of
selection. However the selection is usually applied to
at most single dimension of the classification process
(Giacinto and Roli, 1999). To the best knowledge of
the author there were only few attempts to select si-
multaneously the best subsets of features and classi-
fiers, as in (Kuncheva and Jain, 2000) or (Kuncheva
and Whitaker, 2001). In other examples it was shown
that data instances and features can be jointly selected
by means of genetic algorithm (H. Ishibuchi and Nii,
2001) or nearest neighbour rule (Kuncheva and Jain,
1999). On the other hand as shown in (Ruta and
Gabrys, 2005) some combiners like majority voting
can be used to further combine its outputs or in other
words further combine the combiners.
The presented multidimensional selection system
(MSS) attempts to perform selection on many dif-
226
Ruta D. (2005).
MULTIDIMENSIONAL SELECTION MODEL FOR CLASSIFICATION.
In Proceedings of the Seventh International Conference on Enterprise Information Systems, pages 226-232
DOI: 10.5220/0002547902260232
Copyright
c
SciTePress

ferent dimensions at the same time. Moreover as it
uses adjusted genetic algorithm guided directly by the
combiner performance, selection in all dimensions
is coordinated and optimised to jointly produce best
overall performance of the composite classification
system. The prototype of the 3-dimensional selection
system is developed and tested on the two benchmark
datasets in the comparative experiments. The remain-
der of this paper is organised as follows. Section 2
discusses dimensions of selection in the classification
process covering in detail selection in data, classifiers
and fusion systems. The following section introduces
the multidimensional selection model and discusses
its representation and selection algorithm. Extensive
experimental results are shown in Section 4. Finally
conclusions and recommendations for future work are
briefly drawn in Section 5.
2 DIMENSIONS OF SELECTION
2.1 Data
Until recently there was a common belief that all the
available data should be used to build a classification
model. This belief although theoretically genuine was
being gradually relaxed by extensive experimental
findings related to the feature selection (H. Ishibuchi
and Nii, 2001), (Kuncheva and Jain, 1999). It was
uncovered that realistic learning systems can not fully
distinguish between good or representative data and
bad data due to their lack the mechanisms of accumu-
lative and non-conflicting exploitation of all the data.
On practical grounds it turned out that to avoid per-
formances losses, the simplest thing to do is to filter
out bad data and use only good data to build a classifi-
cation model. Finding the most suitable training data
breaks down into a variety of ways these data can be
selected. Direct selection of the optimal data points is
usually referred to as data editing (Kuncheva and Jain,
1999) where the aim could be either to attain the com-
pact data sample that retains maximum representa-
tiveness of the original data structure, or simply to fit
the best input to the learning mechanism. The selec-
tion restrictions can be specified in many other ways
beyond just direct selection of samples. As the data is
mapped onto the input space, the selection rules can
be attributed to the space rather than to the data form-
ing it. The input space can be simply segmented into
many differently shaped subspaces. The shapes of
subspaces may be formed in various generic forms, or
can be dictated by the classification methodology. In
dynamic classifier selection methodology (Giacinto
and Roli, 1999), the shape of the subspace is dictated
by the k-nearest neighbour rule, while in Error Cor-
recting Codes (ECOC) method (Dietterich and Bakiri,
1995) the shape of the subspace is fully determined by
the structure of classes in the data. In the most com-
mon scenario, the input space is divided along paral-
lel or perpendicular space boundaries, which means
that selection applies to features and some particular
ranges of their variability, respectively. Labelled char-
acter of the data for classification adds an additional
dimension for potential selection.
All the features have typically open domains allow-
ing for unlimited variability of (−∞, +∞). How-
ever there could be many reasons for limiting these
domains by selecting the narrow range of valid fea-
ture variability. One of such reasons could be filtering
out the outliers - samples laying far from the areas
with high data concentrations. To accommodate out-
liers, the classification model has to stretch model pa-
rameters such that a single distant data point has much
grater influence on the model than many points within
dense regions of the input space. The domain can be
limited by a single or multiple ranges or valid vari-
ability for each feature. In the special case the domain
range can be reduced to none which is equivalent to
the exclusion of such feature.
As mentioned above feature selection is a special
case of domain selection but due to its simplicity de-
serves separate treatment. Feature selection has two
attractive aspects to consider. First of all selecting
some instead of all features significantly reduces com-
putational costs of classification algorithms which are
typically at least quadratically complex with respect
to the number of features. Secondly, in practice many
features are noncontributory to the classifier perfor-
mance and sometimes due to imperfect learning al-
gorithms can even cause deterioration. Features can
be selected along with their variability range limits.
Such scenario is equivalent to selection of particular
clusters or subspaces in the input data, such as selec-
tion of classes of data.
The emergence of classes of data adds another de-
gree of freedom in selection process related to data.
However rather than another dimension of selection
it appears to be a form of restriction on how the do-
mains in each features should be restricted. Selection
of classes of data is used in Error Correcting Output
Coding (ECOC) where the N-class problem is con-
verted into a large number of 2-class problems. Selec-
tion with respect to classes is particularly attractive if
there are expert classifiers which specialise in recog-
nising particular class or classes but are very week
in recognising other classes, in which case it makes
sense to decompose the problem rather than aggregate
performance over all classes.
2.2 Classifiers
Classifier selection is probably the most intuitive form
of selection with respect to classifier fusion. There are
MULTIDIMENSIONAL SELECTION MODEL FOR CLASSIFICATION
227

generally two approaches to classifier selection lead-
ing to further combining by a fusion method. Accord-
ing to one approach, combiner is first picked arbitrar-
ily and then classifiers are selected in such a way that
the combiner results in maximum performance. Al-
ternatively, it is the combiner that that is adjusted so
as to fuse given classifiers in a best possible way.
2.3 Combiners
The selection process does not have to end on classi-
fiers. Given a set of optimised classifiers it is reason-
able to test a number of available fusion methods and
then to select the best performing one. On the other
hand if classifier selection is applied to each combiner
separately, the best system may turn out to be differ-
ent. Such top-down decomposition could be drilled
further down and it may show that normally inferior
pair of classifier-combiner suddenly shows the best
results if built on a different subset of features. Such
doubts are imminent in any multiple classifier system
unless the selection is carried out simultaneously on
many dimensions of classification process.
3 MULTIDIMENSIONAL MODEL
As mentioned above the weaknesses of previous clas-
sifier selection models stem from only a single dimen-
sion along which the selection was carried out. The
choices related to other dimensions were made arbi-
trarily based on some general optimality measures.
The challenge undertaken in this work is to construct
a multidimensional selection method in which data,
classifiers and fusion methods are selected simulta-
neously and cooperatively to maximise classification
performance of the system. The common doubt of
processes operating along multiple degrees of free-
dom is the exploding computational complexity. To
realise the significance of this problem let us consider
a system with f features, c classifiers and b combin-
ers. Let further assumption be that the combiners are
selected as singletons only as we can not combine fur-
ther fusion methods at this stage. In such case number
of different systems to examine is:
N = (2
f
− 1) · (2
c
− 1) · b ∼ b2
f+c
(1)
Such high complexity means that for a system with
10 features, 10 classifiers and 10 combiners one needs
more than 10
7
evaluations to pick the best design.
3.1 Representation
Ia a response to such huge computational demands
the presented system employs efficient adjustment of
a genetic algorithm (Holland, 1975). To handle this
algorithm along many dimensions the chromosomes
are designed as incidence cubes dimensions of which
correspond to the selection dimensions of features,
classifiers and combiners as shown in Figure 1. The
meaning of ”1” (”0”) in each small cube is that the
corresponding feature is (not) included in the corre-
sponding classifier, and combiner of the system. The
cube matches the hierarchical structure of the dimen-
sions in which combiners are built on many classifiers
which are built on many features. Note that such hi-
erarchical structure means that the classifier can only
be dropped if it does not have any features selected.
Likewise combiner can be excluded only if it corre-
sponds to a whole layer of zeros, corresponding to
the lack of any classifiers selected. Another important
aspect of the incidence cube is that it is not fully op-
erational along the combiners dimension. The reason
for that is the inability to further combine classifier
fusion methods at this stage and hence the chromo-
some is a collection of selection solutions associated
with layers of the incidence cube.
3.2 Selection algorithm
The actual process of multidimensional selection is
consistent with the standard genetic algorithm (Hol-
land, 1975), with some adjustments of mutation and
cross-over operators, which have to accommodate the
cube representation of the chromosome. The genetic
algorithm was developed in 1970s by Holland (Hol-
land, 1975) as an effective evolutionary optimisation
method. Since that time, intensive research has been
dedicated to GAs, bringing lots of applications in ma-
chine learning domain (Davis, 1991), (Cho, 1999),
(Ruta and Gabrys, 2001), (Kuncheva and Jain, 2000)
including classifier selection. Despite many varieties
of GAs, its underlying principles remain unchanged.
Chromosomes represent binary encoded solutions to
the optimisation problem. A randomly initialised
population of chromosomes is then evaluated accord-
ing to the required fitness function and assigned a
probability of survival proportional to their fitness.
The best chromosomes are most likely to survive and
are allowed to reproduce themselves by recombining
their genotype and passing it on to the next genera-
tion. This is followed by a random mutation of some
bits, which was designed to avoid premature conver-
gence and enables the search to access different re-
gions of a search space. The whole process is repeated
until the population converges to a satisfactory solu-
tion or after a fixed number of generations. The GA is
inspired by an explicit imitation of biological life, in
which the strongest (fittest) units survive and repro-
duce further constantly adjusting to the variable con-
ditions of living. In our case, cube representation of a
chromosome imposes changes in mutation and cross-
over operations. Mutation is quite straightforward as
ICEIS 2005 - ARTIFICIAL INTELLIGENCE AND DECISION SUPPORT SYSTEMS
228
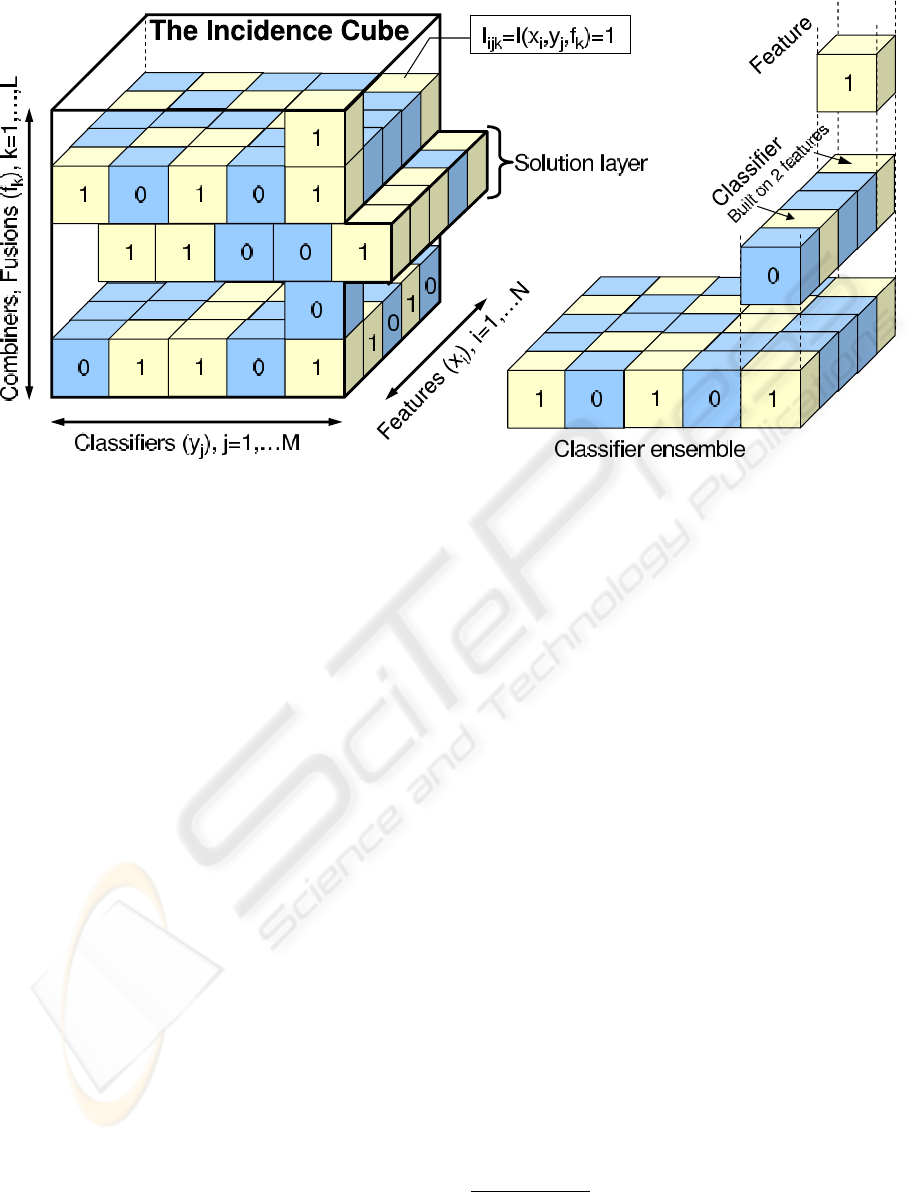
Figure 1: Incidence cube representation of the of the 3-dimensional fusion-classifier-feature selection model. Small cubes
correspond to the triplet combiner-classifier-fusion and take values of 1 (light colour) if the corresponding feature is included
in a classifier, which is then included in the corresponding combiner or 0 (dark colour) if the particular triplet is not selected
it only involves sampling from a mutation probabil-
ity applied to all genes (small cubes). The crossing-
over operation is more complicated as there is many
degrees of freedom by which the chromosomes can
be recombined. Moreover each chromosome actu-
ally describes in itself a number of solutions. The
presented model uses a two-stage cross-over opera-
tion. First the chromosomes recombine internally by
exchanging subsets of classifiers and features among
randomly selected pairs of combiners as shown in
Figure 2. Then the whole chromosomes recombine
among each other by swapping parts split by the ran-
domly oriented plane cutting through the incidence
cube. Due to multiplicity of solutions within single
chromosome the evaluation process is carried out on
the basis of an average from the classification per-
formances from each solution layer of the incidence
cube. The algorithm uses also the elitism operation
but realised through the natural selection process in
which the best from both parents and offsprings are
passed on to the next generation.
1. Collect and fix the selection space with f features
c classifiers and b combiners.
2. Initialise a random population of n chromosomes
(f × c × b binary incidence cubes).
3. Perform mutation and two-stage crossover, .
4. Pool offspring and parents together and calculate
the fitness for all
5. Select n best chromosomes for the next generation.
6. If convergence then finish, else go to step 2.
Note that this particular implementation of GA repre-
sents a hill-climbing algorithm, as it guarantees that
the average performance will not decrease in the sub-
sequent generations. Mutation along with two-stage
crossover ensure sufficient exploration ability of the
algorithm. The convergence condition can be asso-
ciated with the case when no change in the average
fitness is observed for an arbitrarily large number of
generations. Previous comparative experiments with
real classification datasets confirmed the superiority
of the presented version of the GA to its standard de-
finition (Ruta and Gabrys, 2001).
4 EXPERIMENTS
A number of experiments have been carried out to
test the performance of the presented 3-dimensional
classifier selection model. Throughout the experi-
ments a fixed sets of 10 different classifiers and 5
combiners were being applied to 2 known datasets
from UCI repository
1
. Details of datasets, classi-
fiers and combiners are shown in Table 1. To limit
the computational complexity for each dataset the se-
lection algorithm used a population of only 10 inci-
dence cubes. The mutation rate was set to p = 0.1
1
University of California Repository of Machine Learn-
ing Databases and Domain Theories, available free at:
ftp.ics.uci.edu/pub/machine-learning-databases
MULTIDIMENSIONAL SELECTION MODEL FOR CLASSIFICATION
229
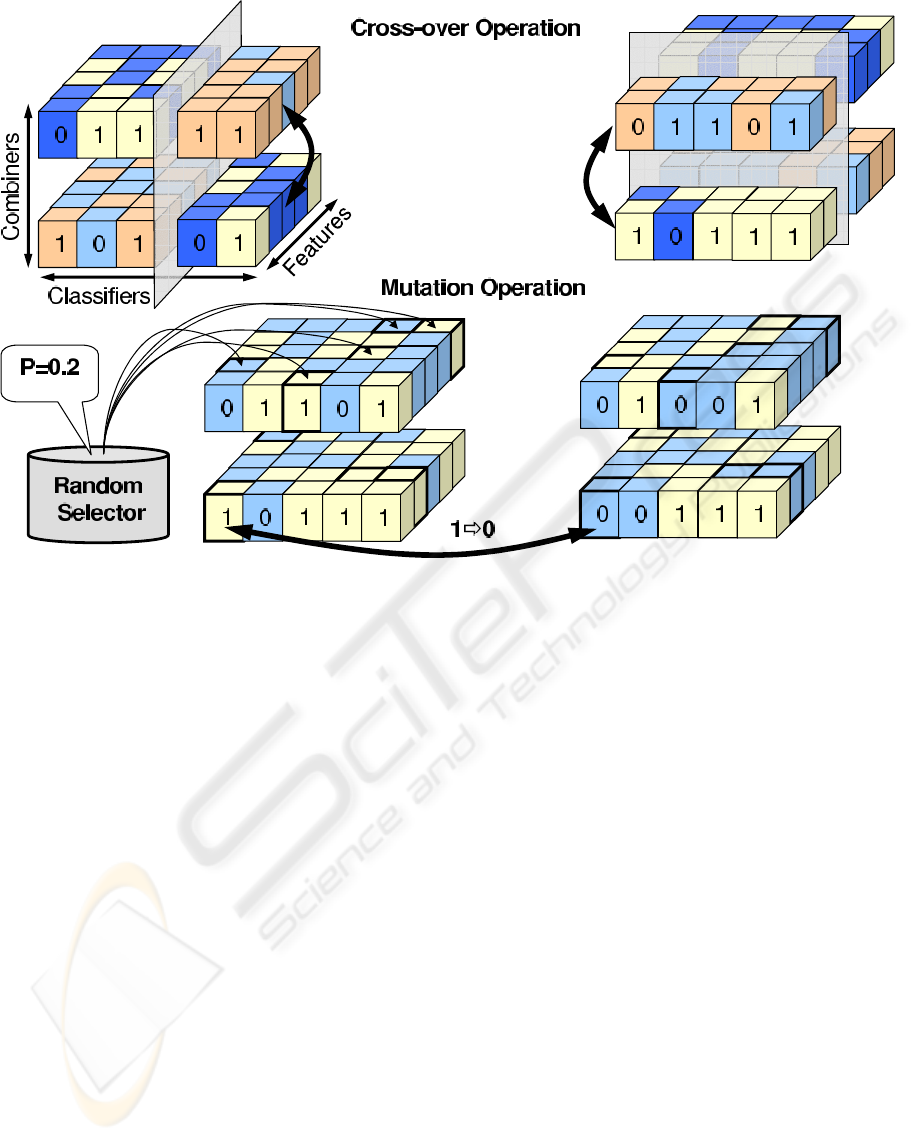
Figure 2: Visualisation of genetic algorithms operations of nutation and cross-over carried out on the incidence cube repre-
sentation of 3-dimensional selection for classification.
while specific selection technique described in pre-
vious section ensured non decreasing convergence
of the GA in the average classification performance.
The chromosomes were built along 3 dimensions cap-
turing features, classifiers and combiners incidence.
They have been evaluated by the average misclassi-
fication rate obtained for all layers (combiners) sep-
arately. To preserve generalisation abilities of the
system, the classifiers and hence the combiners were
built on the separate training sets and tested on parts
of the dataset which have not been used during train-
ing. Then the training and testing sets were swapped
such that an equivalent of 2-fold cross-validation rule
has been used for chromosome evaluation. For sim-
plicity the GA was stopped after 100 generations for
all datasets, despite the fact that for some cases con-
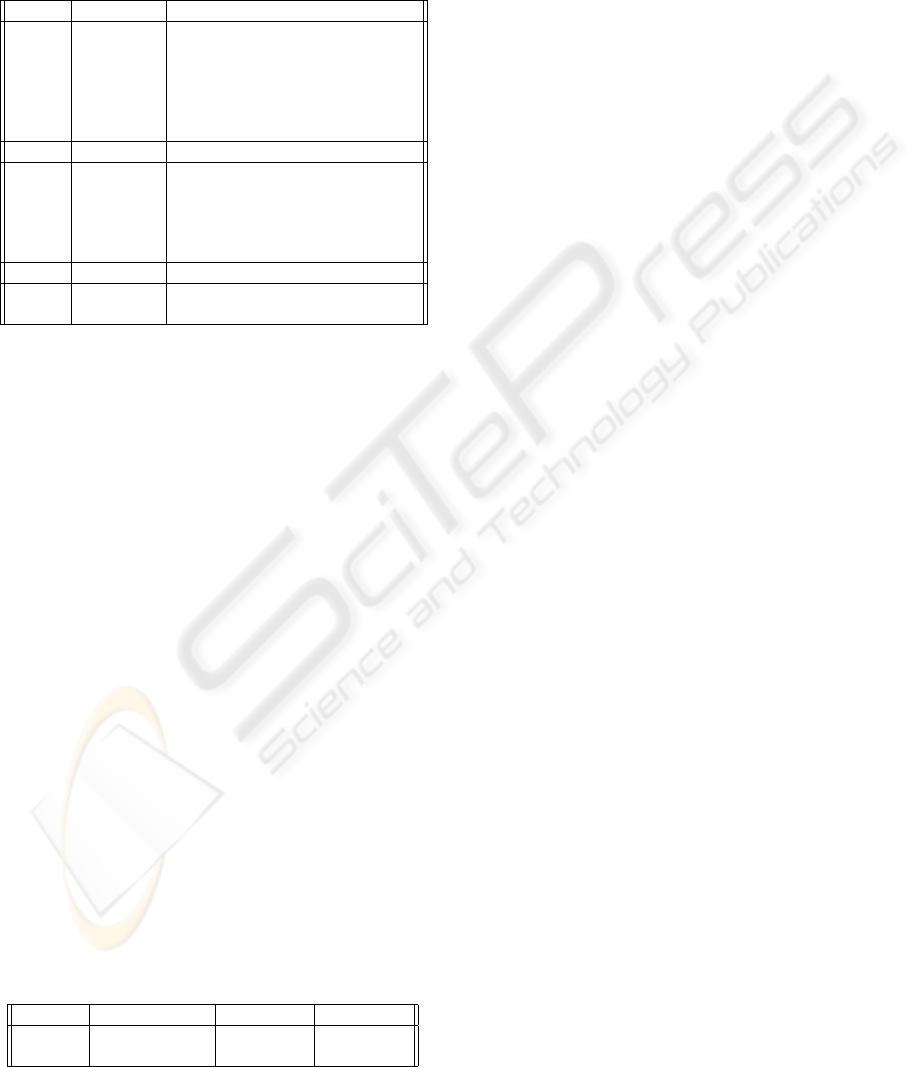
vergence was achieved earlier. Figure 3 illustrates the
dynamics of the testing performance characteristics
during selection process carried out by the GA algo-
rithm. The typical observation is that the algorithm
relatively quickly finds the best performing system
and then in subsequent generations it keeps improv-
ing other solutions in the population. The algorithm
showed the capacity to get out of local minima which
effectively means discovery of significantly better so-
lution spreading swiftly in many variations during
subsequent generations. The following Figure 4 de-
picts the evaluation of a final population of chromo-
somes for both datasets. For Iris dataset the Min com-
biner showed the best average performance including
the absolute best performing system with only 1.33%
misclassification rate. Majority voting showed on av-
erage best performance for Liver dataset, including
the absolute best performing system with 27.8% er-
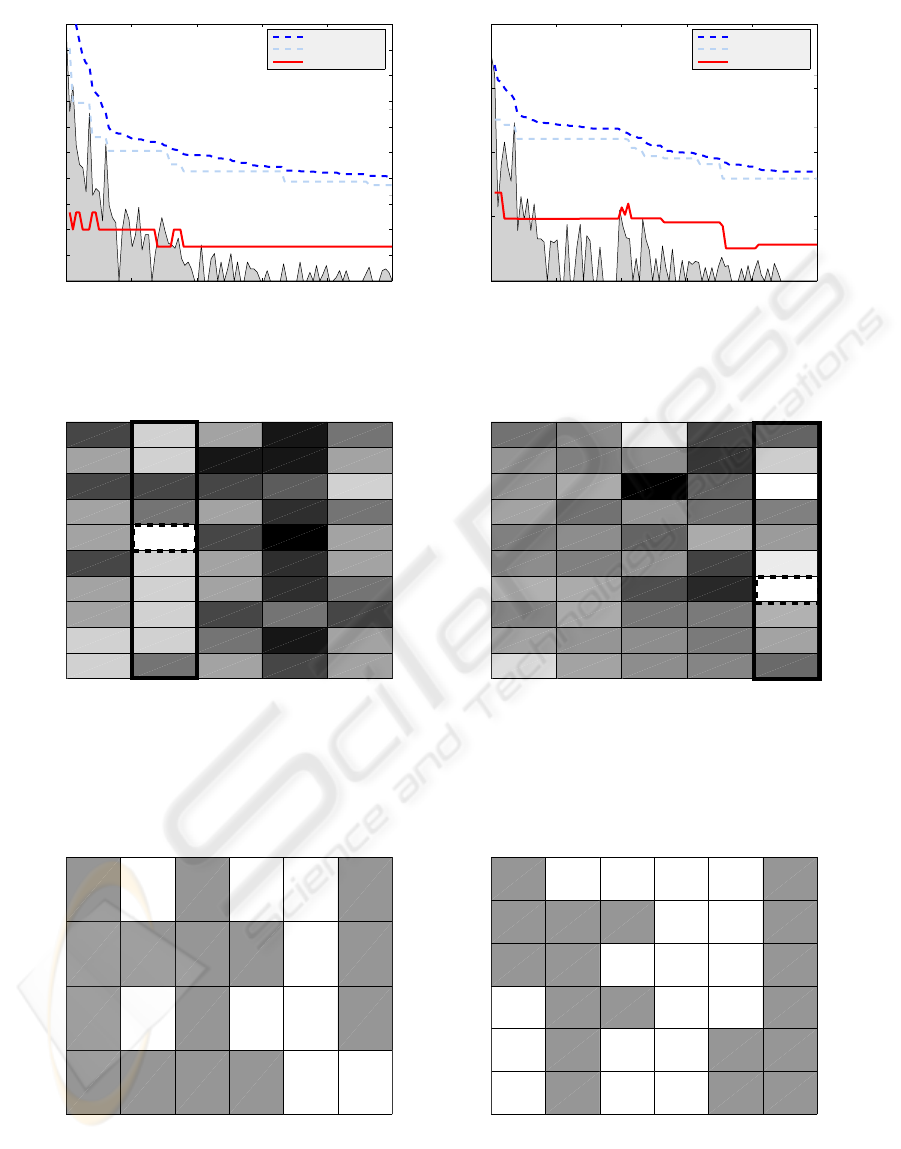
ror rate. The best systems for both datasets were then
further uncovered by illustrating the structure of the
classifiers and features selected as shown in Figure 5.
Interestingly, for each selected classifier the algorithm
selected at least two features. One classifier for both
datasets was excluded. Other than that there is noth-
ing significant about the selection structures shown in
Figure 5. This could only prove that it is very diffi-
cult to find the best performing systems as they do not
exhibit any visible distinctiveness but are simply lost
among large number of system designs embodying
huge selection complexity as shown in (1). Finally the
last experiment intends to compare the performances
of systems designed by means of 3-dimensional se-
lection process (MCSS-3D) with the traditional sys-
tems of single best classifiers (SB) or multiple clas-
sifier system with GA-based classifier selection only
(MCSS-1D). Table 2 shows the error rates of the best
system found in the aforementioned design groups.
The presented MCSS-3D clearly outperformed both
ICEIS 2005 - ARTIFICIAL INTELLIGENCE AND DECISION SUPPORT SYSTEMS
230
SB and MCSS-1D systems. The benefits of the selec-
tion carried out on many dimensions of the classifica-
tion process are hereby confirmed.
Table 1: Description of datasets, classifiers and combiners
used in experiments.
No Classifier Description
1 klclc Linear with KL expansion
2 loglc Logistic linear classifier
3 ldc Linear discriminant classifier
4 qdc Quadratic with normal density
5 pfsvc Pseudo-Fisher SVM classifier
6 lmnc Levenberg-Marquardt neural net
No Combiner Description
1 meanc Mean combiner
2 minc Minimum rule combiner
3 maxc Maximum rule combiner
4 prodc Product rule combiner
5 majorc Majority voting combiner
Name Classes Samples×Features
Iris 3 150 × 4
Liver 2 345 × 6
5 CONCLUSION
This work considers the broad issue od selection ap-
plied to the multiple classifier system in order to im-
prove its performance. It has been noted that vari-
ous selection methods are being used along only sin-
gle dimension - like classifier selection applied for
the ensemble of classifiers or feature selection ap-
plied to the set of features. In the novel multidi-
mensional selection system proposed in this paper the
classification can be potentially handled simultane-
ously and cooperatively along all possible degrees of
freedom including data, features, classes, classifiers
and classifier fusion methods. Due to extremely high
computational complexity of such systems only a 3-
dimensional selection system was implemented and
tested on benchmark datasets. This system applies
adjusted genetic algorithm to select the optimal con-
figuration of features, classifiers and combiners. The
experimental results confirmed anticipated superior-
ity of the MSS model compared to single-best clas-
sifier method and even to multiple classifier system
Table 2: Comparison of the error rates obtained for the best
systems using: SB, MCS-1D, MCS-3D.
Dataset SB (classifier) MCSS-1D MCSS-3D
iris 2.47 (klclc) 2.13 1.33
liver 32.35 (loglc) 29.06 27.78
with the GA-based selection of the optimal subset of
classifiers. The MSS system opens yet another source
for further performance improvement in classification
once discovered for classifier fusion systems. It also
points at the necessity of simultaneous and coopera-
tive optimisation of all components of the classifica-
tion process, which is gradually being made available
by the rapidly increasing computational power.
REFERENCES
Cho, S.-B. (1999). Pattern recognition with neural networks
combined by genetic algorithms. Fuzzy Sets and Sys-
tems, 103:339–347.
Davis, L. (1991). Handbook of Genetic Algorithms. Van
Nostrand Reinhold, New York.
Dietterich, T. and Bakiri, G. (1995). Solving multiclass
learning problems via error-correcting output codes.
Journal of Artificial Intelligence Research, 2:263–
286.
Giacinto, G. and Roli, F. (1999). Methods for dynamic clas-
sifier selection. In Proc. of the 10th Int. Conf. on Im-
age Analysis and Processing, pages 659–664, Venice.
H. Ishibuchi, T. N. and Nii, M. (2001). Instance se-
lection and construction for Data Mining, chapter
Genetic-Algorithm-Based Instance and Feature Selec-
tion, pages 95–112. Kluwer Academic Publishers.
Holland, J. (1975). Adaptation in natural and artificial sys-
tems. The University of Michigan Press, Michigan.
Kuncheva, L. (2004). Combining pattern classifiers. Meth-
ods and algorithms. Wiley-Interscience, New York.
Kuncheva, L. and Jain, L. (1999). Nearest neighbor classi-
fier: Simultaneous editing and feature selection. Pat-
tern Recognition Letters, 20(4):1149–1156.
Kuncheva, L. and Jain, L. (2000). Designing classifier fu-
sion systems by genetic algorithms. IEEE Ttansac-
tions on Evolutionary Computation, 4(4):327–336.
Kuncheva, L. and Whitaker, C. (2001). Feature subsets for
classifier combination: an enumerative experiment. In
Proc. of the 2nd Int. Workshop on Multiple Classifier
Systems, pages 228–237, Cambridge, UK.
Roli, F. and Giacinto, G. (2002). Hybrid Methods in Pattern
Recognition, chapter Design of multiple classifier sys-
tems, pages 199–226. World Scientific Publishing.
Ruta, D. and Gabrys, B. (2001). Application of the evolu-
tionary algorithms for classifier selection in multiple
classifier systems with majority voting. In Proc. of
the 2nd Int. Workshop on Multiple Classifier Systems,
pages 399–408, Cambridge, UK. Springer Verlag.
Ruta, D. and Gabrys, B. (2005). Classifier selection for
majority voting. Information Fusion, 6:63–81.
Zenobi, G. and Cunningham, P. (2001). Using diversity in
preparing ensembles of classifiers based on different
feature subsets to minimise generalisation error. In
Proceedings of the 12th European Conference on Ma-
chine Learning, pages 576–587.
MULTIDIMENSIONAL SELECTION MODEL FOR CLASSIFICATION
231
0
5
10
15
Sum of chromosome changes
0 20 40 60 80 100
0
1
2
3
4
5
6
7
8
9
10
GA Generations
Misclassification rate [%]
GA dynamics for Iris dataset
Population mean
Best chromosom
Best combination
0
5
10
15
20
25
Sum of chromosome changes
0 20 40 60 80 100
25
30
35
40
45
GA Generations
Misclassification rate [%]
GA dynamics for Liver dataset
Population mean
Best chromosom
Best combination
Figure 3: Performance characteristics evolution during GA selection.
Population of chromosomes
meanc minc maxc prodc majorc
Combiner layers
e=1.33%
meanc minc maxc prodc majorc
Combiner layers
Population of chromosomes
e=27.8%
Figure 4: Diagrams showing the misclassification rates of the final population of chromosomes returned by GA. The lighter
the field the lower error rate of the corresponding classifier fusion system. Thick frame indicates the best combiner for
particular dataset while dashed line shows the performance of the overall best system found.
Classifiers
sepal−length sepal−width petal−length petal−width
klclc loglc ldc qdc pfsvc lmnc
Features
klclc loglc ldc qdc pfsvc lmnc
mcv alkphos sgpt sgot gammagt drinks
Classifiers
Features
Figure 5: Diagrams showing the subsets of features and classifiers selected by the GA for the best performing combina-
tions fused by Min combiner for Iris dataset and Majority Voting for the Liver dataset. Dark field indicate inclusion of the
corresponding pairs feature-classifier in the final system.
ICEIS 2005 - ARTIFICIAL INTELLIGENCE AND DECISION SUPPORT SYSTEMS
232
