
Application of Social Network Theory to Software
Development: The problem of task allocation
Chintan Amrit
Erasmus Research Institute of Management
F1-1, Postbus 1738, RSM Erasmus University
3000 DR, Rotterdam
Abstract. To sy
stematize software development, many process models have
been proposed over the years. These models focus on the sequence of steps
used by developers to create reliable software. Though these process- models
have helped companies to gain certification and attain global standards, they
don’t take into account interpersonal interactions and various other social as-
pects of software development organizations.
In this paper we tackle one crucial part of the Coordination problem in Soft-
ware Development, namely
the problem of task assignment in a team. We pro-
pose a methodology to test a hypothesis based on how social networks can be
used to improve coordination in Software Industry.
In a pilot case study based on 4 teams of Masters Student working in a globally
distributed environment (Holland
and India), the social network structures
along with the task distribution in each of the teams were analyzed.
In each case we observed patterns, which could be used to test many hypothe-
ses on team coordination and task allocation between them.
1 Introduction
“Organizations which design systems are constrained to produce designs which are
copies of the communication structures of these organizations”.
Though Conway said this back in 1968, little has been done to align product
ar-
chitecture to the company communication structure, or the Social Network as we call
it nowadays.
Software has been plagued by many problems and there seems to be a great chasm
bet
ween the theoretical models and the actual implementation in the industry. In a
recent article by Laplante and Neill (2004) found that as many as 1/3 of their survey
respondents followed the waterfall model for Software Development. Though this
model was introduced in 1970 when computer systems were archaic and user needs
were very basic, the fact that it is still in use by a large section of the software devel-
opment industry shows that many of the best practices in software development are
being ignored by the industry (Laplante & Neill, 2004).
Amrit C. (2005).
Application of Social Network Theory to Software Development: The problem of task allocation.
In Proceedings of the 2nd International Workshop on Computer Supported Activity Coordination, pages 3-17
DOI: 10.5220/0002576500030017
Copyright
c
SciTePress

There is also a huge difference between the design and implementation of soft-
ware and as mentioned in one report (The Standish Group, 2003), on an average only
52% of required features and functions make it to the released product.
While there is no single cause for the problems in Software Development, a major
factor is the problem of coordinating activities while developing large software sys-
tems (Kraut & Streeter, 1995). Kraut and Streeter (1995) mention scale of software
projects, inherent unpredictability of software specifications and tasks as well as the
interdependence of software components as some of the factors that lead to the neces-
sity of efficient co-ordination between the different work groups involved in the de-
velopment process.
In this paper we tackle one crucial part of the coordination in Software Develop-
ment, namely the problem of task assignment among team members of a software
development team. The aim of this paper is to come up with insights on the method-
ology by which one can use social network analysis to improve the coordination in
the Software Development Process of an IT company.
In this paper we have come up with a hypothesis and a couple of propositions
based on previous work done on coordination in teams. We conducted a pilot survey
on teams of students who worked on software design tasks. We then observed the
social network of the teams concerned, along with the distribution of the software
design tasks among the team members. We then used the propositions and hypothesis
to predict the performance of the team members and then compared it with the actual
performance of the teams; thereby demonstrating the methodology by which more
such hypothesis and propositions can be verified.
2 Network Theory and Groups
2.1 Social Network and Metrics
The problem of coordination can be better explained by first illustrating the concepts
of social networks and centrality measures. A social network consists of a set of ac-
tors (“nodes”) and the relations (“ties” and “edges”) between these actors
(Wasserman & Faust, 1994).
Researchers have developed a variety of metrics for quantifying the differences in
network structure. Among the many frequently used metrics at the actor level are
degree centrality (the extent to which actors send or receive ties) and betweeness
centrality (the extent to which actors have ties with others who are not directly con-
nected). Metrics used to describe networks include: Density (the ratio of the pairs of
nodes that are mutually reachable to the total number of pairs of nodes) and Centrali-
zation (Difference between the centrality scores of the most central actor and those of
all other actors in a network is calculated, and used to form the ratio of the actual sum
of the differences to the maximum sum of the differences).
How is a group defined, from the network perspective? The construct of a group,
when used in the social network literature has had two primary meanings: (a) a struc-
tural feature of a network, or (b) an exogenously determined or imposed category.
According to the first meaning, groups (cliques, a maximally complete subgraph) are
4

subsets of fully connected, or almost fully connected, nodes within some population
(Katz et al. 2004).
2.2 Internal Networks Ties
The problem of task allocation among team members is closely related to the network
structures formed between them. Several researchers have asked the question “What
is the optimal network for group performance?” Many have broadened the scope of
investigation by moving from the laboratory to the field.
Sparrowe, Liden, Wayne and Kraimer (2001) demonstrated a relation between
network structure and both in-role and extra-role performance in a field setting. They
replicated earlier findings; with a complex task, and found that groups with decentral-
ized communication patterns perform better than groups with centralized communica-
tion patterns. Cummings and Cross (2003) also found that groups with decentralized
communication patterns outperformed more centralized groups.
Other researchers have focussed on the number rather than the pattern of com-
munication links among group members. Baldwin, Bedell and Johnson (1997) and
Reagans and Zuckerman (2001) established in field studies that groups with more ties
performed better than groups with fewer ties.
2.3 External Network Ties
External networks deal with ties to particular strategic others, as well as the overall
structure of those ties (as measured in quantity and pattern), where the ties may be to
other groups or to the environment (Katz et al. 2004). Understanding the context in
which the group is embedded as well as its relationship with key players in its envi-
ronment improves our understanding of how the group functions.
Ancona and Caldwell (1992) show that the pattern of external activity is a better
predictor of group performance than simply the frequency of communication. They
also try to understand the types of external activities that are needed for team effec-
tiveness.
Baldwin et al. (1997) find no relationship between a team’s external ties and its
performance. They suggest that due to the nature of the group’s task the configuration
of their internal ties is more important than their external ties. In other words the
group’s need for external resources is defined by the nature of the task.
Reagans et al. (2004) compare two approaches to team formation, one based on
the member’s demographic characteristics and the other based on the members’ social
networks. They hypothesize that demographic diversity not only decreases the team’s
internal density but also increases the team’s amount of range in its external network,
and that both of these variables have a positive effect on team performance.
5

3 Team Formations and Task Allocation
Teams are the basic building block for many contemporary business organizations.
We focus on how we can improve coordination in software development projects
using the concepts of coordination between and among teams keeping task assign-
ment as a moderating variable. Coordination refers to team-situated interactions
aimed at managing resources and expertise dependencies (Faraj and Sproull 1995).
Research on software development teams has found that team performance is linked
with the effectiveness of teamwork coordination (Kraut and Streeter 1995).
Faraj and Sproull (1995) take two perspectives on coordination: administrative
coordination and expertise coordination. They claim that administrative coordination
(management of tangible and economic resource dependencies) is good for simple
routine tasks, while for complex non-routine intellectual tasks, expertise coordination
(the management of knowledge and skill dependencies) become more important.
Through expertise coordination the team can recognize and access expertise when it’s
needed.
Grinter and Herbsleb (1999) suggest the chief motivation for the assignment of
tasks (involving a search for experts) in R&D projects to be:
Functional Area: an expertise of distant systems,
Product Structure: an understanding of the internals of components built at remote
sites,
Process: knowledge about what happens during other processes,
Customisation: knowledge of core or the knowledge of how the core is custom-
ized depending on which site is involved.
Though their analysis models and solutions seem good for R&D projects, they
have not used the concepts of social networks to improve their model.
Stewart and Barrick (2000) build on organization-level findings and show that
differences in how responsibilities are apportioned and coordinated correspond to
variance in performance at the team level. They also show that the effect of these
social elements is moderated by technical demands (tasks), consistent with socio-
technical systems theory.
Hansen et al. (2001) distinguish between exploration and exploitation tasks
among teams. They show that teams engaged in exploratory tasks complete their
projects more quickly if they have a social network structure composed of many
strong external ties that are non-redundant. In contrast, teams pursuing tasks that
exploit existing expertise take longer to complete if they have this type of social net-
work structure, mainly because external ties have to be maintained but are not much
needed for the task.
Sparrowe et al. (2001) hypothesize that centrality in a work group’s advice net-
work will be positively related to an individual’s job performance. Where centrality
in the advice network reflects an individual’s involvement in exchanging assistance
with co-workers and engaging in mutual problem solving. An individual who is cen-
tral in the advice network is, over time, able to accumulate knowledge about task-
related problems and workable solutions (Baldwin et al., 1997). While the central
individual develops problem solving capability and serves as a valued resource for
future exchanges with co-workers, those individuals who are in peripheral positions
6

in the advice network find it difficult to develop expertise and competencies for high
levels of performance (Sparrowe et al., 2001). Hence, Sparrowe et al. (2001) hy-
pothesize that centralization in a work group’s advice network is negatively related to
group performance.
Yang and Tang (2004) try to analyse the relation between team structure and ISD
performance using a social network approach. They show how the structural proper-
ties of the work groups fluctuate during the various phases of Software Development,
and how group cohesion and centrality are related to the final ISD performance.
Though Yang and Tang (2004) do show how social research methods can be used to
tackle “group process” factors, they do not deal with task allocation nor do they illus-
trate how one can solve the problem of task allocation among team members.
Though these studies indicate how coordination can be improved in industries,
there has been not much work done in the analysing the use of social networks in
improving coordination through better task allocation in the Software Development
industry.
Sparrowe et al. (2001) hypothesize that centralization in a work group’s advice
network is negatively related to group performance. But a group with a high centrali-
zation in the advice network can still perform well if the central individual contributes
in all the phases of development. Adding the task component to the hypothesis 1 by
Sparrowe et al. (2001) we come up with the following proposition:
Proposition 1: When the centralization in the advice network is high then the team
performance increases if the central person(s) contributes in all the different tasks.
Proposition 2: When the density in advice networks is high then the team perform-
ance increases when the tasks are evenly distributed among the team members.
Hypothesis 1: Performance of a team is positively related to the density of the task
network, when the density in the advice network is high.
4 Empirical Test
4.1 Project Questionnaire
A pilot survey was conducted on 4 globally distributed teams of Masters Students
consisting of 8, 8, 7, 7 students respectively. Approximately half of the members of
each team consisted of Dutch students located in a Dutch university and other half
were Indian from a university located in India. The students were asked to select a
topic for a design-based project, and complete four design tasks involving the crea-
tion of a vision document, activity diagram, use case and class diagram for the se-
lected project topic. The data was collected with the help of a questionnaire, in which
among other questions we asked:
Rate your contribution (relative to the average team member) in creating the Vi-
sion Document?
Rate your contribution (relative to the average team member) in creating the activ-
ity diagram?
7

Rate your contribution (relative to the average team member) in creating the Use
Case diagram?
Rate your contribution (relative to the average team member) in creating the class
diagram?
Mark your team members from whom you regularly sought information and ad-
vice to help in your project work.
Mark your team members, whose advice you did not seek, during the course of
the project.
Mark your team members who in your opinion are very dependable in executing a
crucial part of the project.
The first 4 questions had options out of a scale of 5, while the questions 5 to 7 had
the list of all the team members to choose from (multiple members could be checked
for each answer). From the answers to questions 1 through 4 the relative contributions
to the particular task were obtained. This helped in drawing the 2-mode task network.
Where we can see the team members assigned to the tasks (making the Use case dia-
gram, activity diagram etc.) with the links having a particular weight corresponding
to the amount of effort each team member has put in performing the task. The contri-
butions ranged from 1(no relative contribution) to 5 (full contribution). The contribu-
tion was based on team member perception, so it was possible for all the members of
the team to think that they had done the task themselves (all of them to fill 5). From
the answer to questions 5 and 6 the advice network of the group members was ob-
tained. The answer to question 6 confirmed the network obtained from the answer to
question 5. From the answer to question 7 the discussion network among the mem-
bers of the group was obtained.
4.2 Measures
The Network measures were calculated using the tools available in UCINET. The in-
degree centrality scores were computed for each individual (Borgatti, Everett & Free-
man, 1992). Where in-degree centrality (the number of ties received by a vertex) is a
form of degree centrality that counts only those relations with a focal individual as
reported by other group members, and it does not suffer from the limitations of self-
reports, as does out-degree centrality (Sparrowe et al. 2001).
4.3 Network density
In binary network data, density is the proportion of actual nominations among the
total possible number of nominations (Wasserman &Faust, 1994). This was computed
by using the density function of UCINET for networks, using total number of ties
present divided by the total number of all possible ties.
8

4.4 Network Centralization
Network centralization is the sum of the observed differences in individual centrality
scores (computed by finding the differences between the largest individual centrality
score and the scores of all the other individuals in the network) divided by the maxi-
mum possible sum of differences (Wasserman & Faust, 1994). This network centrali-
zation was computed using Freeman’s (1979) definition in the UCINET IV software
package (Borgatti, Everett & Freeman, 1992).
4.5 Task Density
The task network is a 2-mode network (Borgatti & Everett, 1997). In order to find the
density the weighted task network was first dichotomised using the standard di-
chotomise routine in UCINET IV software package (Borgatti, Everett & Freeman,
1992). The cut-off value was considered to be 3, as the contribution of less than 3 on
5 was considered negligible (also because 3 is the median on a scale of 1 to 5). So the
dichotomization rule was as follows:
y(i, j) = 1 if x(i , j) >= 3, and 0 otherwise.
Then the density of this dichotomised 2-mode matrix was calculated using the density
routine of UCINET IV (Borgatti, Everett & Freeman, 1992).
4.6 Team Performance
The final performance of the team was rated according to the following metrics:
Time taken for project completion
Documentation and its revision history
Quality of deliverables
Relevance of alternative solutions suggested
The final grade scored by the individual teams was considered (out of 10).
Table 1. Statistics of some of the network measures
Team
Centraliza-
tion of Ad-
vice Network
Density
of Advice
Network
Density
of task
network
Team 1 52.38% 0.3929 0.7188
Team 2 57.14% 0.3036 0.8125
Team 3 53.33% 0.5000 0.9643
Team 4 20.00% 0.4048 0.8571
9

5 Results
Though we cannot really test the validity of the hypothesis using the statistical data
we have, we can see how this statistical data can be used to predict the actual per-
formance of the teams. On the basis of the results in table 1 we can estimate the per-
formance of the teams according to our propositions. We expect the team with lower
centralization to perform better than the team with higher centralization (Sparrowe et
al, 2001). Thus, according to the centralization of the Advice network we expect the
teams to have performed in the order: Team 4 > Team 1> Team 3> Team 2. We ex-
pect a team with a higher density in the Advice network to perform better than a team
with a lower density (Sparrowe et al., 2001). Thus, according to the density of the
advice network we expect the teams to have performed in the order: Team 3 > Team
4 > Team 1 > Team 2. Finally according to our hypothesis of the density of the task
network we expect then that a team with the higher density in the task network to
perform better than a team with a lower density, when their density in the advice
network is high. Thus according to our hypothesis we expect the teams to be ranked
as: Team 3 > Team 4 > Team 1 > Team 2, as Team 1 has a higher density in the ad-
vice network as compared to Team 2.
We obtained the final ranking by evaluating the quality of the deliverables, which
was: Team 3 > Team 1 > Team 4 > Team 2 (table 2).
Table 2. Evaluation of the Teams
TEAM Grades
Evalua-
tion of
Quality
Overall
Rank
Team 1 7.5 10 2
Team 2 7 8 4
Team 3 7.5 15 1
Team 4 7 10 3
6 Discussion
The results do not entirely support our hypothesis, as the survey was only a pilot
survey conducted on 30 students. On the other hand, this study shows that we can use
social network analysis in order to test hypothesis and propositions related to team
performance in a Software Development project. The results suggest that our hy-
pothesis is not a very bad predictor when it comes to finding the team that performed
the best, or the worst. Also according to the results of this pilot survey we see that the
density of the task network is almost an equal predictor of performance as the density
of the advice network.
10

The Propositions (1 and 2) suggest that tasks in a team must be assigned in accor-
dance to the centrality and density of the advice networks of the team. When the
centrality of the advice network is large, then the team wouldn’t fare well (Sparrowe
et al., 2001) unless the central individual contributes in every aspect of the develop-
ment process, as an individual who is central in the advice network is, over time, able
to accumulate knowledge about task-related problems and workable solutions (Bald-
win et al., 1997). Then again, when the density of a team’s advice network is large
then the team performs well, when the tasks are distributed more evenly among the
team members.
From figures I to VIII (see appendix at the end), we can see that when the density
in the advice network is high (Fig. V), along with the density of the Task Network
(Fig. VI), the performance of the team is very good (table 2). While when the density
of the advice network is low (Fig III) and the density of the corresponding task net-
work is also low (Fig IV) then the performance of the team suffers (table 2).
In all the figures I to VIII we see that the advice networks consists of a structural
hole (Monge & Contractor, 2003) on either side of which represents the Indian com-
ponent (a connected subgraph) and the Dutch component (another connected sub-
graph) of the globally distributed team. The structure of these advice networks further
shows the presence of gatekeepers, who are persons involved in communicating with
their global (Dutch or Indian as the case maybe) counterparts. In the case when one of
the components (Indian or Dutch) in the advice networks is not well connected we
see that the performance of the groups suffers. This is evident in figure III, where the
Indian component is sparsely connected. This can be further be used to show the
differences in predicting the performance of Team 1 and Team 4. Though, the differ-
ences can be due to several factors, as is common in most Software Development
Projects (Kraut & Streeter, 1995) from a network perspective we can say that the
visible difference in their advice networks might have contributed to the difference in
performance. We find that the advice network of the Indian component in Team 1
(figure I) is not so well connected as the advice network of the Indian component in
Team 4 (figure VII). From this difference in structure one can say that the lack of a
well-connected advice network of a component of a globally distributed team might
have had an impact on the performance of the team, causing Team 1 to perform worse
than Team 4.
7 Limitations
The primary limitation is that the empirical data is weak, as the sample size is too
small for any kind of statistical analysis. The idea behind this paper is to illustrate
how this methodology can be used for future analysis on larger samples.
The students in the Dutch University were without much industrial experience
while the students in the Indian University had some industrial experience. Further,
the teams were composed of relative equals and had limited existence, making them
unlike most real world teams. In future research, more case studies/surveys need to be
conducted on people working in the software industry.
11

The tasks, which were a part of their course project, were at best small tasks at the
design stage of software development. Also, the number of modules was limited to
four, while in a normal software development project the number of modules runs
into thousands and corresponding number of tasks per person can be much higher.
So, in future such a study can be conducted in an IT company with more demanding
project requirements.
Although sociometric techniques were used with small groups in experimental re-
search conducted in the 1950s (Shaw, 1964), it should be noted that contemporary
research typically studies networks larger in size than the groups studied here.
8 Conclusion
This study adds to the growing body of theory in software development methodology,
using social networks. Though there have been many papers written on the develop-
ment of architecture in Software Engineering, there have been few studies on improv-
ing the development of Software using social networks with better task allocation
strategies. This study adds the task component in judging group performance through
advice networks, which was dealt with in the paper by Sparrowe et al. (2001) and
shows a method of verification of such hypothesis.
In future research, more surveys/case studies can be conducted on larger groups in
the Software Industry to test the hypothesis presented as well as other related hy-
potheses on task allocation and group structure. Further, such a test can be conducted
in a longitudinal manner at different stages of the software development project. Add-
ing the time component can throw more light on the way social networks change and
develop during the course of a project. It could also be used to understand the differ-
ent task allocation strategies needed to make a project successful.
Software engineering can only advance towards being an engineering discipline
by moving away from its current dependency upon advocacy and analysis, and by
employing more systematic empirically-based approaches to developing an under-
standing of what works, why and under what conditions. This paper is a first attempt
towards such an empirically based approach. It’s an attempt at opening the black box
of the complex development process, which goes into a software development pro-
ject.
Acknowledgements
Jos Van Hillegersberg, RSM Erasmus University, my supervisor, without whose
guiance the survey wouldn’t have been possible, Sridhar V, MDI, Gurgaon, who
helped in initiating the survey,Dhruv Nath, MDI Gurgaon, who contributed in con-
ducting the survey
12

References
1. Ancona, D.G., & Caldwell, D.F. (1992). Bridging the boundary-external activity and per-
formance in organizational teams. Administrative Science Quarterly, 37, 634-665
2. Baldwin, T.T., Bedell, M.D., & Johnson, J.L. (1997) The social fabric of team-based MBA
program: Network effects on student satisfaction and performance. Academy of Manage-
ment Journal, 40, 1369-1397.
3. Borgatti, S.P. & Everett, M.G. (1997). Network Analysis of 2-mode data. Social Networks,
19, 243-269.
4. Borgatti, S.P., Everett, M.G. & Freeman, L.C. (1992). UCINET IV version 1.0 reference
manual. Colmbia, SC: Analytic Technologies
5. Cummings, J.N., & Cross, R. (2003) Structural properties of work groups and their conse-
quences for performance. Social Networks, 25, 197-281
6. Faraj Samer and Spruoll Lee (2000), Coordinating Expertise in Software Development
Teams, Management Science, Vol 46, No 12.
7. Freeman, L.C. (1979), Centrality in social networks, Conceptual clarification. Social Net-
works, 1: 215-239.
8. Grinter E. Rebecca and Herbsleb D. James (1999), The Geography of Coordination: Deal-
ing with Distance in R&D Work, Proceedings of the international ACM SIGGROUP con-
ference on Supporting group work
9. Hansen, M.T., Podolny, J.M. & Pfeffer, J. (2001). So many ties, so little time: A Task
contingency perspective on corporate Social Capital in organizations. Social Capital of Or-
ganizations, Elsevier Science Ltd., Vol 18, pages 21-57.
10. Katz, N., Lazer, D., Arrow, H. and Contractor, N. (2004), Network Theory and Small
Groups, Small Group Research, Vol. 35, No 3.
11. Kraut, E. Robert & Streeter, A. Lynn (1995). Coordination in Software Development.
Communication of the ACM, Vol. 38, No. 3.
12. Laplante, A Phillip & Neill, J. Collin (2004). The Demise of the Waterfall Model is immi-
nent and other Urban Myths. ACM Queue, (February 2004)
13. Monge R. Peter & Contractor S. Noshir (2003). Theories of Communication Networks.
Oxford University Press.
14. Reagens, R., &, Zuckerman, E.W. (2001). Networks, diversity and productivity: The social
capital of corporate R&D teams, Organization Science, 12, 502-517.
15. Reagens, R., Zuckerman, & E., McEvily, B. (2004) How to make the Team: Social Net-
work vs. Demography as Criteria for Designing Effective Teams. Administrative Science
Quarterly, 49, 101-133
16. Shaw, M.E., 1964, Communication Networks, In L. Berkowitz(Ed.), Advances in experi-
mental social psychology: 111-147. New York: Academic.
17. Sparrowe, R.T., Liden, R.C., Wayne, S.J., & Kraimer M.L. (2001) Social Networks and the
performance of individuals and groups. Academy of Management Journal, 44, 316-325
18. Stewart L. Greg & Barrick R. Murray (2000). Team Structure and Performance: Assessing
the mediating role of intrateam process and the moderating role of task type. Academy of
Management Journal, Vol 43, No. 2
19. The Standish Group, http://www.standishgroup.com/press/article.php?id=2 (2003)
20. Wasserman, S & Faust, K (1994). Social network analysis. Cambridge, MA: Cambridge
University Press.
21. Yang, Heng-Li & Tang, Jih-Hsin (2004). Team structure and team performance in IS
development: a social network perspective. Information & Management, 41, 335-349
13
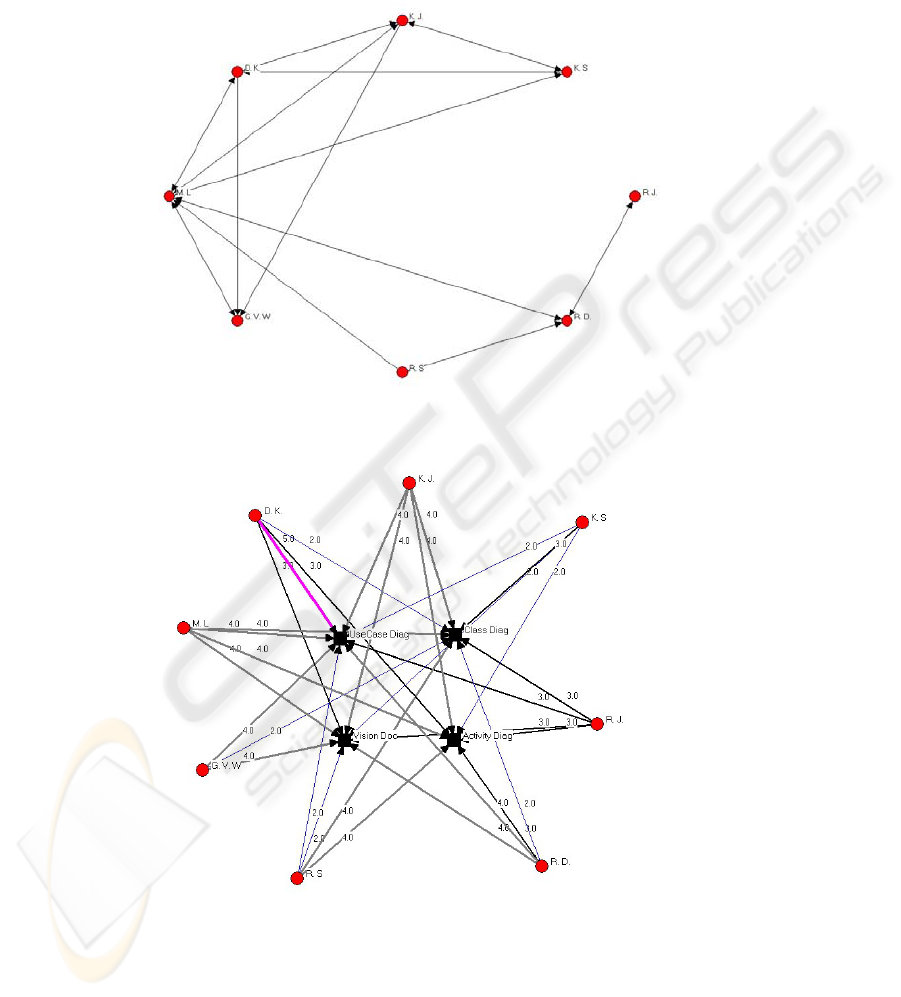
Appendix
Fig. 1. Advice Network of Team 1
Fig. 2. Task Network of Team 1
14
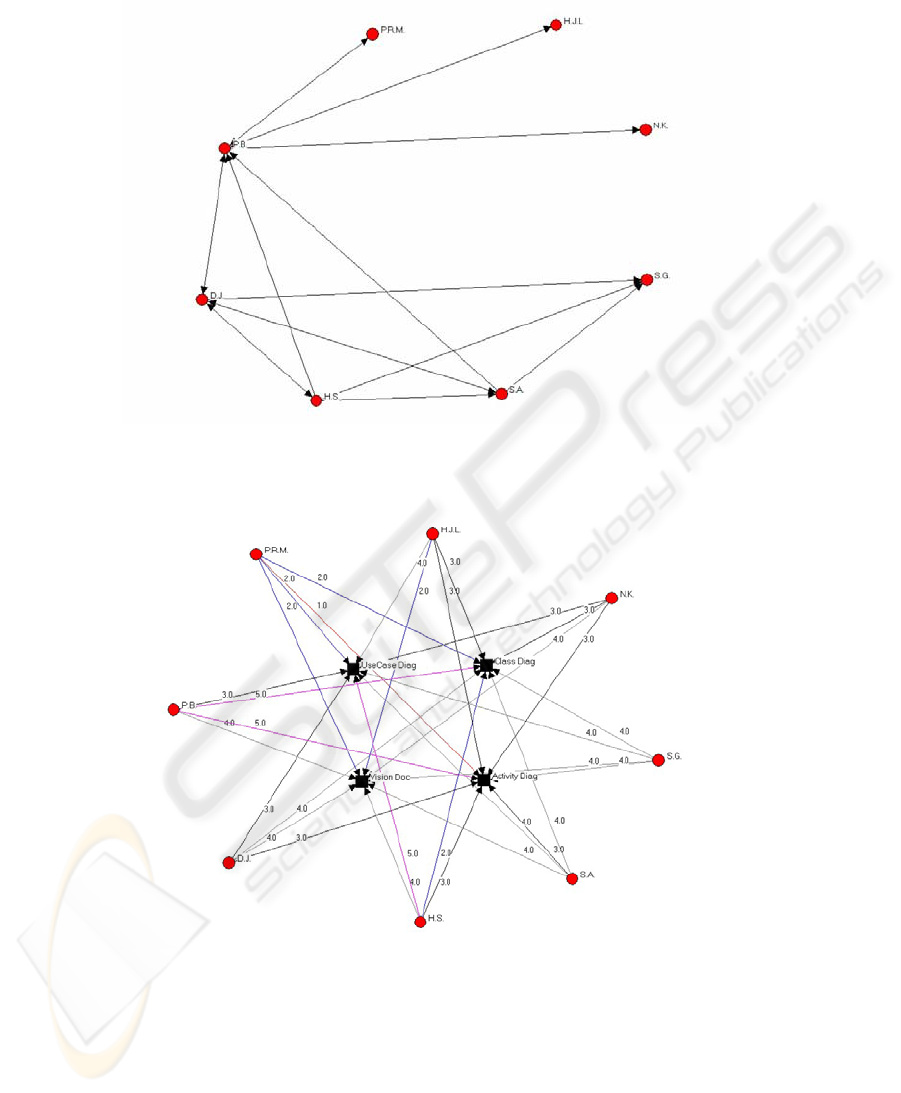
Fig. 3. Advice Network of Team 2
Fig. 4. Task Network of Team 2
15
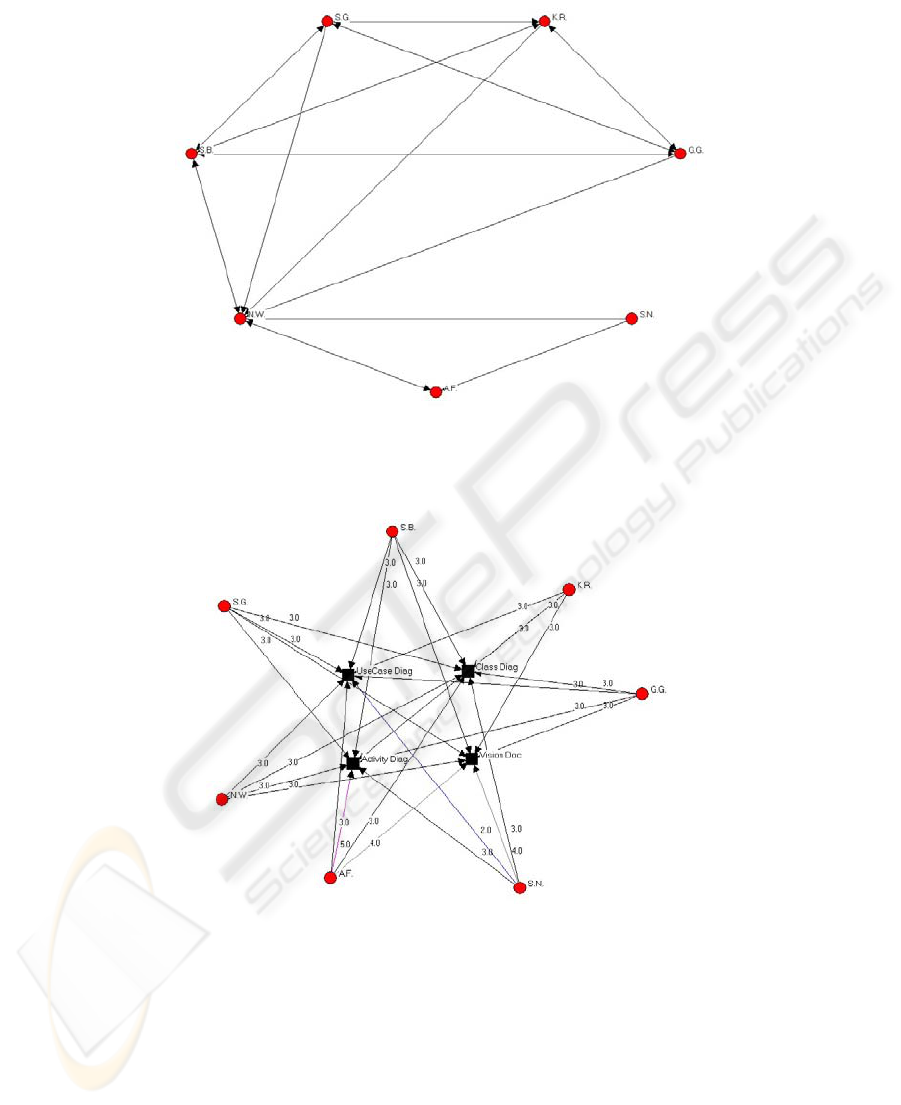
Fig. 5. Advice Network of Team 3
Fig. 6. Task Network of Team 3
16
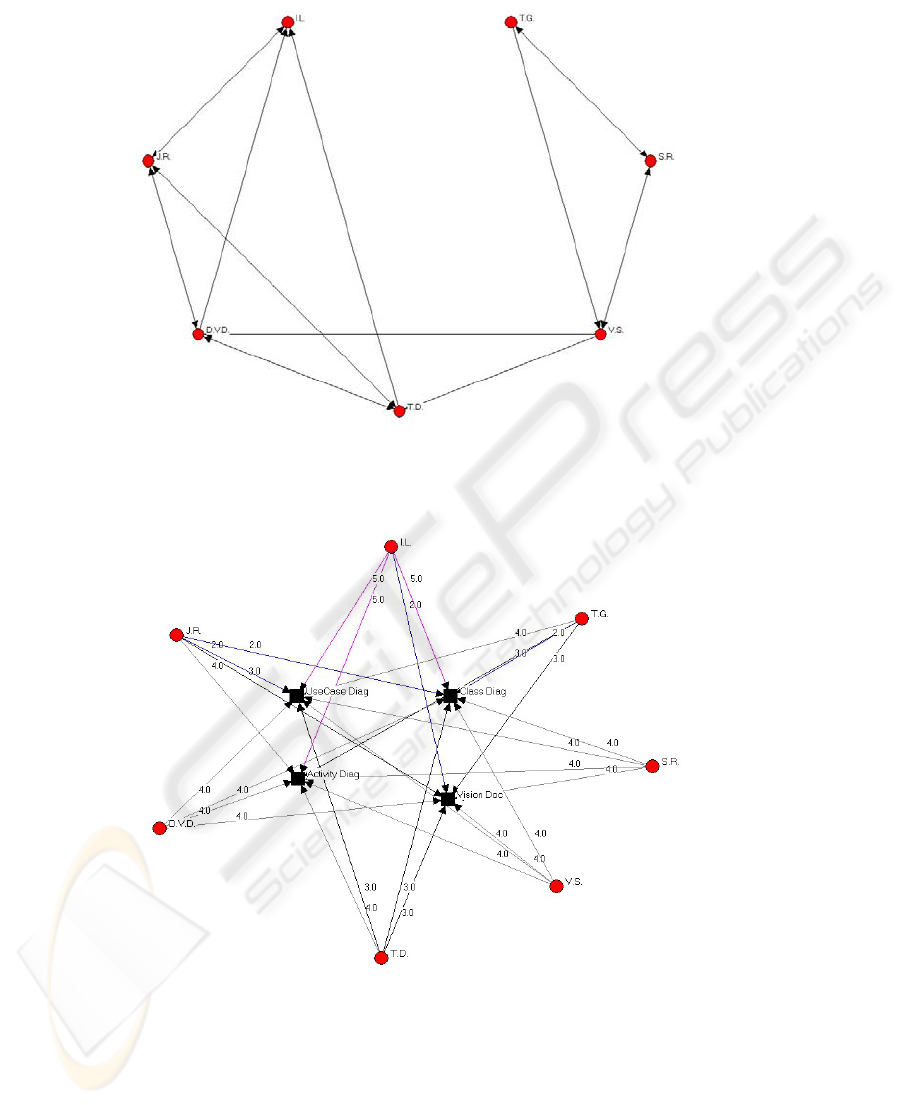
Fig. 7. Advice Network of Team4
Fig. 8. Task Network of Team 4
17
