
Return On Security Investment (ROSI)
A Practical Quantitative Model
Wes Sonnenreich, Jason Albanese and Bruce Stout
SageSecure, LLC 116 W. 23
rd
St., 5
th
Floor, NY, NY 10011 USA
Abstract. Organiza
tions need practical security benchmarking tools in order to
plan effective security strategies. This paper explores a number of techniques
that can be used to measure security within an organization. It proposes a new
benchmarking methodology that produces results that are of strategic
importance to both decision makers and technology implementers. The
approach taken reflects a work-in-progress that is a combination of practical
experience and direct research.
1 Introduction
In a world where hackers, computer viruses and cyber-terrorists are making headlines
daily, security has become a priority in all aspects of life, including business. But
how does a business become secure? How much security is enough? How does a
business know when its security level is reasonable? Most importantly, what's the
right amount of money and time to invest in security?
Executive decision-makers don't really care whether firewalls or lawn gnomes
protect their c
ompany's servers. Rather, they want to know the impact security is
having on the bottom line. In order to determine how much they should spend on
security, they need to know:
• How m
uch is the lack of security costing the business?
• Wh
at impact is lack of security having on productivity?
• What im
pact would a catastrophic security breach have?
• What a
re the most cost-effective solutions?
• Wh
at impact will the solutions have on productivity?
Before spending money on a product or service, decision-makers want to know
th
at the investment is financially justified. Security is no different -- it has to make
business sense. What decision-makers need are security metrics that show how
security expenditures impact the bottom line. There's no point in implementing a
solution if its true cost is greater than the risk exposure. This paper will present a
Sonnenreich W., Albanese J. and Stout B. (2005).
Return On Security Investment (ROSI) A Practical Quantitative Model.
In Proceedings of the 3rd International Workshop on Security in Information Systems, pages 239-252
DOI: 10.5220/0002580202390252
Copyright
c
SciTePress

model for calculating the financial value of security expenditures, and will look at
techniques for obtaining the data necessary to complete the model.
2 A Return on Investment Model for Security
"Which of these options gives me the most value for my money?" That's the
fundamental question that Return On Investment (ROI) is designed to answer. ROI is
frequently used to compare alternative investment strategies. For example, a
company might use ROI as a factor when deciding whether to invest in developing a
new technology or extend the capabilities of their existing technology.
Investment ofCost
Investment ofCost - Returns Expected
=ROI
(1)
To calculate ROI, the cost of a purchase is weighed against the expected returns
over the life of the item (1). An overly simplistic example: if a new production
facility will cost $1M and is expected to bring in $5M over the course of three years,
the ROI for the three year period is 400% (4x the initial investment of net earnings).
A simple equation for calculating the Return on Investment for a security
investment (ROSI) is as follows:
CostSolution
CostSolution - Mitigated)Risk %Exposure(Risk
•
=ROSI (2)
Let's see how this equation works by looking at the ROI profile for a virus
scanner. ViriCorp has gotten viruses before. It estimates that the average cost in
damages and lost productivity due to a virus infection is $25,000. Currently, ViriCorp
gets four of these viruses per year. ViriCorp expects to catch at least 3 of the 4
viruses per year by implementing a $25,000 virus scanner.
Risk Exposure: $25,000, 4x per year = $100,000
Risk Mitigated: 75%
Solution Cost: $25,000
%200
$25,000
$25,000 - %)75($100,000
==
•
ROSI
(3)
The virus scanner appears to be worth the investment, but only because we're
assuming that the cost of a disaster is $25,000, that the scanner will catch 75% of the
viruses and that the cost of the scanner is truly $25,000. In reality, none of these
numbers are likely to be very accurate. What if three of the four viruses cost $5,000
in damages but one costs $85,000? The average cost is still $25,000. Which one of
240

those four viruses is going to get past the scanner? If it's a $5,000 one, the ROSI
increases to nearly 300% -- but if it's the expensive one, the ROSI becomes negative!
Coming up with meaningful values for the factors in the ROSI equation is no
simple task. At the time of writing, there is no "standard" model for determining the
financial risk associated with security incidents. Likewise, there are also no
standardized methods for determining the risk mitigating effectiveness of security
solutions. Even methods for figuring out the cost of solutions can vary greatly. Some
only include hardware, software and service costs, while others factor in internal
costs, including indirect overhead, and long-term impacts on productivity.
There are techniques for quantitatively measuring risk exposure, but the results
tend to vary in accuracy. For most types of risk, the exposure can be found by
consulting actuarial tables built from decades of claims and demographic statistics.
Unfortunately, similar data on security risk does not yet exist. Furthermore, the
variability in exposure costs can lead to misleading results when predicting based on
actuarial data. In the ViriCorp example, the exposure cost is misleading -- the
average cost of $25,000 doesn't reflect the fact that most incidents cost very little
while some cost quite a lot.
Is there any point to calculating ROSI if the underlying data is inaccurate?
Apparently so, since some industries have been successfully using inaccurate ROI
metrics for decades. The advertising industry is one such example. Ads are priced
based on the number of potential viewers, which is often extrapolated from
circulation data and demographics. The ad buyers assume that the true number of ad
viewers is directly correlated to the number of potential viewers; if the viewer base
doubles, roughly twice as many people will probably see the ad. Therefore, even
though they may never know the true number of viewers, ad buyers can nonetheless
make informed purchasing decisions based on other more reliable measurements.
If the method for determining ROSI produces repeatable and consistent results,
ROSI can serve as a useful tool for comparing security solutions based on relative
value. In the absence of pure accuracy, an alternate approach is to find consistent
measurements for the ROSI factors that return comparably meaningful results. This
task is much easier, and breaks through the barrier of accuracy that has kept ROSI in
the domain of academic curiosity.
KEY POINT: Repeatable and consistent metrics can be extremely valuable --
even if they're "inaccurate".
2.1 Quantifying Risk Exposure
A simple analytical method of calculating risk exposure is to multiply the projected
cost of a security incident (Single Loss Exposure, or SLE) with its estimated annual
rate of occurrence (ARO). The resulting figure is called the Annual Loss Exposure
(ALE).
While there are no standard methods for estimating SLE or ARO, there are
actuarial tables that give average statistical values based on real-world damage
reports. These tables are created from insurance claim data, academic research, or
independent surveys.
241

Risk Exposure = ALE = SLE * ARO (4)
It's very difficult to obtain data about the true cost of a security incident (the
SLE). This is because few companies successfully track security incidents. Security
breaches that have no immediate impact on day-to-day business often go completely
unnoticed. When a breach does get noticed, the organization is usually too busy
fixing the problem to worry about how much the incident actually costs. After the
disaster, internal embarrassment and/or concerns about public image often result in
the whole incident getting swept under the rug. As a result of this "ostrich response"
to security incidents, the volume of data behind existing actuarial tables is woefully
inadequate.
Currently, the "best" actuarial data comes from efforts such as the annual survey
of businesses conducted by the Computer Security Institute (CSI) and the U.S.
Federal Bureau of Investigation (FBI). The businesses are asked to estimate the cost
of security incidents for various categories over the course of a year. Unfortunately,
the methods used to calculate these costs vary from business to business. For
example, one business might value a stolen laptop based on its replacement cost.
Another might factor in the lost productivity and IT support time, and yet another
might factor in lost intellectual property costs. As a result, some businesses value a
laptop theft at $3000; others put it down as $100,000+. The final number is more
likely to be influenced by business factors (how much will insurance reimburse, what
are the tax implications, what impact will a large loss have on the stock price) than by
financial reality.
For the purposes of ROSI, the accuracy of the incident cost isn't as important as a
consistent methodology for calculating and reporting the cost, as previously
discussed. It would be quite challenging to get companies to agree upon a standard
technique for tabulating the internal cost of a security incident. Therefore, the focus
must be on cost factors that are independently measurable and directly correlate to
the severity of the security incident.
One potentially significant cost is the loss of highly confidential information. In
organizations valued for their intellectual property, a security breach resulting in theft
of information might create a significant loss for the business yet not impact on
productivity. The cost of a security incident in this case is the estimated value of the
intellectual property that is at risk, using industry-standard accounting and valuation
models. For most industries, analysts are already externally measuring this value. If
an organization doesn't already estimate the value of its IP assets, it probably doesn't
need to consider this cost.
Another significant cost is the productivity loss associated with a security
incident. For many organizations the cost in lost productivity is far greater than the
cost of data recovery or system repair. Security can be directly connected to an
organization's financial health by including lost productivity in the cost of a disaster.
This approach automatically forces security projects to improve business efficiency
and eliminates those projects justified solely by fear of the unknown.
Lost productivity can have a serious impact on the bottom line. Just ten minutes
of downtime a day per employee can quickly add up to a significant amount, as
illustrated in Table 1.
242
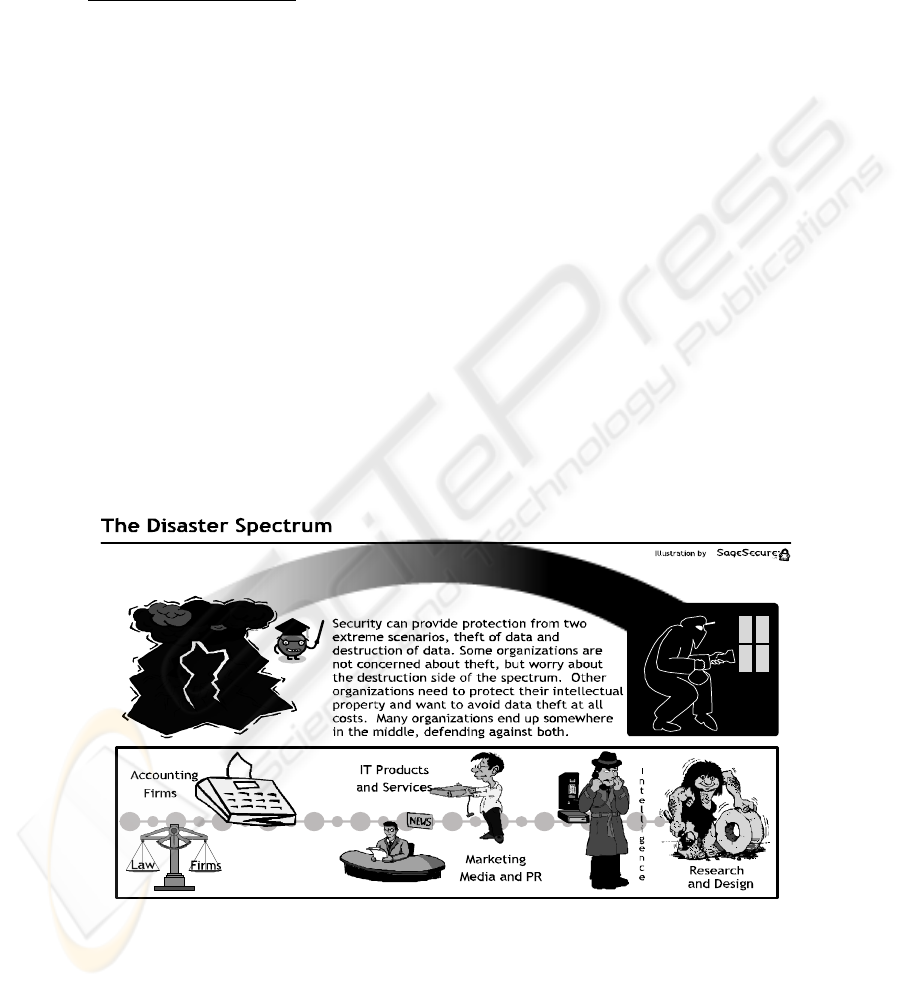
Table 1. Lost Productivity Adds Up
1000 employees
* 44 Hours/year security related "downtime"
* $20 per hour average wage
= $880,000 per year in lost productivity
Whether an organization uses lost productivity, intellectual property value or a
combination of both as a measurement of risk exposure depends on whether it's more
worried about theft of data, availability of data, or both. Professional service firms
such as law and accounting firms tend to be more sensitive toward data availability;
if they can't access critical files they can't bill effectively. This directly impacts on the
bottom line. R&D-intensive organizations such as biotech labs will be much more
concerned about data theft; the information might enable a competitor to gain an edge
on time-to-market. The disaster spectrum diagram (Figure 1) further illustrates this
concept.
Analysts and accountants can provide consistent valuations of intellectual
property, but how can lost productivity be measured? Internally, productivity is often
measured using a combination of performance appraisals and profit/loss metrics. The
problem with this approach is that isolating security's impact on productivity from
other factors (such as poor performance) is impossible. Technical measurements of
system downtime are also not adequate since system downtime is only relevant when
it prevents someone from doing their job. An hour of server downtime at 3am usually
doesn’t have a significant impact on productivity. It's much more important to
measure the end-user's perception of downtime, since this directly corresponds to
their productivity.
Fig. 1. The Disaster Spectrum
243

Measuring employee perception of downtime can be accomplished with a survey.
If the survey is correctly constructed, there will be a strong correlation between the
survey score and financial performance. Specifically, if a department shows a
decrease in perceived downtime, it should also show an increase in productivity on
the internal balance sheets.
A good survey will ask the employees questions that have coarse quantitative
answers, or answers that imply a quantitative value. For example, one question might
be, "How much spam do you receive each day?" The employee might have to choose
between four answers: less than 10, 10-30, 30-50 or more than 50. Average minutes
of downtime can be associated with each answer. For example, dealing with 30-50
spam messages per day can cause up to ten minutes of downtime, especially if it's
hard to tell the difference between spam and desired messages.
The key to getting consistent results from a survey that measures employee
perception is to ensure that the questions are quantitative, clear and answerable
without too much thought. For example, a bad question would be "Estimate the
amount of downtime you had this month," since few people could answer this
without logging events as they happen. A better question is to ask, "How often is the
fileserver unavailable for more than 10 minutes (daily, weekly, monthly, rarely)". A
person who experiences weekly fileserver problems is unlikely to put down "daily"
unless the problem is extremely frequent.
Once the survey answers are scored, the result will be an indication of monthly
downtime. This can be converted into a dollar amount of lost productivity by using
salaries expressed as hourly rates. For example, if the average salary for a department
is $75/hour and the average downtime is 30 hours per month, then the company is
losing $2250 in non-productive time per employee due to security-related issues. In a
professional service firm, these employees might also generate revenue. The hourly
billable rate multiplied by the revenue realization rate and the monthly downtime
gives an additional quantification of lost revenue opportunity. Tuning the
productivity survey so that the calculated loss exhibits stronger correlation with
internal financial measurements of profit and loss can increase accuracy.
KEY POINT: With a good survey and scoring system for productivity, combined
with external measurements of intellectual property value, it becomes possible to
quantify risk exposure in a repeatable and consistent manner.
A downtime assessment can provide a post-mortem analysis of lost productivity
during a security incident. The loss measured can be used when calculating the ROI
of security solutions designed to prevent similar problems in the future.
Unfortunately, there has yet to be a study combining such analyses into an actuarial
table associating productivity loss with particular security incidents. This means that
if a particular incident has already happened to an organization, it can't rely on
commonly available statistics for estimating loss.
It is possible to use a downtime assessment to estimate the productivity loss
associated with an incident that hasn't yet happened. If an organization wanted to
predict the impact of a virus, it might conduct a downtime assessment to gain a
baseline measurement of productivity. It would then take the assessment results and
varying responses to questions dealing with lost data, bandwidth issues, etc. The
result would be a range of potential productivity loss, which could be used to
244

calculate a maximum and minimum ROI for solutions that prevent virus outbreaks. A
useful tool for this type of analysis is a Monte Carlo simulation, which automates the
process of varying a number of factors at the same time and returns a range of
potential results.
Another useful application of a downtime assessment is when examining the
general impact of security on organizational productivity. Minor, everyday security
breaches and technology failures can cause significant productivity loss when
aggregated over time. Table 2 shows just a handful of factors that can eat up a few
minutes here and there. In our experience, the average company has at least five of
these problems, resulting in over an hour of downtime per day.
The Return on Security Investment equation takes on a new meaning if everyday
productivity loss is used as the risk exposure figure. The implication is that a secure
organization will have less minor breaches and technology failures, and therefore less
lost productivity. The risk due to a major breach is ignored. It completely sidesteps
the problem of calculating ROSI for an event that might not happen by focusing on
problems that are constantly happening. If a security solution can improve overall
security while eliminating some of these problems, it will actually have a positive
ROSI, even if it never stops a serious incident.
KEY POINT: There are a number of ways in which lost productivity can provide
a meaningful estimate of risk exposure, any of which can be used to calculate ROSI.
Table 2. Potential Daily Causes of Lost Productivity
1
Problem
Avg. Downtime
(in minutes)
Application and system related crashes 10
Email filtering sorting and spam 15
Bandwidth efficiency and throughput 10
Inefficient and ineffective security policies 10
Enforcement of security policies 10
System related rollouts and upgrades from IT 10
Security patches for OS and applications 10
Insecure and inefficient network topology 15
Viruses, virus scanning 10
Worms 10
Trojans, key logging 10
Spyware, system trackers 10
Popup ads 10
Compatibility issues - hardware and software 15
Permissions based security problems (user/pass) 15
File system disorganization 10
Corrupt or inaccessible data 15
Hacked or stolen system information and data 15
Backup / Restoration 15
Application usage issues 15
Total Time
240 minutes
1
Based on aggregate SecureMark results and analysis
245

2.2 Quantifying Risk Mitigated
Determining the risk-mitigating benefits of a security device is as difficult as
measuring risk exposure. Most of the problems stem from the fact that security
doesn't directly create anything tangible -- rather it prevents loss. A loss that's
prevented is a loss that you probably won't know about. For example, a company's
intrusion detection system might show that there were 10 successful break-ins last
year, but only 5 this year. Was it due to the new security device the company bought,
or was it because five less hackers attacked the network?
What is the amount of damage that might occur if a security solution fails? While
a few breaches may be the result of direct attacks by those with harmful or criminal
intent, most are not intentionally malicious -- they're the result of automated
programs and curious hackers. Significant damage, while rarely intended by these
hackers, is nevertheless a possibility. This damage is not just confined to systems and
data -- serious incidents can lead to a loss in customer/investor confidence.
The following argument has been used to justify a simple, fixed percentage for
risk mitigation:
• A security solution is designed to mitigate certain risks.
• If the solution is functioning properly, it will mitigate nearly 100% of these
risks (85% to be conservative).
• Therefore, the amount of risk mitigation is 85%.
Unfortunately, there are a number of serious problems with this "logic":
• Risks are not isolatable -- a well-locked door mitigates 0% of risk if the
window next to it is open
• Security solutions do not work in isolation - the existence and effectiveness of
other solutions will have a major impact
• Security solutions are rarely implemented to be as effective as possible due to
unacceptable impact on productivity
• Security solutions become less effective over time, as hackers find ways to
work around them and create new risks
A better approach is to conduct a security assessment and "score" the assessment
based on some consistent algorithm. This score can represent the amount of risk
currently being mitigated. By evaluating risk mitigation within the context of the
network's overall security, the two problems of isolation mentioned above are
avoided. A good assessment will also capture the impact of implementation choices
made for the sake of usability and productivity. Likewise, a good scoring algorithm
will factor in the time impact on solution effectiveness.
When evaluating a security solution, the assessment can be conducted as if the
solution were already in place. The difference between this score and the actual score
is the amount of risk being mitigated due to the solution. When calculating ROSI, the
predicted score (not the difference) should be used as the overall risk mitigation.
246

The accuracy of the score as a measurement of mitigated risk is dependent on the
quality of the assessment and scoring algorithm. Following assessment guidelines
published by standard-setting groups such as the International Security Forum (ISF),
National Institute of Standards in Technology (NIST), and the International
Standards Organization (ISO) will lead to the creation of good assessments. Artificial
Neural Networks can be used to create particularly good scoring algorithms, the
details of which will be discussed in a forthcoming paper.
KEY POINT: Even with an inaccurate scoring algorithm, using a scored
assessment as a method of determining risk mitigation is effective because the scores
are repeatable and consistent, and therefore can be used to compare the ROI of
different security solutions.
2.3 Quantifying Solution Cost
By this point, it should be apparent that the cost of a solution is not just what's written
on its price tag. At the very least, the internal costs associated with implementing the
solution also need to be taken into consideration. But this is also not enough. Once
again, productivity is going to rear its ugly head and demand accountability.
Productivity is important because security almost always comes at the cost of
convenience. Most security solutions end up creating hurdles that employees need to
jump in order to do their jobs. Depending on the size and frequency of these
"hurdles", the lost productivity cost can seriously add up. Table 3 shows how time
can easily be lost due to problems actually created by the very solutions designed to
fix other security problems:
Table 3. Productivity Loss Due to Security Solutions
Problem
Average
Downtime
Application and system related crashes 10 Mins
Bandwidth efficiency and throughput 10 Mins
Over-restrictive security policies 10 Mins
Enforcement of security policies 10 Mins
System related rollouts and upgrades from IT 10 Mins
Security patches for OS and applications 10 Mins
Trouble downloading files due to virus scanning 10 Mins
Compatibility issues – hardware and software 15 Mins
Too many passwords/permissions security problems 15 Mins
It is also possible for a security solution to increase productivity. This happens
when a side effect of the solution happens to eliminate other significant problems that
were hampering productivity. For example, implementing a firewall might require a
network restructuring. The new structure might solve serious bandwidth problems
that were previously creating extensive downtime.
247

This productivity impact can be measured by re-running the productivity surveys
used to estimate risk exposure. The given answers are adjusted to assume that the
solution has been put into place. The difference between the current and projected
productivity is the impact factor that needs to be included in this calculation.
Let's factor productivity into our earlier example with ViriCorp's virus scanner.
We can see that if cost of the solution exceeds $60,000, the ROI is 0% and therefore
it's not worth purchasing. Assuming the full cost of the system remains at $30,000,
there's a margin of $30,000. For 100 employees earning an average of $20/hour, that
margin equates to 3.5 minutes per day of downtime. If implementing the virus
scanner creates more than 3.5 minutes of downtime each day, it's more cost effective
to not purchase the scanner. On the other hand, if the scanner can eliminate downtime
by minimizing the impact of viruses, it could make the scanner quite attractive in
terms of ROI.
KEY POINT: The cost of a solution must include the impact of the solution on
productivity, since this number is often large enough to make or break the viability of
a given solution.
2.4 Taking A Long-Term View
For long-term investments, most financial professionals will want to factor in the
time-value of money. The money spent on the investment is money that could have
been invested in other places. For example, imagine that you must choose between
two functionally equivalent solutions where one costs $100,000 up-front, and the
other $50,000 per year for two years. Both solutions ultimately cost $100,000. But
the second solution is preferable because you can invest the other $50,000 in
something else for a year. The true cost of the second solution is actually less than
$100,000 when the investment potential is factored in. This "adjusted" cost is called
the Net Present Value (NPV).
One of the important factors in calculating Net Present Value is the "discount
rate" -- the estimated rate of return that you could get by putting the money in some
other form of investment. Another interesting piece of information can be obtained
by figuring out what discount rate is necessary to result in an NPV of zero. This is
called the Internal Rate of Return (IRR) and basically tells you what rate the
investment is effectively earning. In general, having an IRR above the discount rate is
a good sign.
In most cases, Net Present Value and the Internal Rate of Return are better
indicators than a simple Return on Investment calculation. But if you can't accurately
predict the timing or magnitude of the costs and benefits over the lifetime of the
investment, you will get misleading results. To illustrate the problem, let's look at the
NPV and IRR of a $10,000 network security device. In the first example, the device
prevents a $50,000 disaster in the fifth year after it's installed. In the second example,
the same disaster is prevented during the first year:
248

Rate Cost Y1 Y2 Y3 Y4 Y5 NPV IRR ROI
#1 0.05 -10000 0 0 0 0 50000 $27,786 38% 400%
#2 0.05 -10000 50000 0 0 0 0 $35,827 400% 400%
Unfortunately, nobody can predict when a security device will prevent a problem.
As a result, one solution is to spread the savings out across the predicted lifetime of
the device. You could also "front-load" the savings, under the assumption that the
device will be most effective at the beginning of its life, and lose effectiveness as the
years progress and hackers figure out how to bypass the device:
Rate Cost Y1 Y2 Y3 Y4 Y5 NPV IRR ROI
#3 0.05 -10000 10000 10000 10000 10000 10000 $31,709 97% 400%
#4 0.05 -10000 17500 15000 10000 5000 2500 $33,316 153% 400%
The problem with using Net Present Value for security investments is that
accuracy is quite critical to obtaining comparatively meaningful results. While ROSI
doesn't factor in the time value of money, it can at least provide comparable figures
with inaccurate (but consistent) data. This may be a case where it's better to be
meaningful than precise.
2.5 Putting It All Together: The SecureMark System
The research and theories put forth in this article are not the result of academic study
-- they are the foundation and result of a business venture. SageSecure was founded
with the goal of enabling businesses to financially justify their security spending.
After studying many different theoretical models and finding no standard practical
models, we decided to develop our own. After a year of development and successful
field use, we believe that our system is on the right track.
The SecureMark system is a real-world implementation of the concepts put forth
in this article. Its goal is to provide a trustworthy standard for security benchmarking,
one that produces consistently repeatable results that are strongly correlated to
financial performance. SecureMark scores can truly be used to compare security
expenditures based on meaningful Return on Security Investment calculations. Our
scoring model is constantly improving and approaching its ultimate goal of providing
meaningful, accurate and consistent results.
SecureMark's assessment surveys are based on ISO17799, NIST and ISF
standards. All major areas recommended by these standards are covered by questions
found in the SecureMark survey. There is even the ability to provide an alternate
scoring that quantifies compliance with ISO17799, NIST and ISF recommendations.
This is not a standard focus of SecureMark, however, since we believe that 100%
compliance with standards does not necessarily equate to ideal security, and certainly
would create serious productivity issues in most organizations. We believe that
specific compliance goals are dependent on the industry and size of an organization.
Achieving 95% compliance with a standard is not impressive if the missing 5% is in
areas of critical importance.
249

A particularly unique approach taken by SecureMark is its focus on productivity.
Risk exposure is measured as the productivity loss due to existing security issues.
Solutions are presented that minimize this loss and therefore provide instantly
realizable returns, as opposed to returns that only happen if the security solution
prevents a major disaster. Our assumption is that serious disasters are rare and hard to
quantify, but everyday incidents create a significant amount of aggregate loss.
Solving these problems provides real returns and improves security at the same time,
which has the side effect of preventing some of those major disasters. That said,
SecureMark could also be used to measure the productivity loss due to a major
disaster. This figure can be used as a specifically accurate risk exposure figure when
comparing the return on security investment of preventative solutions for that
particular type of incident. Either way, productivity is a critical factor and is the
cornerstone of SecureMark's analysis.
Not only is productivity a major factor in calculating risk exposure, but it's also a
significant factor in the cost of a solution. Security solutions can have a positive,
negative or neutral influence on organizational productivity. This influence can be
significant, and must be factored into the cost of the solution. SecureMark can
estimate the impact a given solution will have on overall productivity. This impact is
factored in when prioritizing underlying problems and their respective solutions.
1
The resulting SecureMark scorecard gives all the factors necessary to calculate
the Return On a Security Investment: Risk Exposure expressed in dollars of lost
productivity, and the percentage of risk currently mitigated expressed as a
SecureMark Score. The analysis indicates the top problems prioritized by their
impact on risk exposure and lost productivity. Likewise, the solutions presented are
selected based on their predicted ability to mitigate risk and minimize lost
productivity.
1
It might appear that the productivity impact of a security solution is getting factored in twice: once
because the Risk Mitigated * Risk Exposure gives a $ figure for productivity savings, and a second time
when factored into the cost. These are actually two different ways in which productivity affects ROSI.
The first shows that any security improvement will minimize the chance of productivity draining
incidents, and therefore reclaims some lost productivity, proportional to the increase in risk mitigation.
The second way is the impact that the solution itself will directly have on productivity loss. For
example, implementing a spam filter will marginally improve overall security by stopping a number of
different email-borne threats. This will impact on overall productivity by minimizing downtime due to
these threats. This impact will be captured by the increase in risk mitigation. The spam filter may also
save employees up to 15 minutes per day by improving their email usage efficiency. Factoring the
productivity impact into the cost of the solution will capture this gain. In some cases there is a small
amount of overlap between the two influences, but this is generally inconsequential and can be further
minimized by adjusting the scoring system.
250

In a few years, the data accumulated by SecureMark will allow an unprecedented
amount of accuracy in its scoring and analysis. For now, we have not yet collected
enough data to begin eliminating subjectivity from SecureMark's scoring and
analysis. That said, our system is still consistent, which allows for meaningful
comparison of solutions. It also allows for meaningful industry comparisons -- a
company can tell if its score is above or below industry average. Until the system can
automatically provide accurate results, SageSecure security experts review all scores
and analyses to ensure consistency and accuracy. The result is the only automated,
repeatable and consistent ROSI benchmarking system available to date.
3 Conclusion
In this paper we've presented an analysis of the problem of determining a meaningful
Return on Security Investment for security expenditures. We presented a model for
calculating ROSI, and then showed how the various factors could be obtained. Some
unique approaches to measuring Risk Exposure and Risk Mitigation were explored,
specifically those that focused on lost productivity as a critical factor. The importance
of factoring productivity into both exposure and solution cost was stressed. The
suitability of using Net Present Value in this context was explored, and a real-world
implementation of the entire model (SecureMark) was examined.
We hope the concepts discussed in this paper will encourage further research into
the connection between productivity and security. We feel that this is one of the most
promising areas in which a strong connection can be made between security and
financial performance.
References
1. Information Security Forum, “Standard of Good Practice,” See:
http://www.isfsecuritystandard.com/index_ns.htm
2.
ISO 17799
3.
NSW Government Office of Information and Communications Technology, “Information
Security Guideline,” June 2003. See: http://www.oict.nsw.gov.au/
4.
“Security Metrics Guide for Information Technology Systems Special,” Publication 800-55
US National Institute of Standards and Technology Computer Security Research Centre,
2002. See: csrc.nist.gov/publications/nistpubs/800-55/sp800-55.pdf.
5.
“The Return on Investment for Information Security” See:
http://www.oit.nsw.gov.au/content/7.1.15.ROSI.asp
6.
“The Return on Investment for Information Security” See:
http://www.cisco.com/en/US/netsol/ns340/ns394/ns171/networking_solutions_audience_bus
iness_benefit09186a008010e490.html
7.
Calculated Risk Scott Berinato in CSO Magazine, December 2002. See:
www.csoonline.com/read/120902/calculate.html
8.
Security Attribute Evaluation Method: A Cost-Benefit Approach Shawn A. Butler,
Computer Science Department, Carnegie Mellon University, 2002. See:
www2.cs.cmu.edu/~Compose/ftp/SAEM-(Butler)-ICSE_2002.pdf
251

9. Cost-Benefit Analysis for Network Intrusion Detection Systems Huaqiang Wei, Deborah
Frinke et al. Centre for Secure and Dependable Software, University of Idaho. In
Proceedings of the 28th Annual Computer Security Conference October 2001. See:
wwwcsif.cs.ucdavis.edu/~balepin/new_pubs/costbenefit.pdf
10.
A Guide to Security Risk Management for Information Technology Systems Published by
the Government of Canada Communications Security Establishment, 1996. See:
www.cse.dnd.ca/en/documents/knowledge_centre/publications/manuals/mg2e.pdf
11.
Executives Need to Know: The Arguments to Include in a Benefits Justification for
Increased Cyber Security Spending Timothy Braithwaite in Information Systems Security,
Auerbach Publications, September/October 2001
12.
Seeking Security Scorecards Chris King, Meta Group (File: 9377), Dec 2001
13.
Analysis of Return on Investment for Information Security: Steve Foster and Bob Pacl,
Getronics.
14.
VPN Security and Return on Investment: RSA Solution White Paper
15.
Finally, a Real Return on Security Spending CIO Magazine, 15 February 2002; See:
www.cio.com/archive/021502/security.html.
16.
Secure Business Quarterly, Special Issue on Return on Security Investment, Quarter 4, 2001.
See: www.sbq.com/sbq/rosi/index.html
17.
Computer World ROI Knowledge Centre at
www.computerworld.com/managementtopics/roi
18.
Primer on Cost-Effectiveness Analysis published by the American College of Physicians'
Effective Clinical Practice, September/October 2000. See:
www.acponline.org/journals/ecp/sepoct00/primer.htm
252
