
A SOLUTION FOR EVALUATING THE STOPPER QUALITY IN
THE CORK INDUSTRY
Beatriz Paniagua-Paniagua, Miguel A. Vega-Rodríguez, Juan A. Gómez-Pulido,
Juan M. Sánchez-Pérez
Dept. Informática, Univ. Extremadura, Escuela Politécnica, Campus Universitario s/n, 10071, Cáceres, Spain
Keywords: Stopper quality, cork industry, image processing, automated visual inspection system.
Abstract: In this paper we study a possible solution to a problem existing in the cork industry: the cork stopper/disk
classification according to their quality using a visual inspection system. Cork is a natural and
heterogeneous material, therefore, its automatic classification (usually, seven different quality classes exist)
is very difficult. The solution proposed in this paper shows all the stages made in our study: quality
discriminatory features selection and extraction, texture analysis, analysis of different (global and local)
automatic thresholding techniques and possible classifiers. In each stage we have given more importance to
the study of those aspects that we think could influence the cork quality. In this paper we attempt to evaluate
each of the stages in our solution to the problem of the cork classification in an industrial environment, and
therefore, finding a way to justify the design of our final classification system. In conclusion, our
experiments show that the best results are obtained by a system that works with the following features: total
cork area occupied by defects (thresholding with heuristic fixed value 69), textural contrast, textural entropy
and size of the biggest defect in the cork, all of them working in an Euclidean classifier. The obtained
results have been very encouraging.
1 INTRODUCTION
The most important industrial application of cork is
the production of stoppers and disks for sealing
champagnes, wines and liquors. In fact, according to
the experts, cork is the most effective product,
natural or artificial, for the sealed (Fortes, 1993). In
the cork industry, stoppers and disks are classified in
different quality classes based on a complex
combination of their defects and particular features.
Due to this, the classification process has been
carried out, traditionally, by human experts
manually.
At the moment, there are several models of
electronic machines for the classification of cork
stoppers and disks in the market. The performance
of these machines is acceptable for high quality
stoppers/disks, but for intermediate or low quality,
the number of samples classified erroneously is
large. In conclusion, the stoppers/disks should be re-
evaluated by human experts later. This slows down
and increases in price the process enormously. Think
that, on average, a human expert needs a minimum
training period of 6 months to attain a minimum
agility, although the learning process lasts years
(compare it with other experts: wine tasters, cured
ham tasters, etcetera). Another negative aspect is the
subjectivity degree added to the classification
process due to the necessary human re-evaluation.
We have to add to these antecedents the fact that
Spain is the 2
nd
world producer of cork (CorkQC,
2006), only surpassed by Portugal, and that in
Extremadura (a south-western region of Spain), due
to its geographical situation, the cork industry is one
of its most important industries: it produces 10% of
the world cork (ICMC, 2006).
All these motivations have lead us to the
development of this research, whose main objective
is the construction of a computer vision system for
cork classification based on advanced methods of
image processing and feature extraction in order to
avoid the human evaluation in the quality
discrimination process.
The rest of the paper is organized as follows:
section 2 describes briefly the data used for the
development of our experiments. In section 3, we
present the features used by the classifiers. Then,
334
Paniagua-Paniagua B., A. Vega-Rodríguez M., A. Gómez-Pulido J. and M. Sánchez-Pérez J. (2006).
A SOLUTION FOR EVALUATING THE STOPPER QUALITY IN THE CORK INDUSTRY.
In Proceedings of the Third International Conference on Informatics in Control, Automation and Robotics, pages 334-339
DOI: 10.5220/0001209703340339
Copyright
c
SciTePress
section 4 shows our analysis of the different studied
classifiers. Finally, section 5 displays the statistical
evaluation of the final results obtained by the
proposed whole system, while section 6 exposes the
conclusions and future work.
2 DATA
The database used in our experiments consists in
700 images taken from 350 cork disks (we have
taken two images of each disk, for both heads).
There are seven different quality classes, 50 disks in
each class. The initial classification, in which this
study is based on, has been made by a human expert
from ASECOR (in Spanish: “Agrupación
Sanvicenteña de Empresarios del CORcho”, in
English: “Cork Company Group from San Vicente-
Extremadura”). We suppose this classification is
optimal/perfect and we want to design a system
which obtains the most similar classification results.
3 USED FEATURES
In order to develop our classifiers study, first,
different feature extraction methods have been
analysed: thresholding techniques, statistical texture
analysis and two other heuristic features.
3.1 Thresholding Techniques
The cork stoppers/disks are classified using their
defects. These defects can be obtained by means of
segmentation techniques, and more concretely, by
automatic thresholding techniques (Sonka, 1998). In
our study we evaluate several thresholding
techniques with the purpose of knowing which of
them is the best for this application field. In this
study, in order to classify a cork disk in a specific
class, we only use the feature related with the defect
area in relation to disk area.
For this comparative thresholding analysis we
have studied both global thresholding techniques
and local thresholding techniques (Sahoo, 1988).
The thirteen thresholding methods that have been
studied are the following: slope method (own
proposal) with different minimum slopes, Otsu
method (Otsu, 1978), histogram concavity analysis
method (Rosenfeld, 1983), first Pun method (Pun,
1980), second Pun method (Pun, 1981), Kapur-
Sahoo-Wong method (Kapur, 1985), Johannsen-
Bille method (Johannsen, 1982), moment-preserving
method (Tsai, 1985), statistical thresholding method
(Fisher, 2004) with different modifications, and
Chow-Kaneko method (Chow, 1972).
The results of this study have been obtained by
using for each thresholding method a classifier of
minimum Euclidean distance (Shapiro, 2001). This
classifier is based on the percentage of the defect
area in relation to stopper/disk area. Knowing the
average value of this feature for each class (cork
quality class), we calculate the percentage of defects
for each new stopper/disk and the Euclidean
distances of this to the mean of each class. The
stopper/disk will be classified in the class for which
the smallest Euclidean distance has been obtained.
The following equation shows the functionality of
this classifier.
It is possible that this classifier would not
produce absolutely satisfactory results, due to we
only use a single feature in order to classify the cork
stoppers/disks, but this classifier can indicate
certainly whether the classification tendency is
reasonable or not, that is, the capability as quality
discriminator of each of the thresholding methods.
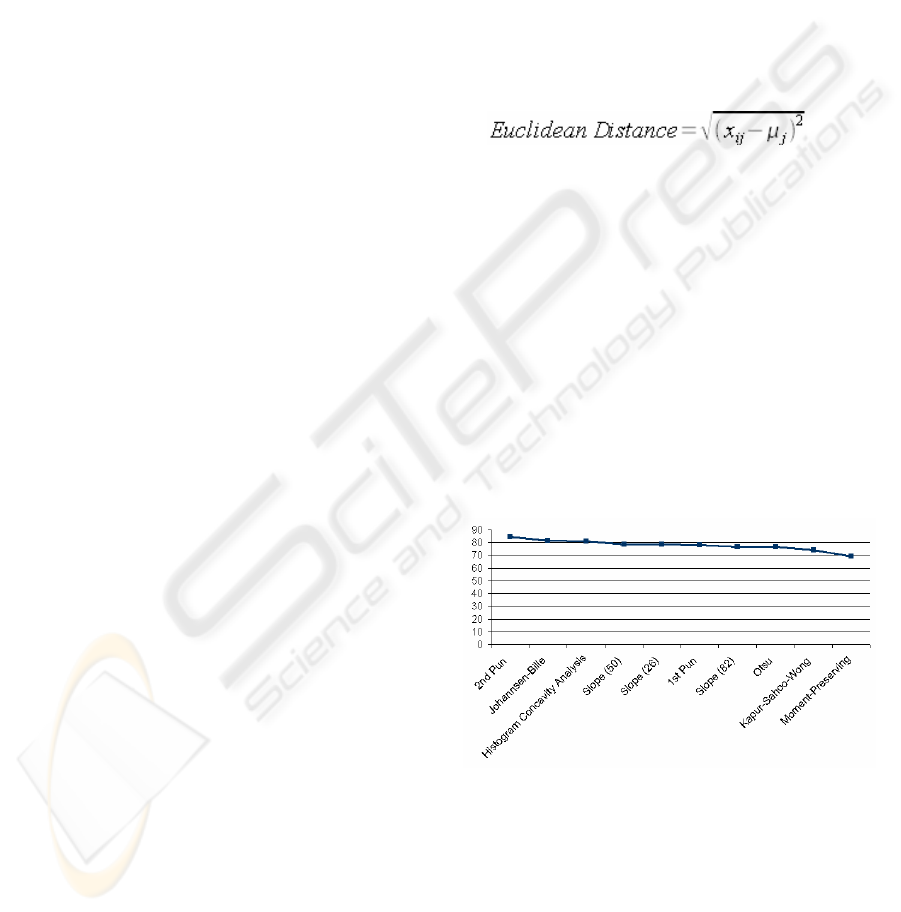
Within global thresholding methods, we find that
the most suitable method for cork industry is the
moment-preserving method. Figure 1 shows the
results (wrong classification percentage) obtained by
the different global thresholding techniques. As we
can see, all the thresholding techniques have
obtained certain discriminatory information,
although the goodness of the obtained results widely
varies between some thresholding methods and
others.
Figure 1: Global thresholding techniques results.
However, we can say that according to the
experimental results the local thresholding
techniques are more suitable for discriminating cork
quality based on the stopper/disk defects, being the
statistical thresholding method which has given the
best results. Figure 2 displays the wrong
classification percentage obtained by the different
local thresholding methods.
A SOLUTION FOR EVALUATING THE STOPPER QUALITY IN THE CORK INDUSTRY
335
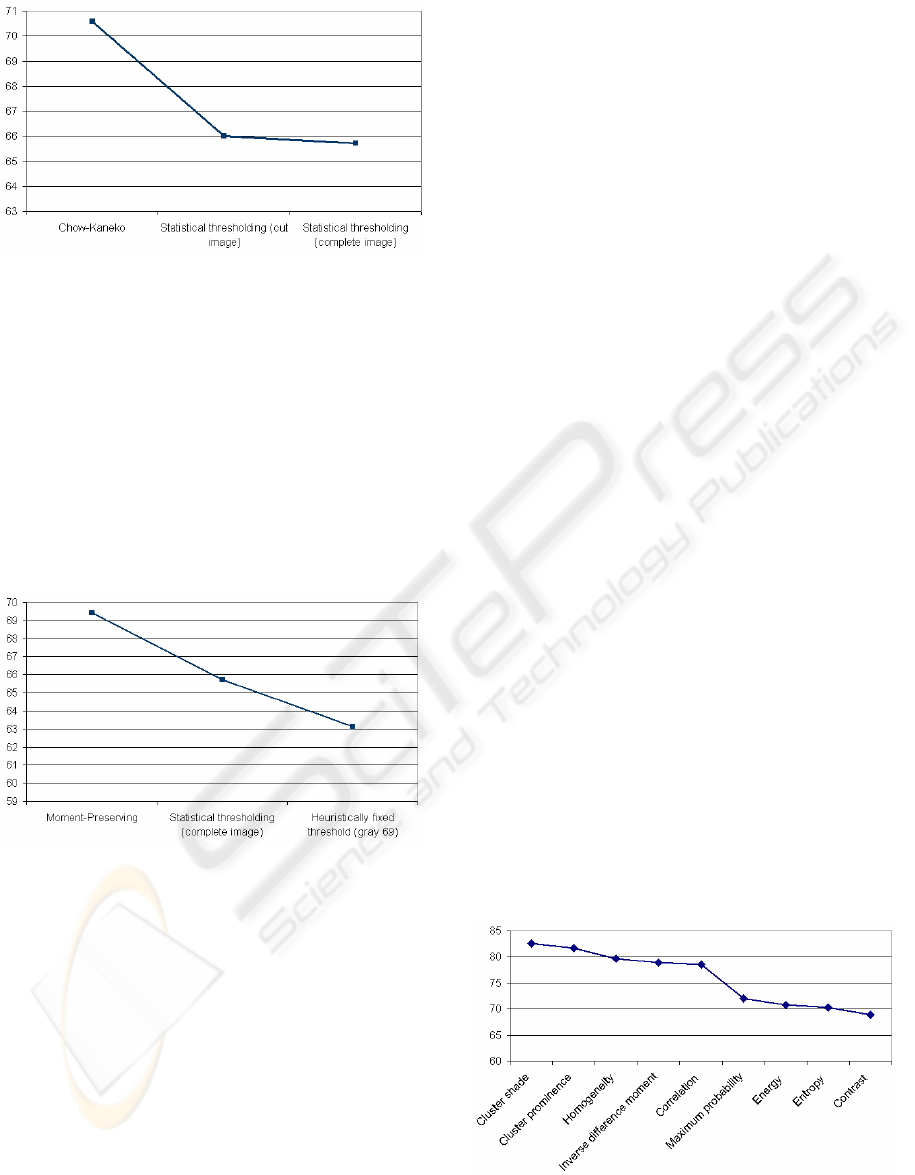
Figure 2: Local thresholding techniques results.
We finish this study comparing the best results
obtained by both the global thresholding methods
and the local thresholding methods, in order to select
the best thresholding method to obtain our first
quality discriminatory feature: the cork area
percentage occupied by defects. It is worthy to say
that, in addition to the studied thresholding methods,
we decided to check a static thresholding method
with a heuristically fixed threshold. The gray level
for the threshold was obtained by using a recursive
statistical study, testing what gray levels gave better
classification results. Finally, a gray level 69 has
been chosen as threshold.
Figure 3: Final results of the thresholding study.
In figure 3 we can observe all these results. In
conclusion, the local thresholding methods have
been more suitable than the global methods for the
solution of our problem. This has been due to they
are able to find better thresholds in unimodal
histograms. Nevertheless, the increase of the
computational cost can make them unsuitable for our
problem. Taking into account all these
considerations, the best of all these methods applied
to our problem has been the static thresholding
method with a heuristically fixed threshold in the
gray level 69.
3.2 Texture Analysis
We think cork texture can also be a powerful quality
discriminator for the cork stoppers/disks. Between
the main methods of texture analysis, structural
analysis and statistical analysis (Shapiro, 2001), we
have chosen the statistical approach due to the high
difficulty to look for given visual patterns (texels) in
the cork, since it is a heterogeneous material. The
work made in this study is based on second-order
gray level texture statistics, proposed by Haralick et
al. (Haralick, 1973). In this second study we
evaluate a great number of these statistical
discriminators based on textures with the purpose of
knowing which of them are most appropriate for the
resolution of our problem.
In order to classify a cork disk in a specific class,
we only use the corresponding textural discriminator
(stopper/disk texture). In our texture analysis we use
statistical quality discriminators based on the co-
occurrence matrix. The studied discriminators are
obtained by means of calculations using the rotation-
robust normalized co-occurrence matrix, and they
are the following: Energy (or Angular Second
Moment (Shah, 2004)), Contrast (or Inertia),
Homogeneity, Entropy, Inverse Difference Moment,
Correlation, Cluster Shade, Cluster Prominence and
Maximum Probability.
The results of this study have been obtained
using the same method that the one used in the
thresholding study (see section 3.1). Figure 4
presents the wrong classification percentage
obtained by the different statistical discriminators.
As we can observe in the graph, texture has certain
discriminatory information that improves the cork
classification according to its quality, although the
goodness of the obtained results widely varies
between some textural features and others, being the
best discriminatory features the textural contrast and
entropy.
Figure 4: Final results for the studied textural features.
ICINCO 2006 - ROBOTICS AND AUTOMATION
336

3.3 Other Features
After the previous features studies, we have
dedicated the last features study stage to the analysis
of other features and processes which could give
positive results in matter of cork classification. After
a deep observation of the classification parameters
used by the human experts in their classifications we
found some guidelines that were worthy to evaluate.
The two studied features have been the hole
existence in the cork area and the biggest defect size
in the cork:
• Hole study: It was observed that the cork
stoppers/disks with holes were relegated to low-
quality classes, in spite of their good cork
texture or their pore homogeneity. The followed
methodology has been to make the classification
by means of the usual Euclidean classifier, but
we have considered the number of hole pixels
when we have made the definitive
classification. This feature only has some
discrimination power in the low-quality cork
classes, concretely from class 4 to class 6 which
are those that begin to have some holes in their
area, reason why this feature must be combined
with another feature that has discrimination
power in the rest of classes. In this case, we
have chosen the defect area.
• The biggest defect size study: It was observed
that those cork stoppers/disks with big defects
also were classified in the lower classes, in spite
of the possible positive details that they could
have. The methodology followed in order to
obtain this feature has been making successive
binary erosions on the thresholded image, with a
5x5 structuring element (each iteration subtracts
two pixels from the defect perimeter). In each
iteration the remaining image percentage is
controlled. In this way, it is possible to obtain
easily the size that the biggest defect could
have, taking into account the number of
iterations required to leave the image in blank.
Finally, the optimum feature selected in this
study has been the biggest defect size in the cork
area.
4 CLASSIFIERS
In this last study, in order to classify a cork disk in a
specific class, we will use the corresponding
classification algorithm based on the four features
selected: defects area (using a static thresholding
method with a heuristically fixed threshold), texture
contrast, texture entropy, the biggest defect size. The
four classifiers chosen for this study are the
following (Shapiro, 2001) (Sonka, 1998): a Back-
Propagation neural network, a K-means classifier,
the K-nearest neighbours classification algorithm,
and a minimum Euclidean distance classifier:
• Back-Propagation neural classifier: The
network designed for this study has a 4x7x3
architecture. The weights associated to the
network interconnections are initialized
randomly and are adjusted during the learning.
The type of learning used by this neural network
is supervised.
• K-means classifier: This classification
algorithm makes reference to the existence of a
number of K classes or patterns, and therefore,
it is necessary to know the number of classes.
We know, a priori, that we have 7 classes,
reason why the algorithm is suitable for our
necessities.
• K-nearest neighbours classifier: This algorithm
is part of the methods group known as
correlations analysis methods. It consists in
classifying an unknown feature vector,
depending on the sample or K samples of the
training set that is/are more similar to it, or what
is the same, which is/are nearer to this vector in
terms of minimum distance. This is what we
know as rule of the nearest neighbours. The
classification algorithm of the K-nearest
neighbours even can be very efficient when the
classes have overlapping, and this is very
interesting for our problem (cork quality
classes). We have evaluated several K sizes (10,
20, 49,…), and the best size was 20.
• Euclidean classifier: The classification
algorithm supposes several classes with their
respective prototypes (centroids). Given an
unknown feature vector to classify, the
Euclidean classifier will associate this vector to
the class whose prototype is closest to it, that is,
the prototype whose Euclidean distance is the
smallest. Our study have been made for four
versions of the Euclidean distance: simple
Euclidean distance (see equation below),
Euclidean distance with prefiltrate (certain
corks were classified directly, without passing
the Euclidean classifier, to low-quality classes if
a hole in them was detected, that is, we used a
set of decision rules in addition to the Euclidean
classifier), scaled Euclidean distance (see
equation below) and modified scaled Euclidean
distance according to the standard deviation (see
A SOLUTION FOR EVALUATING THE STOPPER QUALITY IN THE CORK INDUSTRY
337
equation below). The best results were obtained
using the modified scaled Euclidean distance.
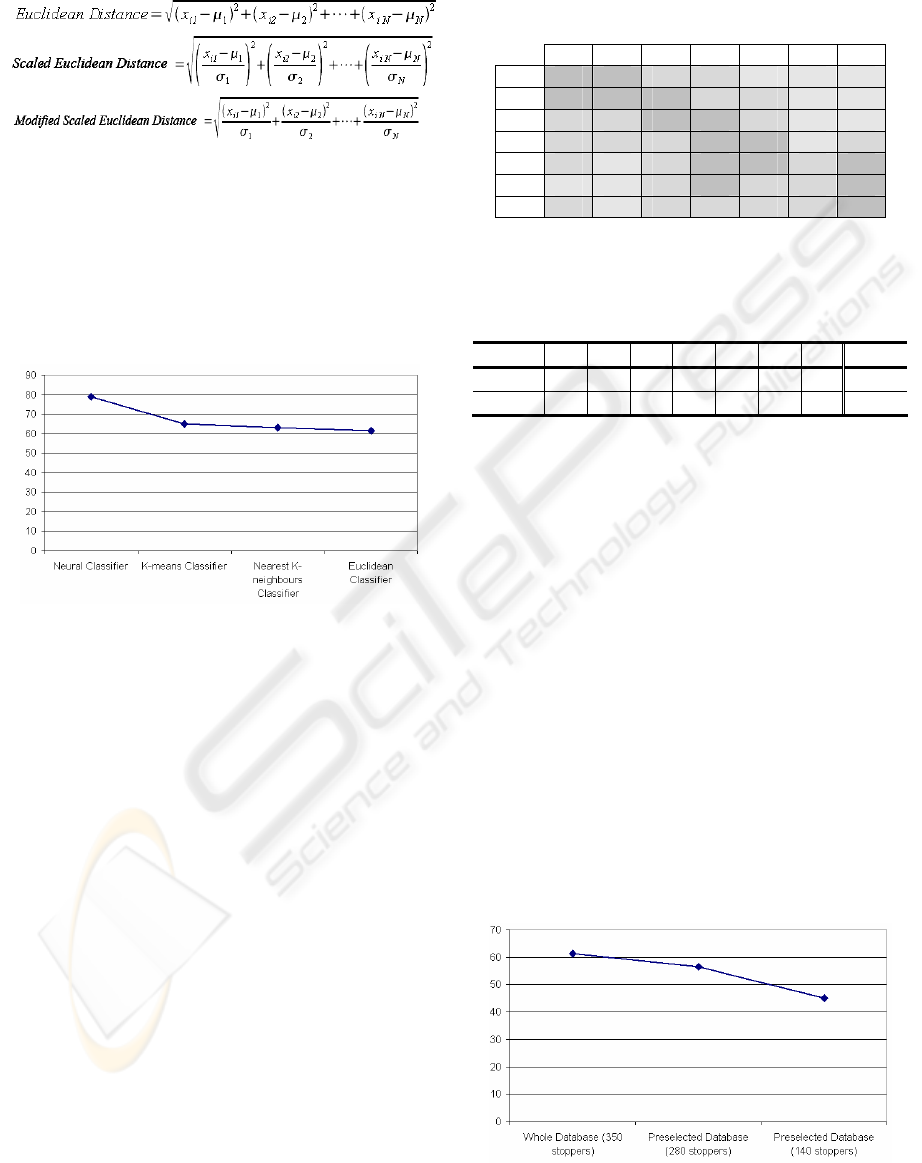
According to the experimental results we can say
that, in case of cork, there are more suitable
classifiers than others, although some of the studied
classifiers have been very near in their final results.
As conclusion, we can say that the Euclidean
classifier has been the more reliable in our
application field. Figure 5 presents the wrong
classification percentage obtained by the different
classifiers.
Figure 5: Final results for the studied classifiers.
5 RESULTS
Having made all these previous studies, we can
conclude that the best cork classification system is
the one based on an Euclidean classifier working
with the following quality discriminatory features:
the cork area occupied by defects (thresholding with
heuristic fixed value 69), the texture contrast, the
texture entropy and the size of the biggest defect in
the cork.
We present the final results obtained by this
system by means of a confusion matrix (Shapiro,
2001), due to its capability to show the conflicts
among the different quality categories. Therefore,
not only the definition of each class will be
displayed, but also the main confusions among them.
The obtained confusion matrix (table 1) presents
quite positive results (the main diagonal of the
matrix is clearly defined). Using a classifier based
on scaled Euclidean distances with the standard
deviation, we can also observe that class 6 acquires a
great power of absorption, that even affects class 4.
On the other hand, we can see a strong
discrimination of classes 0, 6 and 3, with a great
number of corks classified rightly in these classes.
Table 1: Confusion matrix for the final system.
C0 C1 C2 C3 C4 C5 C6
C0 33 12 4 1 0 0 0
C1 19 14 13 3 1 0 0
C2 6 9 15 18 2 0 0
C3 1 4 7 23 11 0 4
C4 2 0 1 10 13 3 21
C5 0 0 1 12 7 6 24
C6 1 0 1 7 7 3 31
The total results are shown in table 2, with a
final wrong classification percentage of 61.42%.
Table 2: Total results for the final system.
C0 C1 C2 C3 C4 C5 C6 TOT.
Wrong 17 36 35 27 37 44 19 215
Right 33 14 15 23 13 6 31 135
In addition to this experiment, which was made
on the complete image database, we have made two
additional experiments: one with a pre-selection of
40 cork disks per class (280 corks in total) and
another with a pre-selection of 20 cork disks per
class (140 corks in total). These tests were done
because there were corks that were classified badly
in a systematic way, therefore, we supposed that the
human expert who performed the first cork
classification (remember that we have based all our
work on this classification) could have made some
mistakes (wrong classifications), or that certain cork
images could have a very poor quality due to the
used acquisition system (camera, illumination, etc.).
The evolution of the obtained results can be seen
in figure 6. We can observe a clear decrease in the
wrong classification percentage, which makes us
think about the possible existence of some errors in
our image database. Observe that the results using an
image database pre-selected with 140 cork disks
(280 images) shows a wrong classification
percentage of 45% (very far from the 61.42%).
Figure 6: Final results of the database pre-selections.
ICINCO 2006 - ROBOTICS AND AUTOMATION
338
6 CONCLUSIONS
In this paper we have performed a deep survey to
conclude in the best classification system among all
the systems proposed. Many possible discriminatory
features have been studied in depth, as well as the
classifiers to work with them.
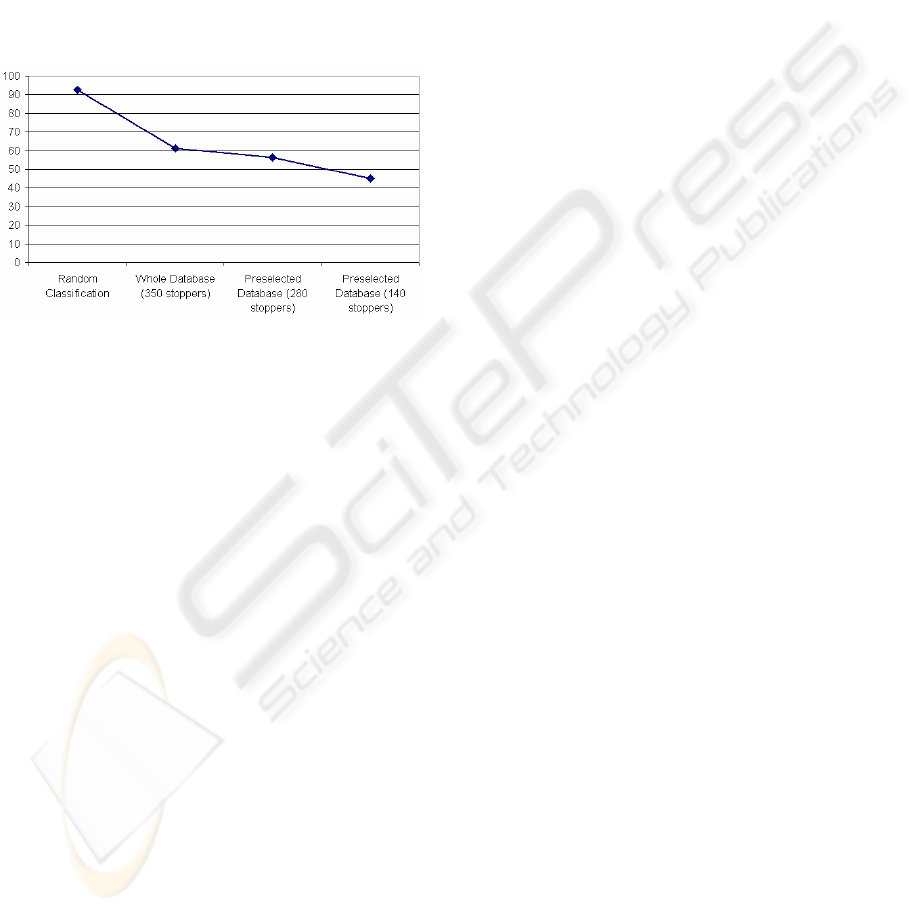
As conclusion, figure 7 presents the wrong
classification percentage obtained by our system for
the different image databases. This graph also
includes the wrong classification percentage that a
random classification would have obtained.
Figure 7: Final results for the studied system.
As we can observe in the previous graph, the
pre-selection with 20 disks per class in our proposed
system has produced the best results (45% of error
rate). Furthermore, the result obtained by the final
system highly improves the results obtained by a
random classification (around a 90% of error rate).
As future work we have planned to study other
classifiers like, for example, fuzzy-neural networks.
Also, we do not discard the inclusion and analysis of
other features that could improve the classification.
ACKNOWLEDGEMENTS
This work has been supported in part by the Spanish
Government under Grant TIN2005-08818-C04-03.
REFERENCES
Chow, C.K., Kaneko, T., 1972. Automatic Boundary
Detection of Left Ventricle from Cineangiograms. In
Comput. Biomed. Res., vol. 5, pp 338-410.
CorkQC, The Natural Cork Quality Council, 2006.
Industry Statistics. At http://www.corkqc.com.
Fisher, R., Perkins, S., Walker, A., Wolfart, E., 2004.
HIPR2: Image Processing Learning Resources. At
http://homepages.inf.ed.ac.uk/rbf/HIPR2.
Fortes, M.A., 1993. Cork and Corks. In European Rev.,
vol. 1, pp 189-195.
Haralick, R.M., Shanmugam, K., Dinstein, I., 1973.
Textural Features for Image Classification. In IEEE
Trans. Systems Man Cybernet., vol. 3, pp 610-621.
ICMC, Instituto del Corcho, Madera y Carbón Vegetal,
2006. Instituto de Promoción del Corcho (ICMC-
IPROCOR). At http://www.iprocor.org, Spain.
Johannsen, G., Bille, J., 1982. A Thresholding Selection
Method Using Information Measures. In Proc. 6
th
International Conference on Pattern Recognition,
Munich, Germany, pp 140-143.
Kapur, J.N., Sahoo, P.K., Wong, A.K.C., 1985. A New
Method for Gray-Level Picture Thresholding Using
the Entropy of the Histogram. In Computer Vision,
Graphics and Image Processing, vol. 29, pp 273-285.
Otsu, N., 1978. A Threshold Selection Method from Gray-
Level Histogram. In IEEE Trans. Systems Man
Cybernet., SMC-8, pp 62-66.
Pun, T., 1980. A New Method for Gray-Level Picture
Thresholding Using the Entropy of the Histogram. In
Signal Process., vol. 2, pp 223-237.
Pun, T., 1981. Entropic Thresholding: A New Approach.
In Computer Vision, Graphics and Image Processing,
vol. 16, pp 210-239.
Rosenfeld, A., De la Torre, P., 1983. Histogram Concavity
Analysis as an Aid in Threshold Selection. In IEEE
Trans. Systems Man Cybernet., SMC-13, pp 231-235.
Sahoo, P.K., Soltani, S., Wong, A.K.C., 1988. A Survey of
Thresholding Techniques. In Computer Vision,
Graphics, and Image Processing, vol. 41, pp 233-260.
Shah, S.K., Gandhi, V., 2004. Image Classification Based
on Textural Features Using Artificial Neural Network
(ANN). In IE(I) Journal-ET, vol. 84, pp 72-77.
Shapiro, L.G., Stockman, G.C., 2001. Computer Vision.
Ed. Prentice Hall, New Jersey.
Sonka, M., Hlavac, V., Boyle, R., 1998. Image
Processing, Analysis and Machine Vision. Ed. PWS
Publishing, USA, 2
nd
edition.
Tsai, W., 1985. Moment-Preserving Thresholding: A New
Approach. In Computer Vision, Graphics and Image
Processing, vol. 29, pp 377-393.
A SOLUTION FOR EVALUATING THE STOPPER QUALITY IN THE CORK INDUSTRY
339
