
SMART WIRELESS TIPPING-BUCKET RAIN GAUGE
Measurement and Automatic Dynamic Calibration
Octavian Postolache, Miguel Dias Pereira
EST Setúbal LabIM/IPS, Rua do Vale de Chaves, Estefanilha, 2914-508, Setúbal, Portugal
Instituto de Telecomunicações, Av. Rovisco Pais, 1049-001, Lisboa, Portugal
Pedro Girão
Instituto de Telecomunicações, Av. Rovisco Pais, 1049-001, Lisboa, Portugal
Keywords: Weather smart sensors, automatic system calibration, wireless communication, neural network.
Abstract: The paper presents the design and implementation of a smart tipping-bucket rain gauge that uses a universal
frequency do digital converter characterised by period and impulse counting measuring capabilities with on-
line accuracy control and a serial interface connected to a transmitter-receiver RF module that provides a
wireless communication between the smart tipping-bucket rain gauge (TBR) and a host unit expressed by a
FieldPoint real-time controller or a laptop PC associated with a weather monitoring network The TBR
sensor tests in dynamic conditions are performed using a FieldPoint based system. The system consist in a
submersible pump that works under the FieldPoint control and assure the accurate control of water flow
rates delivered to the rain gauge funnel. The rain gauge calibration ensures precise conversion of bucket tip
times to actual rainfall rates. The data acquired during the calibration is stored in FieldPoint system memory
and used for an accurate rain fall measurement after an intelligent data processing based on designed and
implemented neural network. Data logging and data communication are parts of the LabVIEW real time
software developed for the present system.
1 INTRODUCTION
The measurement of the rain fall represents an
important task associated with weather stations and
environmental surveying stations. Different types of
sensors are used to measure the quantity of rain
water falling in time (Advanced Measurements,
2003). Tipping-bucket rain gauges (TBRs) have
been used extensively for collecting rainfall intensity
data ever since their inception and subsequent use in
weather station starting form 1970 because they are
simple and durable. Other advantages are that they
can be installed in remote areas, can be connected to
a variety of monitoring or recording devices, and are
relatively inexpensive. Disadvantages are that
measurement errors can be significant during heavy
rainfall or light drizzle, losses from evaporation and
wind effects can occur, and calibration is often
difficult and time consuming (Nemec, 1967).
Referring to the calibration the TBR static and
dynamic calibration methods it can be mentioned.
In the static calibration method, the rain gauge is
levelled, and the stop under a bucket is adjusted until
application of a specified volume of water (usually
added to the bucket drop by drop using a pipette)
causes the bucket to tip. This procedure is repeated
several times for each bucket, and an average
volume for both buckets is calculated. Measured
bucket volumes can vary as much as 5% depending
on factors such as the kind of water used (rainwater
versus tap water), the buckets dry or wet initially
state and the buckets surface quality (Marselek,
1981). An important weakness of the static
calibration method is related to the assumption that
the volume of water needed to cause the bucket to
tip is independent of the rainfall intensity which can
conduct to underestimation of the rainfall intensity
(10 to 40%).
Dynamic calibration methods attempt to account for
undercatchment by calibrating the TBR while the
buckets are in motion and have been proven to be
effective. Different dynamic calibration and system
are reported in the literature (Humphrey, 1997). All
of the preceding methods describing dynamic
calibration of TBRs involve application of many
205
Postolache O., Dias Pereira M. and Girão P. (2006).
SMART WIRELESS TIPPING-BUCKET RAIN GAUGE - Measurement and Automatic Dynamic Calibration.
In Proceedings of the Third International Conference on Informatics in Control, Automation and Robotics, pages 205-209
DOI: 10.5220/0001221002050209
Copyright
c
SciTePress

flow rates and quantifying the response time of the
tipping bucket.
In this conditions a controller water pump and
accurate measurement of time periods associated
with bucket movements during the rainfall
measurement is required.
The article presents a smart wireless tipping-
bucket rain gauge where the TBR is connected to the
counter/period input of a universal frequency digital
converter. An additional frequency measurement
channel is used to acquire the information delivered
by a temperature sensor associated with rainwater
temperature measurement and frost conditions. The
acquired information is wireless transmitted using a
RF receiver-transmitter component to a host real-
time controller that performs tasks such as the TBR
tests and calibration control, data logging, fault
detection and diagnosis, data communication and
data publishing.
2 SMART SENSING SYSTEM
2.1 Rainfall and Temperature
Sensing Unit
The rainfall sensor is represented by a classical
architecture of tipping bucket rain gauge whose
resolution is defined by:
2
4
d
V
r
⋅
=
π
(1)
where V is the bucket volume, and d is the rain
gauge diameter (of the outer funnel). It extracts the
rainfall information based by the water running
through the collectors funnel into one of the system
twin buckets. When the water flows from one to
other bucket based on the included magnetic reed
switch (low cost proximity sensor) a voltage pulse is
generated. Counting the pulses, N
RW
for 1h time
period the total amount of rainwater can be
calculated using the following relation:
rNhq
RWRW
⋅
=
)1( (2)
which express the rainfall intensity level expressed
in mm h
-1
.
The used temperature transducer is based on a LM35
and conditioning circuits expressed by a voltage
amplifier and voltage to frequency conversion stage
(LM331). The nominal dependence of the frequency
output versus temperature is given by:
TAf
TT
⋅⋅
⋅
=
δ
α
(3)
where T represents the temperature in ºC,
T
α
=0.01V/°C the temperature-to-voltage
conversion coefficient, A=10 the gain of the used
amplifier, and δ=980V
-1
s
-1
the voltage to frequency
converter internal parameter. Thus for the
temperature included in the 2-20°C range the
frequency signal will varies between 196 Hz and
1960 Hz.
2.2 Muti-channel Data Acquisition
and Wireless Communication
Unit
The signals associated to the rainfall and the
temperature measurement channels expressed by
voltage pulse and frequency variation are acquired
by the multichannel universal frequency to digital
converter (UFDC-01)(Pereira, 2005). It contains two
input channel that are on-line configured to perform
frequency, period or pulse counter measurement
functions. The measurement values are sent through
the wireless connection to the FieldPoint real-time
controller (National Instruments, 2005) or to a host
computer (PC). Referring the UFDC settings the
channel 1 is used for rainfall intensity measurement
based on TBR and set for pulse counter mode (MD)
while the channel 2 is used for temperature
measurement and set for frequency measurement
mode (M0).
Main characteristics of the UFDC include
programmable conversion accuracy than can vary
between 1 % and 0.001 % of FS (full-scale)
amplitude, an auto-calibration capability based on
the 8 MHz quartz crystal oscillator signal and a
RS232 communication port that is connected to the a
wireless interface expressed by a easy Radio
ER400TRS.
The ER400TRS is a complete sub-system that
combines a high performance very low power RF
transceiver, a microcontroller and a voltage regulator
(LPRS,2006). Several characteristics can be
mentioned: RF frequency 434MHz, RF power
output +10dBm, FM deviation 64kHz.
In the present application the RF module Serial Data
Input and Serial Data Output channels operate at the
standard 9600 Baud and the RDY handshake line is
connected to GND. The Easy-Radio transceiver can
accept and transmit up to 180 bytes of data, which it
buffers internally before transmitting in an efficient
over-air code format. Thus the digital values
associated with the number of pulses value (N
RW
)
that corresponds to UFDC channel 1 or the
frequency value (f
T
)
corresponding to the UFDC
ICINCO 2006 - SIGNAL PROCESSING, SYSTEMS MODELING AND CONTROL
206
channel 2 are transmitted using the TXD line of the
UART port to the serial data input line (SDI) of the
ER1. Based on the low power RF connection the
data is sent to the ER2.(Figure 1).
The ER2 will decode the message and place the
recovered data within a receive buffer that can then
be unloaded to the receiving host (FieldPoint
controller or host PC) for data processing.
Transmission and reception are bi-directional half
duplex i.e. transmit or receive but not
simultaneously.
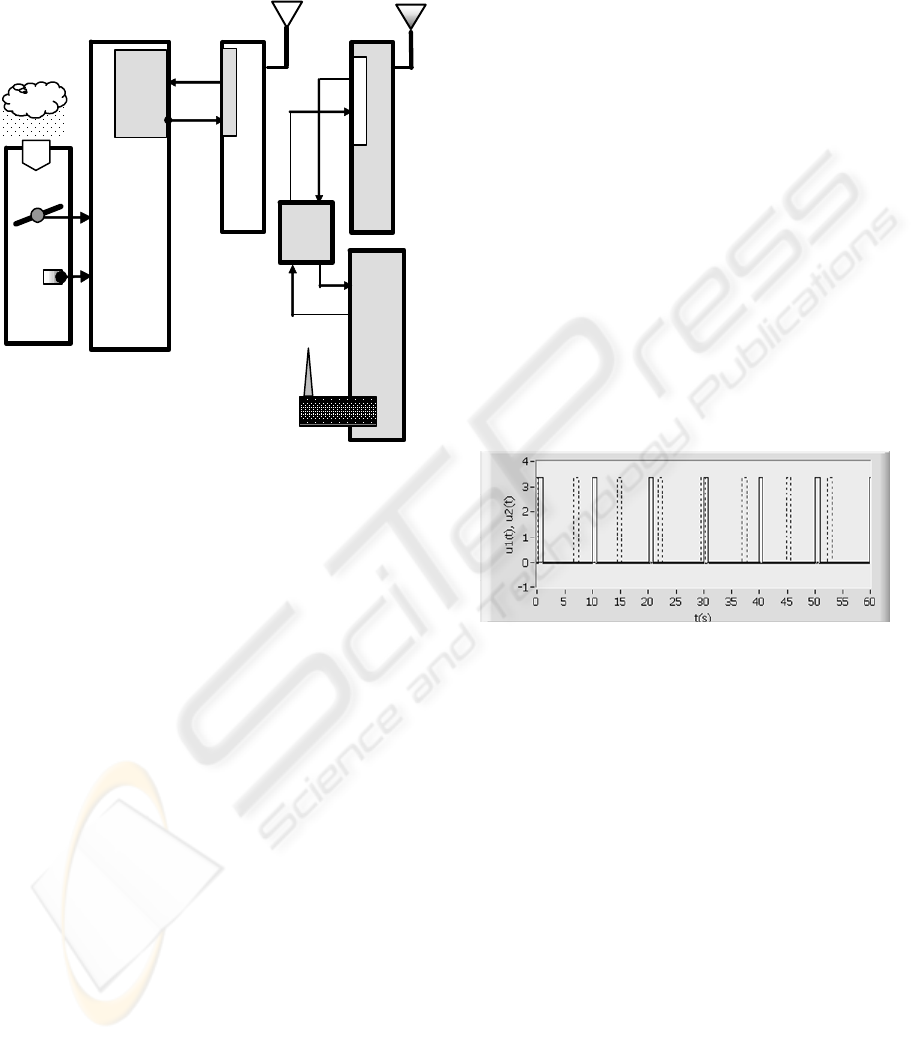
Fig. 1 represents the main elements of the rainfall
and temperature system with low power wireless
transmission capabilities where ER1 and ER2
represents the RF wireless transmission modules,
FX1 and FX2 the UFDC pulse counter and
frequency acquisition channels, MAX233 interface
chip performs the 0-5V (ER400TRS) to the RS232
voltage levels translation, SDO-serial data output,
SDI serial data input and the E/Wi-Fi b represents
the Ethernet-wireless bridge connected to the
Ethernet port of the FieldPoint FP2000 real time
controller. Based on implemented wireless
communication systems the FP-2000 can work
simultaneously in two wireless networks. The first
one expressed by one or multiple smart rainfall
measurement system or other weather sensors with
RF low cost wireless interfaces and the second one
(Wi-Fi - EE802.11g) that can include different PCs
associated with advanced data processing and
publishing.
2.3 TBR Dynamic Calibrator
In order to increase the accuracy of rainfall
measurements a TBR automated calibrator was
designed and implemented.
The calibration system consists of a FieldPoint
system, voltage controlled submersible pump and a
water reservoir.
The FieldPoint system is represented by NI FP-
2000 controller interface that manages a node
expressed by an analog output module NI FP-AO-
V10. The output voltage of the analog output
module is used to control the pump through a current
buffer (CI). In this way, different values of water
flow are automatically imposed to the measurement
system. The common values obtained in the present
application are between 20 and 1000 mL min
-1
, that
depends on the pump speed (through the imposed
voltage), tubing diameter and tubing composition.
The rain gauge to be calibrated (TBR) is connected
to the UFDC-FX1 input that detects tip occurrence
expressed by pulse signals (Figure 2) and count the
number of pulses.
The “brain” of calibrator (NI FP-2000) sent the start
count (S) and read count (R) commands associated
with Δt
c
time intervals (Δt
c
=1min). The read values
N
RW
are used to calculate the rainfall intensity.
The values of the rain flow intensity are imposed by
the pump of the system that is previously calibrated.
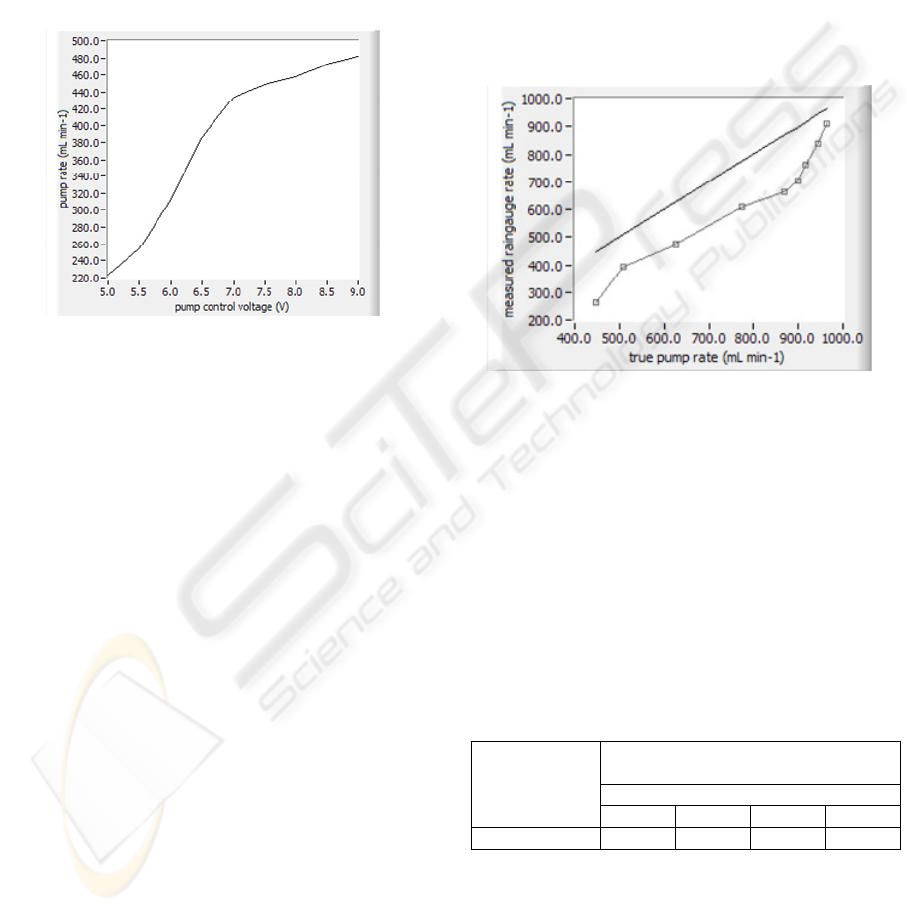
Pump calibration procedure extracts the water
volume versus pump control voltage characteristic.
Thus for different values of the pump control
voltage, V
c
=[5; 9]V, different pump rates are
obtained and used do deliver several water target
volumes (e.g. 500mL, 1000mL, 2000mL). When the
target volume for a given rate has been delivered to
the collection flask, an optical level sensor
(Honeywell), mounted on the flask, delivers a TTL
signal that is acquired by the digital input module of
the FieldPoint system, and the delivered time Δt
di
is
recorded together with the voltage value for the
current pump rate. Using a digital channel of the
Figure 2: The TBR’ magnetic reed switch output PR1(--)
and PR2(-.-) pump rates
TBR
UFDC
RXD
TXD
SDO
SDI
FX2
FX1
TS
ER2
SDO
SDI
FieldPoint
*FP-2000
Wi-Fi
E/Wi-Fi b
ER1
MAX
233
Figure 1: The block diagram rainfall& temperature smart
sensing system
Figure 1: The block diagram rainfall & temperature smart
sensing system.
Figure 2: The TBR’ magnetic reed switch output PR1(--)
and PR2(-.-) pump rates.
SMART WIRELESS TIPPING-BUCKET RAIN GAUGE - Measurement and Automatic Dynamic Calibration
207
FieldPoint digital output module and a conditioning
circuit the collection flask electro valve is opened
for a time interval of Δt
oi
=Δt
di
+τ
i
, where the timing
tolerance is expressed by τ defined as 10% of water
delivery time Δt
di.
After the Δt
oi
time interval the next pump rate is
imposed and a new Δt
d(i+1)
is recorded. For the
particular case of 1000mL water target volume the
pump rates (PR) are calculated using the stored t
di
values and are graphical represented in Figure 3.
Figure 3: Pump calibration results
All the pump calibrations were conducted within a
water temperature range between 15°C and 17°C.
Based on the pump rate characteristics, obtained in
the pump calibration phase, the rain gauge
calibration was perforned together with the TBR
calibration, in the dynamic conditions, for different
values of the pump rate (PR) associated to high level
of rainfall intensity (PR=[446; 963] [mL min
-1
].
Thus the pump was controlled for voltages in 5 V to
9V interval to inject water on the TBR level for
different time intervals equivalent for 1000mL
rainfall. During the Δt
oi
time intervals the UFDC
channel set as a counter was measured the number of
pulses delivered by TBR for each interval. The
results are presented in Figure 4.
2.4 Neural Network for Field Data
Correction
Considering the experimental values that express the
non-linear dependence of the measured rain-gauge
rate versus an imposed PR an intelligent TBR data
correction algorithm based on single input single
output (SISO) neural network [8] is designed in
M
ATLAB and implemented for on-line processing at
the FP-2000 level using LabVIEW real-time. The
input of NN is expressed by the normalized values
of measured raingauge rate while the output
represent the underestimating corrected values the
considered true rainfall interval. The raingauge rate
was previously calculated sing the number of pulses
measured by the UFDC and wireless transmitted
data.
3 RESULTS AND DISCUSSIONS
The experimental results obtained from TBR based
measurements in dynamic conditions are presented
in Figure 4.
Figure 4: Departure of measured rain gauge rate
(MRG) from true pump rate along 1:1 line (UL)
UL
MRG
The underestimation maximum level for considered
rainfall intensities was about 205 mL min
-1
which
requires the application of data correction using the
implemented NN.
Using designed MLP neural network characterized
by 2 to 5 hidden neurons with tansignoid activation
function the underestimation rainfall error decrease
according with the designed neural network
architecture (Table 1).
Table 1: Underestimation errors with and without
correction.
Underestimation error with NN based
correction(mL min
-1
)
Number of neurons
U error
without NN
corr.
(mL min
-1
)
2 3 4 5
205.5
14.7 9.1 9.2 12.1
Analyzing the Table 1 can be observed that good
results are obtained for 3 or 4 hidden neurons. For
the particular case of 3 hidden neuron neural
network the TBR rainfall intensity measurement
error, with correction (err
TBR+NN
) and without
correction (err
TBR
) underestimation error, with and
Figure 3: Pump calibration results.
Figure 4: Departure of measured rain gauge rate (MRG)
from true pump rate along 1:1 line (UL).
ICINCO 2006 - SIGNAL PROCESSING, SYSTEMS MODELING AND CONTROL
208
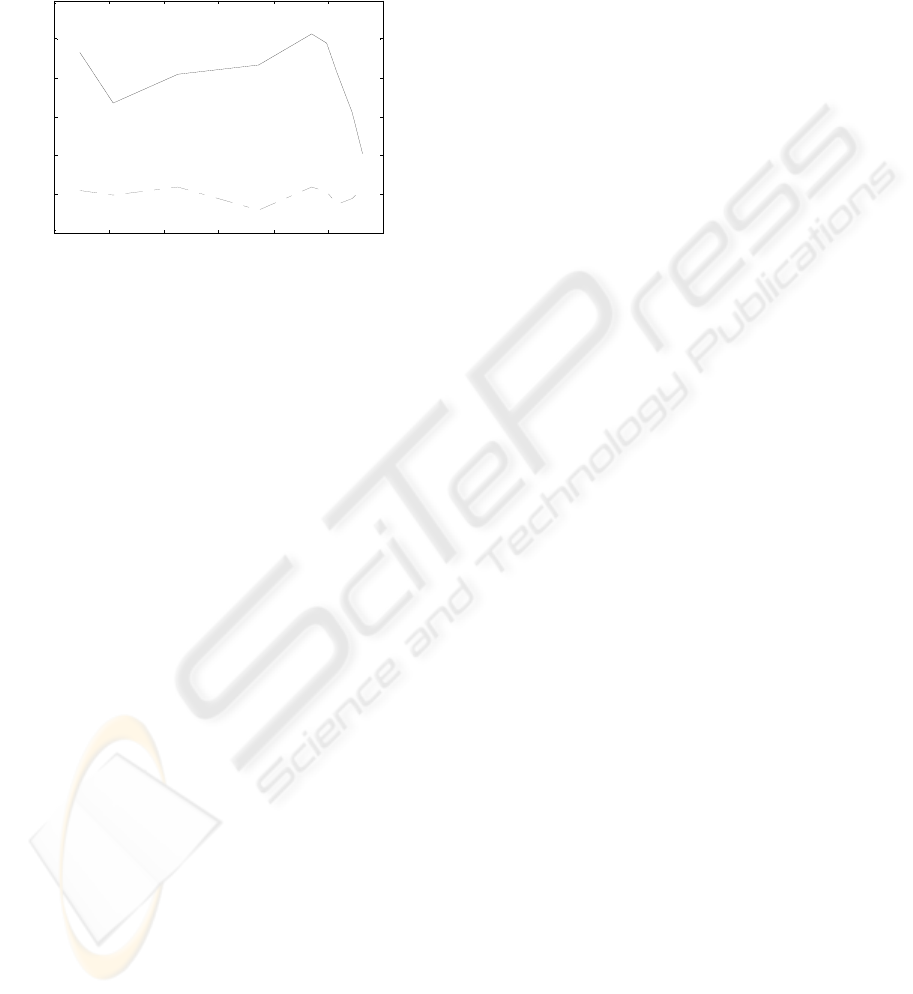
without compensation, associated with tested TBR
in dynamic conditions are presented in Section 3.
400 500 600 700 800 900 1000
-50
0
50
100
150
200
250
err
TBR
(mL min
-1
)
err
TBR+NN
(mL min
-1
)
true rainfall(mL min
-1
)
Figure 5: TBR measurement error with and without
correction based on neural network
4 CONCLUSIONS
A smart wireless tipping-bucket rain gauge was
designed and implemented. The proposed solution
combines the flexibility and the measurement
accuracy of the universal frequency to digital
converter with the low cost RF RS232-wireless
bridge in order to perform the weather parameter
monitoring in a wireless network.
Based on the fact that the tipping-bucket rain
gauges suffer from serious non-linear
underestimation errors, especially when rainfall is
characterized by high rates, a real-time system based
on FieldPoint technology for TBR test and
calibration was designed and implemented. Using
the experimental data associated with high rainfall
rates an intelligent algorithm based on Multilayer
Perceptron architecture was designed in order to
decrease the TBR underestimation errors. Several
simulation and experimental results express the
capabilities of the implemented solution.
REFERENCES
Advanced Measurements & Controls, “Weather:
Raingauge”, 2003 on-line at http://www.advmnc.com/
Nemec J., Instruments Methods of observation and
processing of basic data on precipitation and
evaporation, Ed. World Meteorological Organization,
1967
Marselek J. Calibration of the tipping-bucket raingauge,
Journal of Hydrol, Bol. 53, 343-354, 1981
Humphrey M, Istok, J. “A new Method for Automated
Dynamic Calibration of Tipping-Bucket Rain Gauges”
Journal of atmospheric and oceanic technology, VOL
14, pp. 1513-1519. 1997
Dias Pereira, J. M., Postolache O., Girão P. " Using a
Dual-Channel FDC Device and ANN Techniques to
Improve Measurements Accuracy ", Sensors &
Transducers Magazine , Vol. 62 , No. 12 , pp. 462 -
472 , December , 2005
National Instruments, “ FieldPoint and Compact
FieldPoint”, 2004, on-line at www.ni,com
LPRS, “Radio modules with embedded software
interface” on-line at http://www.lprs.co.uk/, 2006
Figure 5: TBR measurement error with and without
correction based on neural network.
SMART WIRELESS TIPPING-BUCKET RAIN GAUGE - Measurement and Automatic Dynamic Calibration
209
