
Automated Recognition of Human Movement States
using Body Acceleration Signals
Md. Rafiul Hassan
1
, Rezaul K. Begg
2
, Ahsan H. Khandoker
3
and Robert Stokes
2
1
Department of Computer Science and Software Engineering
The Unversity of Melbourne, VIC 3010, Australia.
2
CARES, Victoria University, Melbourne 8001, Australia.
3
Department of Electrical Engineering
The University of Melbourne, VIC 3010, Australia.
Abstract. Automated recognition of human activity states has many advan-
tages, e.g., applications in the smart home environment for the monitoring of
physical activity levels, detection of accidental falls in the older adults in the
home environment or assessment of the recovery phase of patients living inde-
pendently at home. In this paper, we describe an accelerometer-based system to
recognize three activity states, e.g., steady state gait or walking, sitting and
simulated sudden accidental falls. The recorded 3D movement accelerations of
the trunk were processed using wavelets, and the features were extracted for
recognition of movement states through the use of a fuzzy inference system.
The system was trained and tested using 58 different data segments represent-
ing the three states. Cross-validation test results indicated an overall recognition
accuracy by the machine classifier to be 89.7% with an ROC area of 0.83. The
results suggest good potential for the system to be applied for various situations
involving activity monitoring as well as gait and posture recognition. Further
tests are required using various population groups.
1 Introduction
Falls in older people during locomotion is a major public health issue, as it leads to
injuries, hospitalization and a significant cost to the community. In Australia, falls
related injury costs have been estimated to be A$2.4 billions per annum [1]. Re-
searchers around the globe are investigating this subject using various techniques.
One methodology involves gait analysis in a laboratory environment to identify the
significant changes in gait that occur due to ageing. Some of these changes may be
important in the understanding of why people fall and this information may also help
us to devise techniques for the prevention of falls. Automated monitoring of gait and
posture of an individual within the home environment has recently received signifi-
cant attention. The main advantage of such monitoring is to identify people at risk of
falls and also to assess their overall well-being. For example, such technique could be
used for checking the healthy life style of patients recovering at home or to monitor
the health risk of an older person living independently at home. In order for a system
to be effective in such applications, the system has to be robust enough to differenti-
Rafiul Hassan M., K. Begg R., H. Khandoker A. and Stokes R. (2006).
Automated Recognition of Human Movement States using Body Acceleration Signals.
In Proceedings of the 2nd International Workshop on Biosignal Processing and Classification, pages 135-143
DOI: 10.5220/0001225601350143
Copyright
c
SciTePress
ate between the various events and activities such as walking, sitting, resting, or acci-
dental falls. In this paper, we attempt to develop an automated system that could be
applied to distinguish such sequences of events.
In the past, a number of studies have used accelerometer technology to automate the
monitoring of daily activities of humans such as walking, sitting, standing, climbing
stairs, walking velocity, etc, classified and recognized by analyzing the various fre-
quency components of the acceleration signals [2-3]. To acquire the useful knowl-
edge from the raw dataset, wavelet analysis was extensively used in some of studies
[4-6].
To automate recognition of activities from either pre-processed raw data, various
techniques and classifiers have been proposed in several studies, such as Fractal esti-
mation [4], Neural Networks [3,7]. However, these techniques have their own merits
and limitations, which depend on the dataset. In our previous work [8], we have suc-
cessfully applied fuzzy rules to recognize gait changes due to trip-related falls in a
laboratory environment. In this study, we apply fuzzy classifier to recognize the daily
activities in a home environment.
2 Methods
In this study, data were collected from a simulated home environment. A triaxial
accelerometer unit (giving acceleration information in horizontal, vertical and lateral
positions) was placed on a subject’s body to collect movement data. Acceleration data
were pre-processed using wavelet technique and classified using a set of fuzzy rules.
2.1 Description of the System
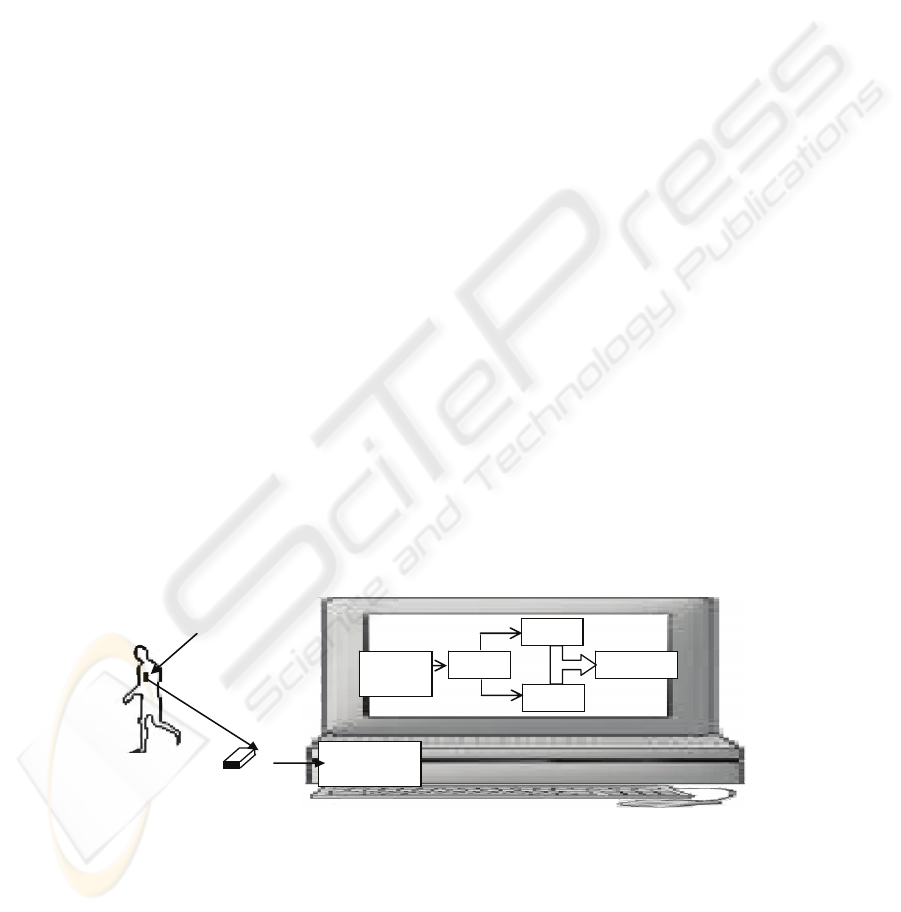
A schematic diagram of the experimental setup is shown in Figure 1. This measure-
ment system consisted of a Crossbow ±4G triaxial accelerometer unit, a National
Instruments 6013 16-bit PCI analog to digital converter interface card, a Labview 7.0
data acquisition program [http://www.ni.com/labview/] and a personal computer. The
accelerometer unit was attached to the upper body (trunk) of the subject.
Fig. 1. Activity recognition of individuals in a smart home.
Tri-axial Accelerometer
Breakout
Box
Labview
Data
Acquisition
Feature
Extraction
Fuzzy
Classifier
Frequency
Threshold
Activity
Reco
g
nition
NI 6013
Data
Acquisition Card
136

A breakout board was used to connect the accelerometer with the analog to digital
converter card such that data could be acquired by the computer. The physical data
was digitized using the 16-bit analogue-to-digital (A/D) converter and the LabView
program captured and recorded the data signal onto the PC harddrive. In this study,
data were collected and digitized at 100 Hz (100 bits/sec) sampling rate.
The experiments were set up in a room of size 3.5m by 3.5m Various items of furni-
ture (chairs, tables, etc) were arranged to mimic an actual home environment. For the
purpose of data collection, each subject entered into the room through the only door
of the room and walked to the chair, sat on the chair, typed something using the PC
keyboard, sometimes suddenly fell (simulated falling) onto the ground and conse-
quently stood up. The experiments were performed on healthy subjects with no
known gait problems.
2.2 Feature Extraction
2.2.1 Wavelets and Transformations
Wavelet functions as defined by [15], are constructed from translations and dilations
of a single function called the “mother wavelet”
)(t
ψ
.
,
1
)(
,
⎟
⎠
⎞
⎜
⎝
⎛
−
=
a
bt
a
t
ba
ψ
ψ
0,,
≠
ℜ
∈
aba
(1)
where, the scaling parameter ‘a’ represents the degree of compression (its value is
linked to the frequency of the wavelet), and the translation parameter ‘b’ represents
time location of the wavelet. Higher wavelet frequencies are indicated using ‘a’ <1,
whereas lower frequencies are represented when ‘a’>1.
A discrete wavelet transformation of a signal
)(xf can be represented using the
following equations
∫
= dxxxfka
kJ
j
)()()(
,
2
φ
(2)
∫
= dxxxfkd
kj
j
)()()(
*
,
2
ψ
(3)
∑∑∑
=
+=
k
J
jk
kjkJ
xkdxkaxf
jJ
1
,
2
,
2
)()()()()(
ψφ
(4)
In equations (2),(3) and (4), ‘j’ stands for the dilation index, ‘k’ represents the index
in time, ‘J’ is the depth of the decomposition level and ‘*’ symbolizes complex con-
jugation [4]. The scaling function coefficient
φ
gives the average value of the signal
over the given interval, which is used to calculate the approximation coefficients. The
details coefficients obtained using equation 3 keeps the high frequency information
while the approximation coefficients in each level contain the low frequency informa-
tion.
137

The details coefficients were used in this study to obtain the frequency of a signal in
a specific time period. To detect the frequency of a function representing a fixed
length signal (length of signal was selected to be 1 second in this research), a wavelet
decomposition followed by a translation of scale to frequency was computed. First,
the signal was decomposed using wavelets of up to ‘n’ labels and then the energy of
the details coefficients for each of the levels was obtained. The scale value (
m
a )
related to the maximum energy from the set of energy values was then taken into
consideration to dig out the original frequency of the signal. Next step was to find out
the frequency of a wavelet for the corresponding scale.
2.2.2 Translation from Scale to Frequency
As the frequencies in a signal predominate the scales chosen in wavelet decomposi-
tion, by analyzing the relationships between the scale and frequency the pseudo-
frequency of the signal can be obtained. Following the methodology outlined in [16],
the pseudo-frequency of a wavelet corresponding to a scale was computed. In doing
so, first the center frequency F
c
of the wavelet was computed by the following equa-
tion [10]:
Δ
=
.a
F
F
c
a
where,
a = scale, Δ = sampling period,
c
F = center frequency of the wavelet in Hz.
a
F = pseudo-frequency corresponding to the scale a in Hz.
(5)
Using this method, the frequency calculated at scale ‘
m
a ’ became the pseudo-
frequency of the signal. The next step in the recognition system was the inclusion of
the fuzzy classifier for the identification of different activities (e.g., walking, sitting or
simulated falls) of the subjects using the calculated frequency information of the
acquired signals.
2.3 Fuzzy Classifier
Fuzzy logic provides a framework for modeling uncertainty, human way of thinking,
reasoning and the perception process, and has been found to be very useful in ex-
pressing the nonlinear relationships among the inputs and outputs [11-13]. Condi-
tional statements such as ‘if-then’ are the linguistic representation of fuzzy rules.
Recently, we have applied fuzzy rules to classify gait patterns of healthy adults and
adults with balance problems and the gait classification accuracy was found to be
over 89% [8]. Here, we propose to apply fuzzy rules to classify movement states
using features translated into the various wavelet coefficients.
With our present study, we don’t have any prior knowledge about the rules relating
to the subject’s movement data. So defining rules for these dataset is a problem. How-
ever, there are techniques to identify a reasonable number of rules from a given data-
138
set in order to establish a fuzzy system. For example, Chiu [14] has developed a tech-
nique based on subtractive clustering to extract rules. This technique has been tested
in gait pattern classification for rule generation [8], and was also applied in this re-
search .
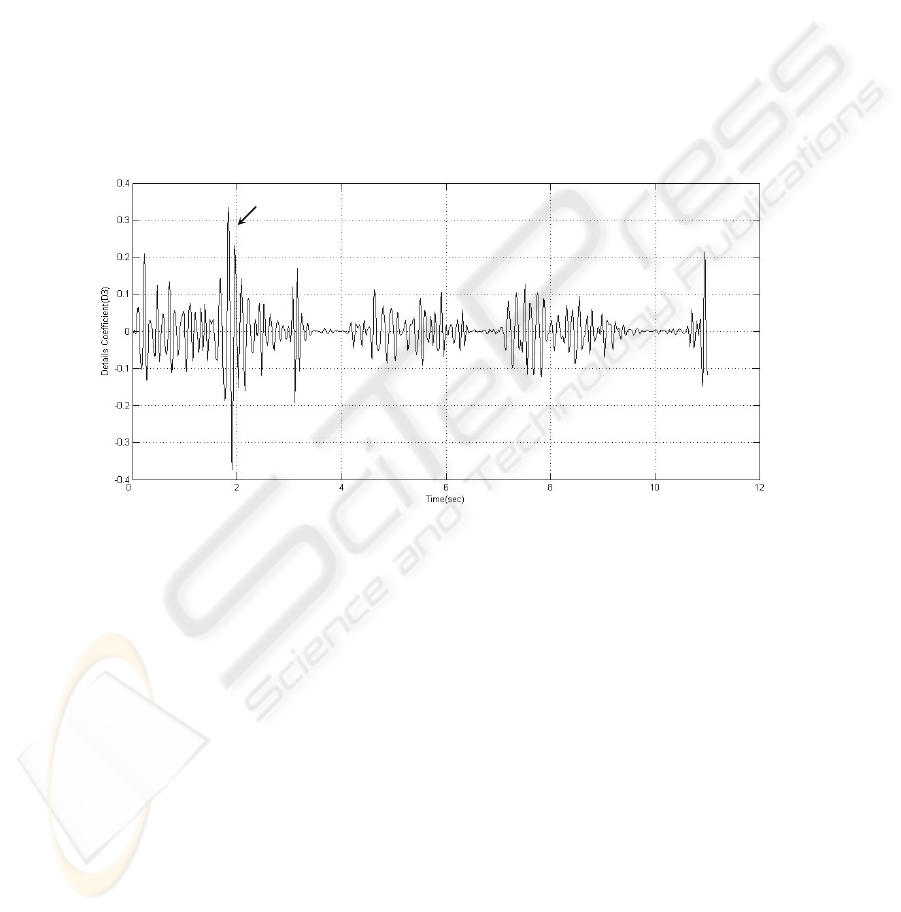
2.4 Simulated falls event detection
In order to detect the occurrence of sudden/accidental falls, a signal of a fixed time
interval (1 second) was considered. During such events, the movement frequency is
expected to be momentarily high. To identify whether there was any instantaneous
increase in frequency, the details coefficient
coeff
D
values for the signal were ana-
lyzed. As the wavelet transformation provides both the frequency and time informa-
tion, any sudden increase in frequency can be monitored by studying the details coef-
ficients.
Fig. 2. The details coefficient values at label 3 to detect simulated falls.
Figure 2 shows a plot of the details coefficient and illustrates an abrupt increase in its
magnitude during the falls event (~200ms). To automate the system’s falls identifica-
tion capability, a threshold
θ
was selected and the following threshold logic was
applied:
for i=1 to length(signal)
if
coeff
D >
θ
then
identify sudden fall
end if
end for
In this study, details coefficient at level 3 (D3) was found to be the most suitable for
the problem, especially in the vertical direction.
Falls
139
3 Results
We tested the proposed wavelet-fuzzy method using data related to the 60 state
changes (change from one state to another state). As mentioned above, three types of
body states were considered: sitting, walking and a sudden simulated fall on the
ground). A change in state might take place according to one of the following se-
quences:
Walking, Sitting, Walking….
Walking, Sudden fall, Standing up and Walking again….
Sitting, Walking…
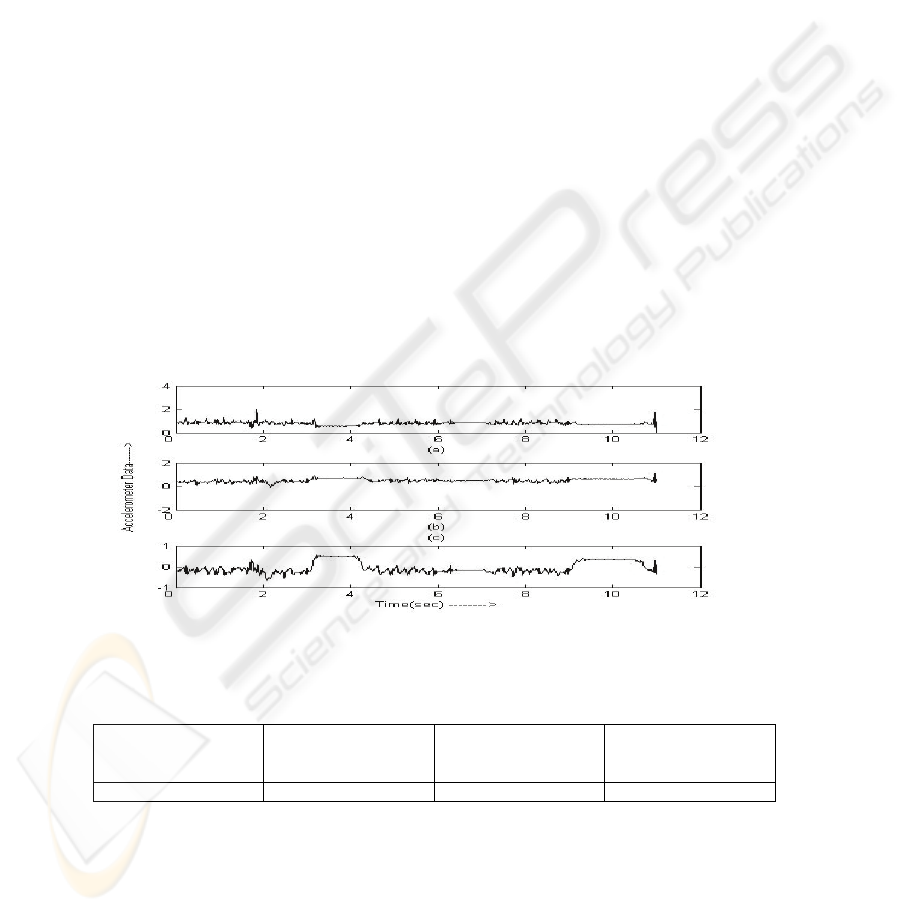
Figure 3(a-c) shows typical raw acceleration signal recorded during movement repre-
senting the various states in the horizontal anterior-posterior, medio-lateral and verti-
cal axes respectively. Figure 4 plots the computed detailed coefficients using equation
(3) for a mother coifflet wavelet (at levels 1 to 9) of the acceleration signal displayed
in figure 3(a).
For this data, ‘coifflet’ wavelet was found to be suitable for calculating the pseudo-
frequency of the acceleration signals as well as to identify the instantaneous increase
in the frequency. During walking task, the major frequency component was close to
4.0 Hz while that for the sitting posture on a chair or on the ground was found to be
~0.14 Hz. There were slight variations in the frequencies along the three axes as can
be seen in Figure 5. Therefore, information from more than one source is necessary
for correct recognition, and in this case, all three acceleration signals from the tri-
axial accelerometer were used for training and testing the fuzzy classifier.
Fig. 3. The collected signal using tri-axial accelerometer a) Horizontal anterior-posterior (a
x
),
b) Medio-lateral (a
y
) and c) vertical(a
z
) signals.
Table 1. Classification accuracy of the model (sitting and walking).
Total Activity
(Training & Test-
ing)
Accurate classifi-
cation
Classification ac-
curacy
ROC area
58 52 89.7% 0.83
Walk Falls Walk Sitting Walk Sitting Walk Sitting
140
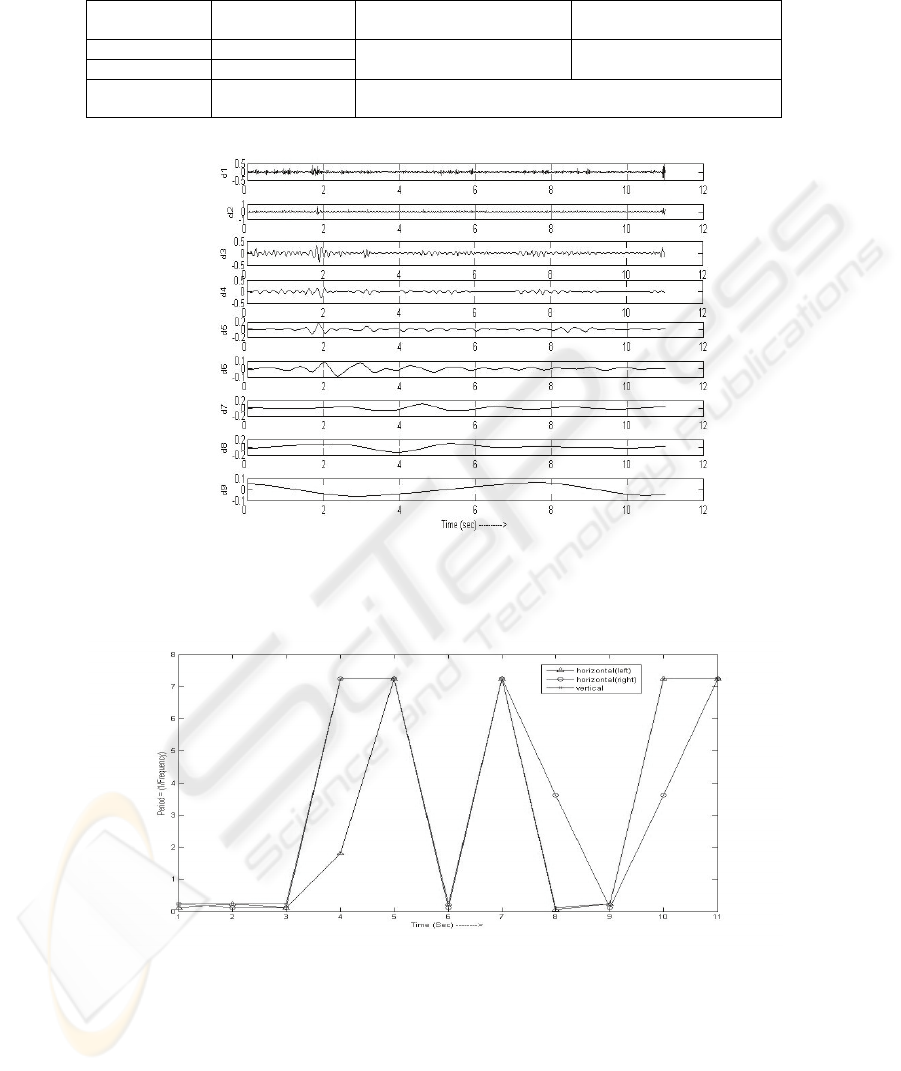
Table 2. Sensitivity and specificity of the model.
Activity Name Total activity Sensitivity
Specificity
Walking 26
Sitting 22
0.917 0.833
Simulated Falls 10 All the fall events were recognized correctly with 100% accu-
racy
Fig. 4. The details coefficients (d1 to d9) at levels 1-9 of the signal in figure 3(a).
Fig. 5. The frequencies of segmented signal (into 1 second each) of the raw signals presented
in figure 3.
Classifier’s performance was tested using a four-fold cross validation test. Table 1
illustrates the overall result suggesting an overall accuracy of 89.7% in differentiating
141
walking and sitting. This accuracy is also reflected in the ROC curves that recorded a
high area (0.83) (see Figure 6). However, the recognition accuracy for all the simu-
lated falls was found to be 100%.
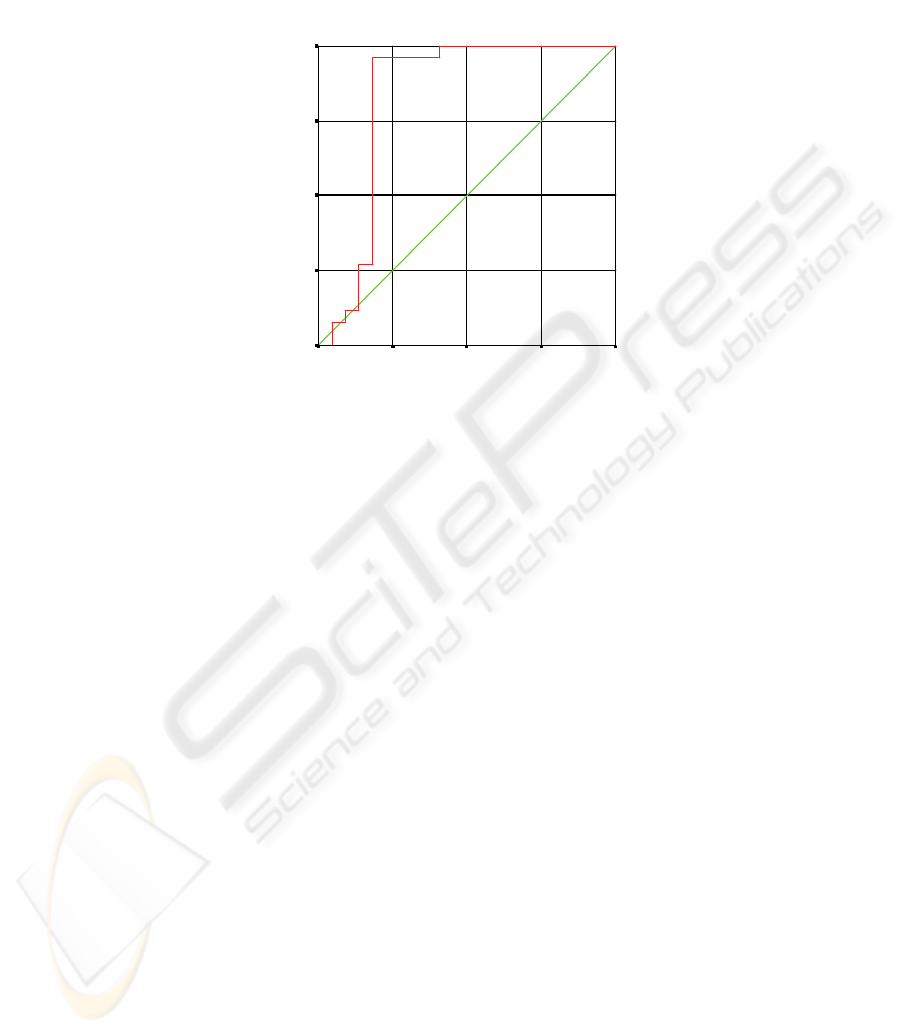
ROC Curve for movement recognition
1
-
Specificity
1.00.75.50.250.00
Sensitivity
1.00
.75
.50
.25
0.00
Fig. 6. ROC curve for identifying the two states: sitting and walking.
4 Discussions and Conclusion
Human movement behavior and the associated body positions change continually in
reaction to the demands of the environment in which we move. Accordingly, the
signal collected for a specific action of the subject was not the same all the time. It
might be a difficult task to recognize the subject’s current activity with only the ap-
plication of simple thresholds. Classifying different activities with the application of
sensor data on the same ground level (where the value of ’g’ is constant) makes the
problem more challenging. Most of the previous tasks related to activity identification
and classification dealt with movements in different levels (e.g., walking downstairs
i.e., ‘moving with g’ or walking upstairs i.e., ‘moving against g’) [4- 6]. In this study,
as the value of ‘g’ remained fixed throughout the experiment, movement task differ-
ences were reflected only in the acceleration frequencies (see figure 5).
It was observed that signals collected from only one axis could identify some of the
activities at times but not always. With the use of 3D accelerations the system was
found to identify and recognize the subject’s activities more robustly. Moreover,
being random in characteristics, fuzzy systems were found particularly suitable for
analyzing the in-depth information in the recorded signals. However, for detecting
accidental falls event, a threshold level detector might be suitable due to its sudden
increase in frequency level.
142

The benefits of the proposed model are: (1) the accelerometer can be attached to the
garments without the complicated setup procedures, (2) activities can be identified on
the same floor/level, (3) any accidental falls can be accurately identified.
This specific model could be applied in a smart home to monitor and discriminate
any discrepancy in subject’s behavior. In particular, this model could potentially help
older adults who are living independently in their homes. The usage of garments for
recording accelerometer signals, allows a non-intrusive monitoring technique of the
subject’s gait activities.
References
1. Fildes B. 1994. Injuries among older people. Melbourne: Collins Dove.
2. Fahrenberg, J., Foerster, F., Smeja, M., Muller, W. (1997), ”Assessment of posture and
motion by multichannel piezoresistive accelerometer recordings” , Psychophysiology. Vol :
34(5), pp. 607-612.
3. Mantyjarvi, J., Himberg, J., Seppanen, T. (2001), “Recognizing human motion with multi-
ple acceleration sensors”, Proceedings of IEEE international conference on Systems, Man
and Cybernetics, pp. 747-752.
4. Sekine, M., Tamura, T., Akay, M., Fujimoto, T., Togawa, T., and Fukui, Y.
(2002),”Discrimination of Walking Patterns Using Wavelet-Based Fractal Analysis”, IEEE
Transactions on Neural Systems and Rehabilitation Engineering, Vol : 10 (3), pp. 188-196.
5. Cho, S. Y., Park, C.G., and Jee, G.I., (2002),”Measurement system of walking distance
using low-cost accelerometers”, Proceedings of the 4
th
Asian Control Conference, pp.
1799-1803.
6. M. N. Nyan, Tay, F.E.H., Seah, K.H.W., Sitoh, Y.Y. (2005),”Classification of gait patterns
in the time-frequency domain”, Journal of Biomechanics, (In press).
7. Aminian, K., Robert, P., Jequier, E., and Schutz, Y. (1995), ”Estimation of Speed and
incline of walking using neural network”, IEEE Transaction on Instrumentation and Meas-
urement, Vol : 44(3), pp 743-746 .
8. Hassan, M.R., Begg, R., and Taylor, S. (2005), “Fuzzy Logic-based recognition of gait
changes due to trip-related falls”, Proceedings of the 2005 IEEE Annual Conference on
Engineering in Medicine and Biology(EMBS’05).
9. Debnath, L. (2001), Wavelet Transforms & Their Applications, Birkhäuser , Boston ,USA.
10. Misiti, M., Misiti, Y., Oppenheim, G., Poggi, J-M. (2005), Wavelet Toolbox User’s Guide-
For use with Matlab, The Mathworks Inc.
11. Meunier, B. B, Yager, R. R., and Zadeh, L. A. (Eds)(2000), Uncertainty in Intelligent and
Information Systems, World Scientific Publishing Company, Singapore.
12. Pedrycz, W. (1995) , Fuzzy Sets Engineering, CRC Press.
13. Zadeh, L. A. (1965), Fuzzy Sets, Information and Control, Vol : 8, pp. 338-353.
14. Chiu. S.L.(1997), Extracting Fuzzy Rules from Data for Function Approximation and
Pattern Classification, Chapter 9 in Fuzzy Information Engineering: A guided Tour of Ap-
plications (eds) D. Dubois, H. Prade, and R. Yager, John Wiley & Sons.
15. Morlet, J. , Aerens, G., Fourgeau, E., ans Giard, D. (1982) ,”Wave propagation and sam-
pling theory, Part I: Complex signal land scattering in multilayer media”, Journal of Geo-
physics, Vol : 47, pp. 203-221.
16. Abry, P. (1997), Ondelettes et turbulence. Multirésolutions,algorithmes de décomposition,
invariance d’échelles, Diderot Editeur, Paris.
143
