
MINING OF COMPLEX OBJECTS VIA DESCRIPTION
CLUSTERING
Alejandro Garc
´
ıa L
´
opez
European Laboratory for Nuclear Research (CERN)
Geneva (Switzerland)
Rafael Berlanga
Depto. de Lenguajes y Sistemas Inform
´
aticos. Universitat Jaume I
Castell
´
on (Espa
˜
na)
Roxana Danger
Depto. de Lenguajes y Sistemas Inform
´
aticos. Universitat Jaume I
Castell
´
on (Espa
˜
na)
Keywords:
Complex objects, association rules, clustering, data mining.
Abstract:
In this work we present a formal framework for mining complex objects, being those characterised by a set of
heterogeneous attributes and their corresponding values. First we will do an introduction of the various Data
Mining techniques available in the literature to extract association rules. We will as well show some of the
drawbacks of these techniques and how our proposed solution is going to tackle them. Then we will show how
applying a clustering algorithm as a pre-processing step on the data allow us to find groups of attributes and
objects that will provide us with a richer starting point for the Data Mining process. Then we will define the
formal framework, its decision functions and its interesting measurement rules, as well as a newly designed
Data Mining algorithms specifically tuned for our objectives. We will also show the type of knowledge to be
extracted in the form of a set of association rules. Finally we will state our conclusions and propose the future
work.
1 INTRODUCTION
The problem of mining complex objects, as we under-
stand it, is that of extracting useful information out of
multidimensional heterogeneous data. To fully com-
prehend this concept we need therefore to define what
we mean by extracting useful information and multi-
dimensional heterogeneous data.
When we talk about multidimensional heteroge-
neous data, we are referring to collections of at-
tributes of different types (boolean, categorical, nu-
merical, etc.) which are represented in an structured
way. This structured representation would normally
be based on a relational schema, although we could
also think of, for example, a collection of XML doc-
uments.
On the other hand, what we mean by extracting
useful information is mainly the discovering of fre-
quent and approximate underlying patterns (Associa-
tion Rules, ARs), which can help users to undertake
a number of decision taking tasks. Examples of these
are: summarizing a data collection, finding interesting
relations amongst its attributes, finding certain trends,
etc.
This kind of association rules can be applied to a
wide range of applications. Our main motivating ap-
plication consists of mining large log repositories that
contain data about the performance of a GRID in-
frastructure for ALICE experiments at CERN. Stored
data records include heterogeneous attributes involv-
ing different data types (e.g. location of a node, av-
erage serving time, number of processes, etc.) In
this context, users can be interested on finding fre-
quent patterns amongst these attribtues in order to
plan properly the distribution of tasks over the GRID.
The definition of ARs was first stated in (Agrawal
et al., 1993), referring to binary attributes. Basically
it is defined as follows. Let I = I
1
, I
2
, ..., I
m
be a set
of binary attributes, called items. Let T be a database
of transactions. Each transaction t is represented as
a binary vector, with t[k] = 1 if t bought the item
I
k
, and t[k] = 0 otherwise. Let X be a set of some
187
García López A., Berlanga R. and Danger R. (2006).
MINING OF COMPLEX OBJECTS VIA DESCRIPTION CLUSTERING.
In Proceedings of the First International Conference on Software and Data Technologies, pages 187-194
DOI: 10.5220/0001318401870194
Copyright
c
SciTePress

items in I. We say that a transaction t satisfies X
if for all items I
k
in X, t[k] = 1. An AR is then,
an implication of the form X ⇒ I
j
, where X is a
set of some items in I, and I
j
is a single item in I
that is not present in X. An example of this type of
rule is: ”90% of transactions that purchased bread and
butter also purchased milk”. The antecedent of this
rule consists of bread and butter and the consequent
consists of milk alone.
In (Srikant and Agrawal, 1996) where the con-
cept of Quantitative Association Rules (QARs) is first
shown, the authors deal with the fact that the vast ma-
jority of relational databases, either based on scien-
tific or business information are not filled with binary
datatypes (as requested by the classical ARs) but with
a much richer range of datatypes both numerical and
categorical.
A first approach to tackle this problem consists of
mapping the QARs problem into the boolean ARs
problem. The key idea is that if all attributes are cat-
egorical or the quantitative attributes have only a few
values, this mapping is straightforward. However, this
approach generates problems as if the intervals are too
large, some rules may not have the required minimum
confidence and if they are too small, some rules may
not have the required minimum support. We could
also think of the strategy of considering all possible
continuous ranges over the values of the quantitative
attribute to cover the partitioned intervals (to solve the
minimum confidence problem) and increase the num-
ber of intervals (solving the problem of minimum sup-
port). Unfortunately two new problems arise: First,
if a quantitative attribute has n values (or intervals),
there are on average O(n
2
) ranges that include a spe-
cific value or interval, fact that blows up the execution
time and second, if a value (or interval) of a quantita-
tive attribute has minimum support, so will any range
containing this value/interval, therefore, the number
of rules increases dramatically.
The approach taken by (Srikant and Agrawal,
1996) is different. Considering ranges over adjacent
values/intervals of quantitative attributes to avoid the
minimum support problem. To mitigate the problem
of the excess of execution time, they restricted the ex-
tent to which adjacent values/intervals may be com-
bined by introducing a user-specified maximum sup-
port parameter; they stop combining intervals if their
combined support exceeds this value. They introduce
as well a partial completeness measure in order to be
able to decide whether to partition a quantitative at-
tribute or not and how many partitions should there
be, in case it’s been decided to partition at all. To
address the problem of the appearance of too many
rules, they propose an interest measure based on the
deviation from the expectation that helps to prune
out the uninteresting rules (extension of the interest
measure already proposed in (Srikant and Agrawal,
1997)). Finally an algorithm to extract QARs is pre-
sented, sharing the same idea of the algorithm for
finding ARs over binary data given in (Agrawal and
Srikant, 1994) but adapting the implementation to the
computational details of how candidates are generated
and how their supports are now counted.
In (Miller and Yang, 1997), the authors pointed out
the pitfalls of the equi-depth method (interest measure
based on deviation), and presented several guiding
principles for quantitative attribute partitioning. They
apply clustering methods to determine sets of dense
values in a single attribute or over a set of attributes
that have to be treated as a whole. But although they
took distance among data into account, they did not
take the relations among other attributes into account
by clustering a quantitative attribute or a set of quan-
titative attributes alone. Based on this, (Tong et al.,
2005) improved the method to take into account the
relations amongst attributes.
Another improvement in the mining of quantitative
data is the inclusion of Fuzzy Sets to solve the sharp
boundary problem (Kuok et al., 1998). An element
belongs to a set category with a membership value,
but it can as well belong to the neighbouring ones.
In (Dong and Tjortjis, 2003) a mixed approach
based on the quantitative approach introduced by
(Srikant and Agrawal, 1996), the hash-based tech-
nique from the Direct Hashing and Pruning (DHP) al-
gorithm (Park et al., 1995) and the methodology for
generating ARs from the apriori algorithm (Agrawal
and Srikant, 1994) was proposed. The experimental
results prove that this approach precisely reflects the
information hidden in the datasets, and on top of it, as
the dataset increases, it scales-up linearly in terms of
processing time and memory usage.
On the other hand, the work realised by Aumann et
al. in (Aumann and Lindell, 1999), proposes a new
definition for QARs. An example of this rule would
be: sex = female ⇒ W age : mean = $7.90 p/hr
(overall mean wage = $9.02). This form of QAR,
unlike others doesn’t require the discretisation of at-
tributes with real number domains as a pre-processing
step. Instead it uses the statistical theory and data-
driven algorithms to process the data and find regu-
larities that lead to the discovery of ARs. A step for-
ward in this kind of rules was given by (Okoniewski
et al., 2001). They provide variations of the algorithm
proposed in (Aumann and Lindell, 1999) enhancing
it by using heuristic strategies and advanced database
indexing. The whole methodology is completed with
the proposition of post-processing techniques with the
use of similarity and significance measures.
The motivation of this work is to tackle some of the
drawbacks of the previous techniques. Most of them
require the translation of the original database so that
each non-binary attribute can be regarded as a discrete
set of binary variables over which the existing data
ICSOFT 2006 - INTERNATIONAL CONFERENCE ON SOFTWARE AND DATA TECHNOLOGIES
188
mining algorithms can be applied to. This approach
can be sometimes unsatisfactory due to the follow-
ing reasons: the translated database can be larger than
the original one, the transformation of the quantita-
tive data could not correspond to the intended seman-
tics of the attributes. Moreover, current approaches do
not deal with heterogeneous attributes but define ad-
hoc solutions for particular data types (mainly numer-
ical ones). As a consequence, they do not provide a
common data mining framework where different rep-
resentations, interesting measures and value cluster-
ing techniques can be properly combined.
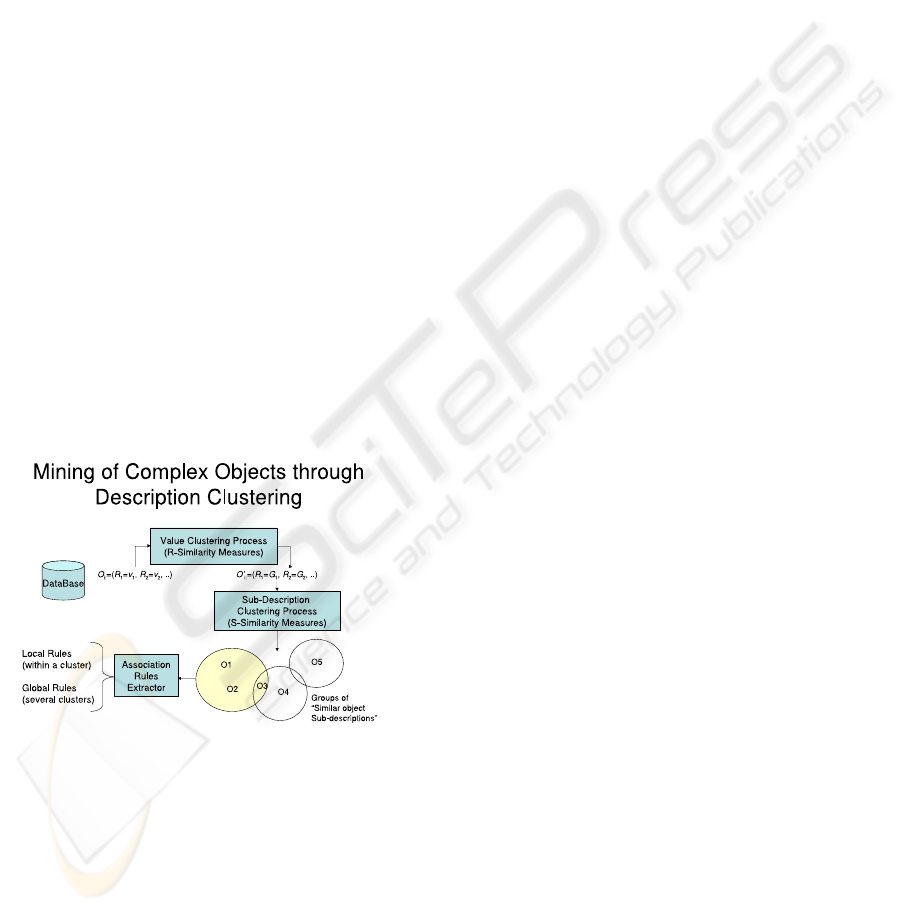
1.1 Overview of Our Proposal
In this article, we extend the work introduced in (Dan-
ger et al., 2004) by applying clustering techniques
in two steps of the mining process. A schematic
view of the overall process can be seen in Figure 1.
First, clustering is applied to the attribute domains,
so that each object can be expressed as a set of pairs
hattribute, clusteri instead of hattribute, valuei.
This new representation allows users to define the
most appropriate technique to discretize numeric do-
mains or to abstract categorical values. We name ob-
ject subdescription to the characterisation of an ob-
ject through value clusters. The second step consists
of clustering object subdescriptions in order to find
frequent patterns between their features.
Figure 1: Overview of our proposal.
Finally, we propose an algorithm capable of obtain-
ing the frequent itemsets from the found object sub-
description clusters. We distinguish two kind of ARs,
namely: inter and intra-cluster. The former relate at-
tributes of different clusters, whereas the latter relate
attributes locally defined in a cluster. Both kind of
ARs provide different levels of details to users, which
can mine a selected cluster involving a restricted set
of attributes (i.e. local analysis) or the whole set of
clusters (i.e. global analysis).
The paper is organised as follows: in the next sec-
tion, we introduce the necessary concepts of the pro-
posed framework. Then, in Section 3 we explain
how we include clustering in our mining process. In
Section 4 we describe a data-mining algorithm that
finds frequent object sub-descriptions, and in Section
5 we describe the preliminary experimental results.
Finally, in Section 6 we give our conclusions and we
outline the future work.
2 FORMAL DEFINITIONS
In the proposed framework, a data collection consists
of a set of objects, Ω = o
1
, o
2
, ..., o
n
, which are de-
scribed by a set of features R = R
1
, R
2
, ..., R
m
. We
will denote with D
i
the domain of the i-th feature,
which can be of any data type.
We will apply the clustering algorithm to the at-
tributes’ domains in order to find groups (clusters)
of close values and use them instead of the original
values. Thus each object will be no longer charac-
terised by it’s attributes’ values but by the clusters to
which these values belong. We will denote the set of
clusters in the domain (D
i
) of a given attribute i as
Π
i
= G
i,1
, ..., G
i,r
, being r ≥ 1 and G
i,r
the r-th
cluster in the domain of the i-th attribute.
On the other hand, we will apply a second cluster-
ing step to the object sub-descriptions in order to gen-
erate groups of objects that will help us in reducing
the final number of rules. We will denote the set of
clusters in Ω as Θ = OG
1
, ..., OG
t
, being t ≥ 1 ≤ n
and OG
i
the i-th cluster in the objects’ domain.
In order to compare two attribute-clusters, each
feature R
i
has associated a comparison criterion,
C
i
(x, y), which indicates whether the pair of clus-
ters, x, y ∈ Π
i
, must be considered equal or not.
This comparison criterion can include specifications
for the case of invalid and missing values in order to
deal with incomplete information.
The simplest comparison criterion is the strict
equality, which can be applied to any domain:
C(x, y) =
1 if x = y
0 otherwise
Another interesting criteria can use the centroid of
each domain cluster. For example, being c
i,r
the cen-
troid of the r-th cluster over the i-th attribute the com-
parison function looks as follows:
If x ∈ G
a,1
and y ∈ G
a,2
then
C(x, y) =
1 if |c
a,1
− c
a−2
| ≤ ǫ
0 otherwise
Which expresses the fact that two clusters are con-
sidered equal if their centroids differ from each other
in at most a given threshold ǫ.
Since the mining process is intended to discover
MINING OF COMPLEX OBJECTS VIA DESCRIPTION CLUSTERING
189

the combinations of object features and object clusters
that frequently co-occur, it is necessary to manage the
different object projections. Thus, a subdescription of
an object o for a subset of features S ⊆ R, denoted as
I|
S
(o), is the projection of o over the feature set S. In
this context, we denote o[r] the value of the object o
for the feature r.
Moreover, we assume that there exists a similarity
function between two object subdescriptions, which
allow us to decide whether two objects o
i
and o
j
must
be considered equal or not by the mining process. All
the similarity functions are binary, that is, they return
either 0 (not equal) or 1 (equal).
The simplest similarity function is the following
one:
Sim(I|
S
(o), I|
S
(o
′
)) =
1 if ∀r ∈ S, C(o[r], o
′
[r]) = 1)
0 otherwise
which expresses the strict equality by considering
the comparison criterion of each of the subdescription
features.
Alternatively, the following similarity function
states that two subdescriptions are considered equal
if they have at least ǫ features belonging to the same
cluster:
Sim(I|
S
(o), I|
S
(o
′
)) =
1 if |{r ∈ S|C(o[r], o
′
[r]) = 1}| ≥ ǫ
0 otherwise
In order to compare object-clusters, we can take
one representative object of each cluster. In our ap-
proach, such a representative corresponds to the ob-
ject with maximum connectivity according to the
adopted similarity function. This is because we use a
clustering algorithm that generates star-shaped clus-
ters.
Analogously to the traditional Data Mining works,
we also provide definitions of support and ARs, but
applied to this new context.
We define the support of a subdescription v = I|
S
(o),
denoted with Sup(v), based in the work by (Danger
et al., 2004), as the percentage of objects in Ω whose
subdescriptions are similar to v, that is:
Sup(v) =
|{o
′
∈Ω|Sim(I|
S
(o
′
),v)=1}|
|Ω|
We say that a pair of subdescriptions v
1
= I|
R
1
(o)
and v
2
= I|
R
2
(o), with R
1
R
2
= ∅ and R
1
, R
2
⊂
R, are associated through the AR v
1
⇒ v
2
(s, c), if
Sup(v
′
) ≥ s and
Sup(v
′
)
Sup(v
1
)
≥ c, where v
′
= I|
R
1
∪R
2
(o).
The values of s and c are called support and confidence
of the rule respectively.
The problem of computing the AR for complex
objects consists of finding all the AR of the subde-
scriptions of Ω whose support and confidence satisfy the
user-specified thresholds.
It must be pointed out that the previous definitions
subsume the traditional concept of AR, therefore, if
we use strict equality in both the comparison crite-
rion and the similarity function, we obtain the classi-
cal definition of AR.
Besides, we can include other comparison crite-
ria such as the interval-based partitions, for quanti-
tative data, and the is-a relationship of the concept
taxonomies, in order to represent other kinds of ARs
(Srikant and Agrawal, 1997) (Z. Zhing and Zhang,
1997) (Hipp et al., 1998).
The idea that different items have different levels of
interest for the user, as suggested in (Gyenesei, 2000),
can be also incorporated in this framework by assign-
ing a weight to each variable in the similarity func-
tion. Moreover, when the variables’ data is fuzzy, it is
perfectly admissible to use as a comparison criterion
the membership of the values to the same fuzzy set.
3 FINDING INTERESTING
SUBDESCRIPTIONS
In a previous step to that of finding the interesting
ARs we will pre-process the data by means of clus-
tering algorithms in order to find the groups that will
be the base of our mining process.
The objective of this pre-processing step is that of
identifying clusters in the domain of the attributes
that will characterise the objects we will use to ex-
tract intra-cluster rules, and identifying clusters in the
domain of the recently discovered object subdescrip-
tions in order to extract inter-cluster rules.
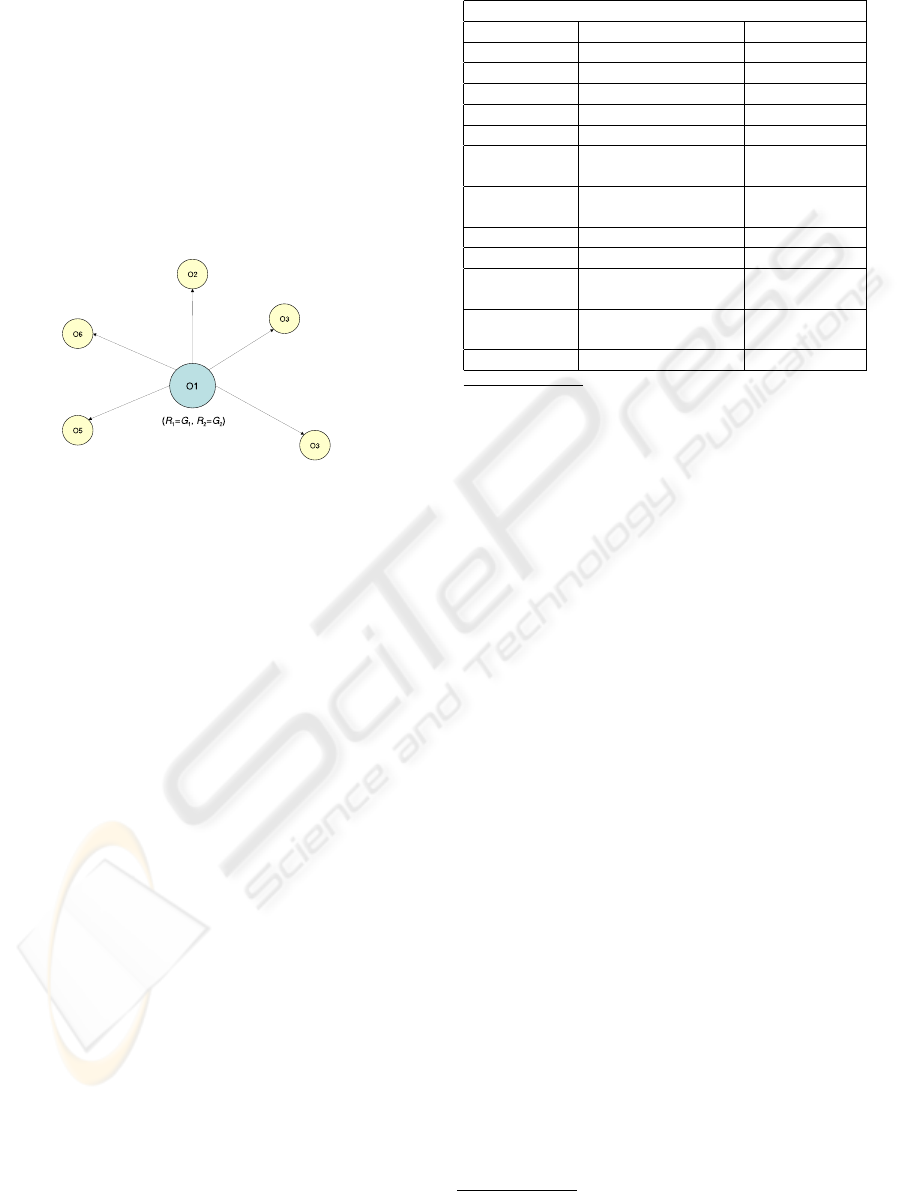
The algorithm chosen for this process is the Star
Clustering Algorithm introduced in (Aslam et al.,
1998), and modified to be order independent in (Gil-
Garc
´
ıa et al., 2003). The main reason for choosing
it is that the Star-based representation of the objects
subdescriptions seems a good way of representing the
support of each subdescription (i.e. the number of ob-
jects that are similar to it, also called, satellites, as we
will see later). Briefly, the star-shaped graphs capture
the most supported subdescriptions w.r.t. the defined
similarity function.
This algorithm approximates the minimal dominant
set of the β − similarity graph. The minimal domi-
nant set (Kann, 1999) is the smallest set composed
of graph’s vertexes that contains every vertex in the
graph, or at least if a vertex is not contained, it has
a neighbour that does. The members of the mini-
mal dominant set are called stars and their neighbours
satellites.
A star-shaped sub-graph of l + 1 vertexes consists
of a star an l satellites. Each sub-graph forms a group
and the stars are the objects with the biggest connec-
tivity. If an object is isolated in the graph it is consid-
ered as well a star.
The basic steps of this algorithm are the following
ones:
ICSOFT 2006 - INTERNATIONAL CONFERENCE ON SOFTWARE AND DATA TECHNOLOGIES
190
• Obtain the β − similarity graph.
• Calculate the degree of every vertex.
• While there’s still ungrouped sub-vertexes do:
– Take the ungrouped vertex with the highest de-
gree.
– Build a group with it an its neighbours.
Figure 2 shows the star-shaped graph of a cluster
of object subdescriptions. The complexity of the al-
gorithm is in O(n
2
), being n the number of processed
objects.
Figure 2: Example of star-based object cluster.
4 EXTRACTING ASSOCIATION
RULES
In this section we present an algorithm (see Figure 3)
for computing the frequent subdescriptions for a col-
lection of complex objects. This algorithm is inspired
in the original algorithm of (Agrawal and Srikant,
1994). However, it also uses the strategy of the Par-
tition algorithm (Srikant and Agrawal, 1997) to com-
pute the support of object subdescriptions.
It is worth mentioning that in this work an item-
set is a subdescription, and its support is the number of
objects in the database that are similar to it.
The algorithm works as follows: first, it determines
all the groups of values for each feature by using
the SetFreqClusters function, which applies the specific
clustering criterion and similarity function defined for
it. Then, while at least two groups have been found in
the previous iteration k, they are combined two by two
in order to create candidate sets of k + 1 features. Af-
terward, it determines, for each combination of vari-
ables, which of the candidate subdescriptions are fre-
quent enough.
It’s important to take into account that in order to
guarantee the monotonic construction of the frequent
itemsets, it is necessary that the similarity functions
satisfy the folowing condition: if two objects are dif-
ferent with respect to a subdescription S
1
, they are
Table 1: Features of the “Flags of the World” database.
Example database
Feature Number Feature name Domain
1 Colours Set of Colours
a
2 Religion Religions
b
3 Number of Colours Integer
4 Continent Continents
c
5 Number of vertical bars Integer
6 Number of horizontal
stripes
Integer
7 Number of sun or star
symbols
Integer
8 Number of circles Integer
9 Predominant colour Set of Colours
a
10 Colour in the top-left cor-
ner
Set of Colours
a
11 Colour in the bottom-left
corner
Set of Colours
a
12 Geographic quadrant NE, SE, SW, NW
a
yellow, gold, red, green, blue, brown, orange, white,
black
b
Catholic, Other Christian, Muslim, Buddhist, Hindu,
Ethnic, Marxist, Others
c
North America, South America, Europe, Africa,
Asia, Oceania
also different with respect to any other subdescription
S
2
, such that S
1
⊂ S
2
(Danger et al., 2004).
5 PRELIMINARY RESULTS
In this section we will give an example of the type of
ARs that are extracted from a database once applied
the mining process.
As earlier mentioned, we apply the mining algo-
rithm in two ways, intra- and inter-cluster. In order to
give examples of this kind of rules, we have taken the
well-known “Flags of the world” database
1
, which is
summarized in Table 1.
We will use the same notation as in the formal
framework for the different clusters, being for exam-
ple, G
1,2
, 2nd cluster in the domain of the 1st variable
and OG
2
the 2nd cluster of object subdescriptions.
5.1 Intra-cluster Rules
Let us suppose that we define the following clusters
for the different feature domains:
• Colour (colors in the flag): G
1,1
= (white, red),
G
1,2
= (blue), G
1,3
= (green).
1
http://www.cia.gov/cia/publications/factbook/docs
MINING OF COMPLEX OBJECTS VIA DESCRIPTION CLUSTERING
191
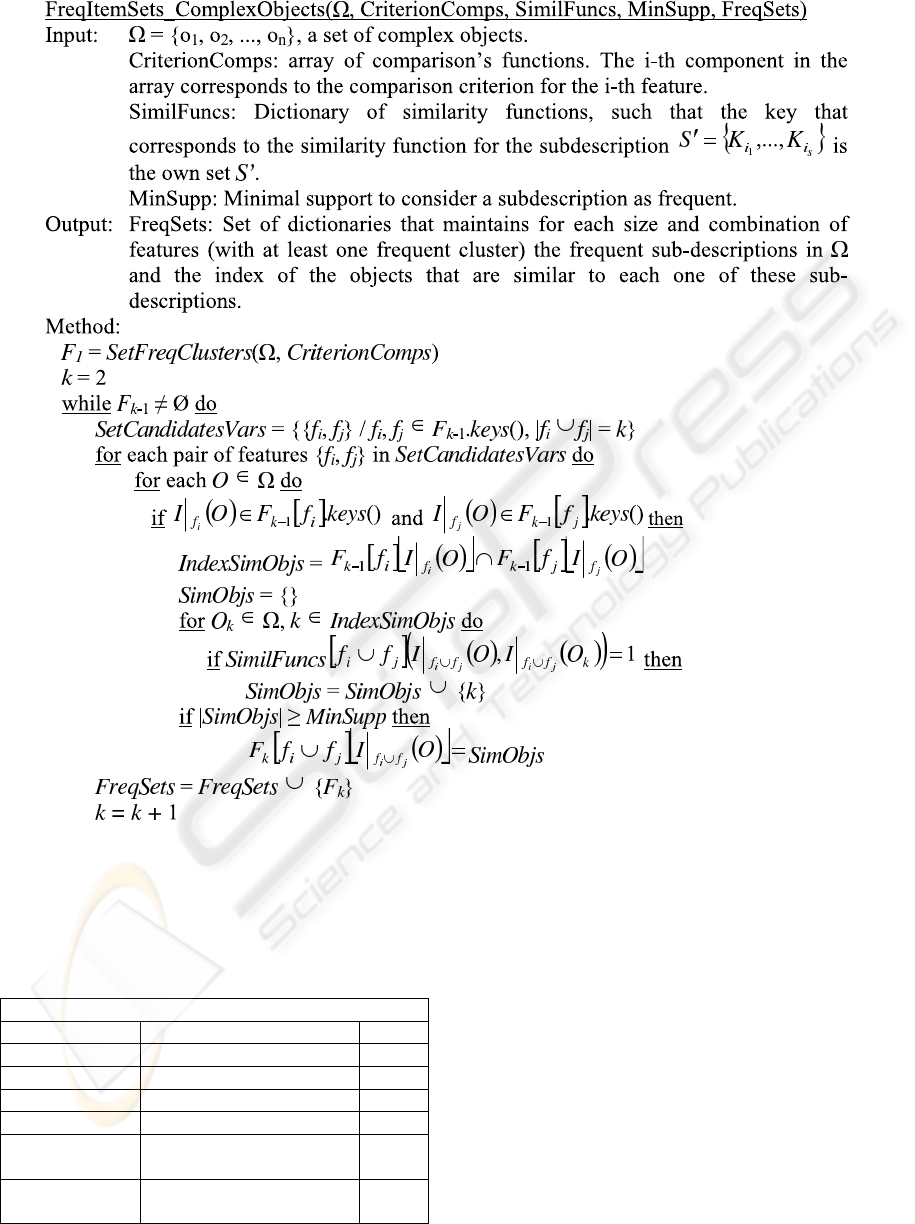
Figure 3: Data Mining Algorithm.
Table 2: Object clusters found by the Star-based clustering
algorithm.
Object Clusters
Object Cluster SUBDESCRIPTIONS #OBJ
OG
1
(G
1,1
, G
2,1
), (G
1,1
, G
2,2
) 20
OG
2
(G
1,3
, G
2,3
), (G
1,2
, G
2,3
) 10
OG
3
(G
3,2
, G
1,1
), (G
3,2
, G
1,2
) 15
OG
4
(G
3,1
, G
1,3
), (G
3,1
, G
1,2
) 30
OG
5
(G
4,4
, G
1,3
), (G
3,1
, G
1,3
),
(G
3,2
, G
1,3
)
20
OG
6
(G
3,2
, G
1,1
, G
6,1
, G
5,1
),
(G
3,2
, G
1,2
, G
6,1
, G
5,1
)
40
• Religion (majority religion in the country): G
2,1
=
(Catholic), G
2,2
= (OtherChristian), G
2,3
=
(Other).
• Number of Colours (number of different colors
present in the flag): G
3,1
= (2), G
3,2
= (3, 4).
• Continent (Continent to which the country be-
longs): G
4,1
=”North America”, G
4,2
=”South
America”, G
4,3
=”Europe”, G
4,4
=”Africa”,
G
4,5
=”Asia”, G
4,6
=”Oceania”.
• Number of vertical bars: G
5,1
= (1), G
5,2
= (2),
G
5,3
= (3), G
5,4
= {i|i > 3}.
• Number of horizontal stripes: G
6,1
= (1), G
6,2
=
(2), G
6,3
= (3), G
6,4
= {i|i > 3}.
• Number of star and sun symbols: G
7,1
= (1),
ICSOFT 2006 - INTERNATIONAL CONFERENCE ON SOFTWARE AND DATA TECHNOLOGIES
192

G
7,2
= (2), G
7,3
= (4), G
7,4
= (5), G
7,5
= {i|i >
5}.
• Number of circles: G
7,1
= 1, G
7,2
= 2, G
7,3
= 3,
G
7,4
= 4, G
7,5
= {i|i > 4}.
• Predominant color: G
9,1
=”yellow”, G
9,1
=”gold”,
G
9,1
=”red”, G
9,1
=”green”, G
9,1
=”blue”,
G
9,1
=”brown”, G
9,1
=”orange”, G
9,1
=”white”,
G
9,1
=”black”.
• Colour in the top-left corner: G
10,1
=”yellow”,
G
10,1
=”gold”, G
10,1
=”red”, G
10,1
=”green”,
G
10,1
=”blue”, G
10,1
=”brown”, G
10,1
=”orange”,
G
10,1
=”white”, G
10,1
=”black”.
• Colour in the bottom-left corner: G
11,1
=”yellow”,
G
11,1
=”gold”, G
11,1
=”red”, G
11,1
=”green”,
G
11,1
=”blue”, G
11,1
=”brown”, G
11,1
=”orange”,
G
11,1
=”white”, G
11,1
=”black”.
• Geographic quadrant: G
12,1
=”NE”, G
12,2
=”SE”,
G
12,3
=”SW”, G
12,4
=”NW”.
We obtain the following rules from two of the de-
tected subdescription clusters (see Table 2):
• From OG
3
: Number of Colours = G
3,2
, Col our =
G
1,1
(31%, 80%). Meaning that in the 80% of the
cases, if a flag contains 3 or 4 different colors, one
of them is either red or white. This rule has a sup-
port of 31%.
• From OG
1
: Religion = G
2,2
, Colour =
G
1,1
(21%, 68%). Meaning that in the 68% of the
cases, if a country’s majoritary religion is the Chris-
tian (other than the Roman Catholic), its flag con-
tains red or white. This rule has a support of 21%.
• From OG
3
: Colour = G
1,2
, Colour =
G
1,1
(32%, 63%). The color blue implies the
presence of both colors red and white in the 63%
of cases.
• From OG
6
: Number of Colours = G
3,2
,
Horizontal Stripes = G
6,1
, V erticalBars =
G
5,1
(20%44%). In 44% of the cases a flag contain-
ing 3 or 4 colors is composed by one quadratic
section.
5.2 Inter-cluster Rules
Inter-cluster rules involve object clusters that satisfy
the following conditions:
• the intersection between their member sets is
greater than the minimum support value MinSupp
and
• they do not share some of their features.
For example, from Table 2, the follow-
ing pairs are candidate to be mined for
finding inter-cluster rules: (OG
1
, OG
3
),
(OG
2
, OG
4
),(OG
2
, OG
5
),(OG
3
, OG
4
),(OG
3
, OG
6
)
and (OG
4
, OG
5
). For each of these pairs, the mining
algorithm calculates all the frequent object subde-
scriptions. For example, the following rules have
been extracted from the previous cluster pairs:
• From (OG
1
, OG
3
): In 30% of the cases, the coun-
tries where the majoritary religion is the Christian,
their flags have the colors White, Red or Blue.
• From (OG
2
, OG
4
): In 40% of the cases, countries
in which the majoritary religion is other than the
Christian,their flags have less than 3 colors, being
one of them either blue or green.
• From (OG
2
, OG
5
): In 30% of the cases, the African
countries have a religion different from the Chris-
tian.
• From (OG
3
, OG
6
), In 35% of the cases, the flags
with just one quadratic section contain Blue, Red
and White.
Notice that the same mining algorithm of Figure
3 is applied to find both inter- and intra-cluster as-
sociation rules. The difference consists of the set of
subdescription objects that is used as input. For local
analysis, just the members of a single object cluster is
passed to the algorithm. Instead, for global analysis,
the union of the members of a set of related candidate
clusters is passed to the algorithm.
6 CONCLUSIONS AND FUTURE
WORK
This paper presents a general framework for mining
complex objects represented with any of the existing
data models (e.g. relational, object-oriented and
semi-structured data models). The mining process
is guided by the semantics associated to each object
description feature (attributes), which are stated by
the users by selecting the appropriate representation
model. This was the model introduced by (Dan-
ger et al., 2004). Furthermore, we have extended
the framework to enrich the formal representation
of the objects using clusters of both attributes
and objects, so that the mining process results in
an acceptable number of higher level rules. We
show as well examples of this semantically richer
rules. The future work includes carrying out a
series of experiments over well-known databases
(e.g ftp://ftp.ics.uci.edu/pub/machine-learning-
databases/) and the Monalisa repository database
(http://alimonitor.cern.ch:8889), which is the Grid
monitoring database for the ALICE experiment at
CERN, in order to prove that the proposed method is
generating the expected results.
MINING OF COMPLEX OBJECTS VIA DESCRIPTION CLUSTERING
193

REFERENCES
Agrawal, R., Imielinski, T., and Swami, A. N. (1993). Min-
ing association rules between sets of items in large
databases. In Buneman, P. and Jajodia, S., editors,
Proceedings of the 1993 ACM SIGMOD International
Conference on Management of Data, pages 207–216,
Washington, D.C.
Agrawal, R. and Srikant, R. (1994). Fast algorithms for
mining association rules. In Bocca, J. B., Jarke, M.,
and Zaniolo, C., editors, Proc. 20th Int. Conf. Very
Large Data Bases, VLDB, pages 487–499. Morgan
Kaufmann.
Aslam, J. A., Pelekhov, K., and Rus, D. (1998). Static and
dynamic information organization with star clusters.
In CIKM, pages 208–217.
Aumann, Y. and Lindell, Y. (1999). A statistical theory for
quantitative association rules. In KDD, pages 261–
270.
Danger, R., Ruiz-Shulcloper, J., and Berlanga, R. (2004).
Objectminer: A newapproach for mining complex ob-
jects. In ICEIS (2), pages 42–47.
Dong, L. and Tjortjis, C. (2003). Experiences of using a
quantitative approach for mining association rules. In
IDEAL, pages 693–700.
Gil-Garc
´
ıa, R., Bad
´
ıa-Contelles, J. M., and Pons-Porrata, A.
(2003). Extended star clustering algorithm. In CIARP,
pages 480–487.
Gyenesei, A. (2000). Mining weighted association rules
for fuzzy quantitative items. In PKDD ’00: Proceed-
ings of the 4th European Conference on Principles of
Data Mining and Knowledge Discovery, pages 416–
423, London, UK. Springer-Verlag.
Hipp, J., Myka, A., Wirth, R., and G
¨
untzer, U. (1998). A
new algorithm for faster mining of generalized associ-
ation rules. In Proceedings of the 2nd European Sym-
posium on Principles of Data Mining and Knowledge
Discovery (PKDD ’98), pages 74–82, Nantes, France.
Kann, V. (1999). A compendium of NP optimization prob-
lems. In Complexity and Aproximation. Springer Ver-
lag.
Kuok, C. M., Fu, A. W.-C., and Wong, M. H. (1998). Min-
ing fuzzy association rules in databases. SIGMOD
Record, 27(1):41–46.
Miller, R. J. and Yang, Y. (1997). Association rules over
interval data. pages 452–461.
Okoniewski, M., Gancarz, L., and Gawrysiak, P. (2001).
Mining multi-dimensional quantitative associations.
In INAP, pages 265–274.
Park, J. S., Chen, M.-S., and Yu, P. S. (1995). An effective
hash based algorithm for mining association rules. In
Carey, M. J. and Schneider, D. A., editors, Proceed-
ings of the 1995 ACM SIGMOD International Con-
ference on Management of Data, pages 175–186, San
Jose, California.
Srikant, R. and Agrawal, R. (1996). Mining quantitative
association rules in large relational tables. In Ja-
gadish, H. V. and Mumick, I. S., editors, Proceedings
of the 1996 ACM SIGMOD International Conference
on Management of Data, pages 1–12, Montreal, Que-
bec, Canada.
Srikant, R. and Agrawal, R. (1997). Mining generalized
association rules. volume 13, pages 161–180.
Tong, Q., Yan, B., and Zhou, Y. (2005). Mining quantitative
association rules on overlapped intervals. In ADMA,
pages 43–50.
Z. Zhing, Y. L. and Zhang, B. (1997). An effec-
tive partitioning-combining algorithm for discovering
quantitative association rules. In Proc. of the First
Pacific-Asia Conference on Knowledge Discovery and
Data Mining.
ICSOFT 2006 - INTERNATIONAL CONFERENCE ON SOFTWARE AND DATA TECHNOLOGIES
194
