
BUILDING MAINTENANCE CHARTS AND EARLY WARNING
ABOUT SCHEDULING PROBLEMS IN SOFTWARE PROJECTS
∗
Sergiu Gordea
University Klagenfurt, Computer Science and Manufacturing
Universit
¨
atsstrasse 65-67, A-9020 Klagenfurt, Austria
Markus Zanker
University Klagenfurt, Computer Science and Manufacturing
Universit
¨
atsstrasse 65-67, A-9020 Klagenfurt, Austria
Keywords:
Software Engineering, Software Maintenance, Maintenance Efforts Classification, Statistical Process Control.
Abstract:
Imprecise effort estimations are a well known problem of software project management that frequently leads
to the setting of unrealistic deadlines. The estimations are even less precise when the development of new
product releases is mixed with the maintenance of older versions of the system. Software engineering mea-
surement should assess the development process and discover problems occurring into it. However, there are
evidences indicating a low success rate of measurement programs mainly because they are not able to extract
knowledge and present it in a form that is easy understandable for developers and managers. They are also not
able to suggest corrective actions basing on the collected metric data. In our work we propose an approach
for classifying time efforts into maintenance categories, and propose the usage of maintenance charts for con-
trolling the development process and warning about scheduling problems. Identifying scheduling problems as
soon as possible will allow managers to plan effective corrective actions and still cope with the planned release
deadlines even if unpredicted development problems occur.
1 INTRODUCTION
Effort estimation is known to be one of the most chal-
lenging problems of software project management.
Recent studies show that only about 25% of software
projects are successfully completed in time and in
budget (Liu et al., 2003). Effort estimations are more
imprecise when maintenance activities of older sys-
tem versions are run in parallel with development of
new product releases. When making release plans,
project managers need to take into account the efforts
required for implementing new functionality for the
next release as well as the efforts required for cor-
recting old system defects and new defects discov-
ered into productive systems and the available human
resources, too. In the world of software engineering
that is so complex and so immaterial there are a lot of
events that brake these plans. In reality there are no
ideal cases where each part of a project is completed
exactly as scheduled. Being short before or behind
schedule is not a problem as long as the process is
∗
This work is carried out with financial support from
the EU, the Austrian Federal Government and the State
of Carinthia in the Interreg IIIA project Software Cluster
South Tyrol - Carinthia
under statistical control and within predicted risk lim-
its. One of the most important problems of software
project management is that without having appropri-
ate warning mechanisms, managers discover too late
schedule overruns, wrong estimations and software
quality problems and it is too late to correct and mini-
mize their effect (Florac and Carleton, 1999). In order
to be able to deliver projects in time, budget and with
a high level of quality, project managers need to be
early warned about the risks associated with a project
that runs out of control (Liu et al., 2003).
Software Engineering Measurement (SEM) is a key
practice in high maturity organizations. The 4’th Ca-
pability Maturity Model Integration (CMMI) level,
also known as qualitatively managed level, defines
key practices for quality management and process
measurement and analysis
2
. Companies situated on
this maturity level start to use quantitative measure-
ment and use statistical process control for improving
the quality and increasing the efficacy of their pro-
cesses. Unfortunately, under relatively restricted bud-
gets conditions, small and medium software compa-
nies are not able to effectively introduce these prac-
tices into their development process. Software pro-
2
see http://www.sei.cmu.edu/cmmi/ for reference
210
Gordea S. and Zanker M. (2006).
BUILDING MAINTENANCE CHARTS AND EARLY WARNING ABOUT SCHEDULING PROBLEMS IN SOFTWARE PROJECTS.
In Proceedings of the First International Conference on Software and Data Technologies, pages 210-217
DOI: 10.5220/0001319902100217
Copyright
c
SciTePress

cess management is not a business goal in these com-
panies, and they are not ready to pay the relatively
high costs associated to software process measure-
ment and analysis. Goethert and Hayes present a set
of experiences from implementing measurement pro-
grams indicating that measurements programs have a
success rate below 20% (Goethert and Hayes, 2001).
The measurement programs usually fail because the
collected metrics are found to be irrelevant or not well
understood by key players, expensive and cumber-
some. Also no actions on the numbers are suggested,
and some of the collected metrics are perceived to be
unfair and the developers manifest against their usage
(Brown and Goldenson, 2004),(Goethert and Hayes,
2001).
In this paper we try to counteract the presented
management and measurement problems by propos-
ing an approach based on:
• Collection of time efforts and their classification
into maintenance categories.
• Building of maintenance charts
• Warning about development and scheduling prob-
lems
The collection of time efforts and software met-
rics can be automated by employing tools like Prom
(Sillitti et al., 2003) or HackyStat (Johnson et al.,
2003). In section 3.2 we present three models used
for classifying the maintenance efforts. In this way
we present the results in an easy understandable form
to managers and developers. In this paper we sup-
port the hypothesis that the maintenance charts and
the warning mechanism presented in section 3.3 are
valuable solutions for software process assessment,
helping the managers to easily interpret the evolution
in time of maintenance efforts and to find the sources
of scheduling problems.
2 RELATED WORK
Software measurement is a research topic since many
years, and still continues to be an open research field
due to the continuous evolution of software technolo-
gies, paradigms and project management techniques.
In the followings we reference a selection of related
work in the areas of software metrics, software main-
tenance, and artificial intelligence techniques applied
in software engineering.
The software process improvement (SPI) is a hot
topic in software industry, which bases itself on the
collection of product and process metrics. In order to
be effective SPI must employ tools that automatically
collect metrics with low costs high quality (e.g. man-
ually collected data are error prone and influenced
by human judgement). Hackystat (Johnson et al.,
2003) and Prom (Sillitti et al., 2003) are so called SPI
tools of third generation, that facilitate the collection
of product (software) and process metrics (time ef-
forts spent for in designing and developing software
projects).
Because of the ”legacy crisis”, described by Sea-
cord et al. in (Seacord et al., 2003), the measure-
ment and estimation of software maintenance efforts
gained special attention starting with ’80s. Studies
referenced by Seacord et.al. show that the most life
cycle costs of information systems occur after the
first software release. Another studies published in
the 80’s showed that on average the corrective efforts
take about 20% of the total maintenance efforts while
adaptive efforts take about 25%, and the most part
of 50% is directed to perfective category (Lientz and
Swanson, 1980). Usually, preventive efforts are not
greater than 5% of the total maintenance efforts (Sea-
cord et al., 2003). More recent studies from environ-
ments involving newer technologies confirm the same
distribution of maintenance efforts (Vliet, 2000), even
in the case of web applications (Lee and Jefferson,
2005).
Generally, the information used in these reports
is extracted from change logs, issue tracking sys-
tems and/or version control systems, which is manu-
ally collected and usually incomplete and error prone
(Graves and Mockus, 1998; Kemerer and Slaughter,
1999; Zanker and Gordea, 2006). From our knowl-
edge the work presented in this paper is the first at-
tempt of classifying efforts in maintenance categories
basing on automatic collected time information.
In the last years, different artificial intelligence
techniques were employed for extracting knowledge
out of the metric data and for learning models that
assess different software engineering tasks like: pre-
dictions and estimation of software size & quality, de-
velopment and maintenance efforts and costs (Zhang
and Tsai, 2003). Similar to our approach Liu et.
al. present a warning system for early detection of
scheduling and budgeting problems, as well as low
quality risks, based on software metrics and rules
extracted with a fuzzy inference engine (Liu et al.,
2003). Different from Liu’s work we focus our at-
tention on the evolution in time of development and
maintenance efforts, and reasoning on maintenance
charts. An analysis of software maintenance data us-
ing bayesian networks, decision trees and expert net-
works is presented in (Reformat and Wu, 2003).
Some software metrics are strongly correlated with
each other, therefore using all available metrics to in-
fer a decision model does not necessary improve the
resulting model. Contrary, there are cases when com-
plex models based on large sets of variables provide
inferior prediction accuracy than alternative models
based on smaller sets of variables (Thwin and Quah,
2005), (Khosgoftaar et al., 2003).
BUILDING MAINTENANCE CHARTS AND EARLY WARNING ABOUT SCHEDULING PROBLEMS IN
SOFTWARE PROJECTS
211

3 MONITORING AND
CONTROLLING
MAINTENANCE EFFORTS
In the development of almost all information systems
there is a high pressure to release the first working
version of the system as soon as possible making
a compromise between the time to market and the
quality of software products. Afterwards, the sys-
tems enter into a maintenance process with enhance-
ment/modernization cycles and periodical new ver-
sion releases (Seacord et al., 2003). In many cases,
when working on a new release, the activities related
to the implementation of new functionality are mixed
with the ones related to the correction of defects found
in previous releases. While the first category of efforts
are typically payed by the customer, the second type
of costs are covered by maintenance fees. Under this
assumptions it is very important to measure and con-
trol the distribution of the development efforts over
different maintenance activities.
3.1 Maintenance Categories
Taking into consideration the reasons of software
changes, the maintenance efforts were classified by
Swanson and Lientz into 4 categories (Lientz and
Swanson, 1980): perfective, corrective, preventive
and adaptive.
The perfective maintenance (PeM) typically con-
sists of activities related to implementation of new
system functionality, which usually take more time
to be completed than other development activities.
When enhancing system functionality new classes are
added into the system and new methods as well (in
existing and/or in the new classes). Under these con-
ditions the value of all metrics, representing structural
or complexity changes is increasing, and the share
of time efforts spent for these activities are relatively
high.
The corrective maintenance (CM) deals mainly
with the elimination of system defects (also called
bugs in software development communities). It af-
fects existing artifacts, by changing parts of the source
code that cause system misbehavior, which typically
means correction or even re-implementation of ex-
isting algorithms. Usually, this kind of maintenance
modifies the complexity and the size of existing arti-
facts without changing their structure too much, but
in some cases the structure is also significantly af-
fected. For example, there are cases when old pieces
are deleted because they are not used anymore, or
cases when the algorithms don’t consider all possi-
ble combinations of the input variables. In the last
case it is required to treat new special cases by imple-
menting new classes or methods. Depending on the
severity and the nature of the corrected defects, the
tasks associated to this maintenance activities may be
completed in larger or smaller time intervals.
Preventive Maintenance (PrM) gained special at-
tention in the last 20 years, when the demand for high
quality was constantly increasing. Preventive mainte-
nance activities have the goal to improve the quality
of the source code and correct those parts of the code
that are suspected to introduce future system defects.
In this category are included the so called ”code re-
views”, and also the agile practices like implementa-
tion of test cases, refactorings.
Preventive Maintenance - implementation of test
cases (P rM
T
). Since agile practitioners emphasized
the test driven development, many companies started
to adopt unit testing as an important component of
their development process. It aims at verifying soft-
ware’s correct functionality and early identification of
system defects. For implementing unit tests, java de-
velopers extend the functionality of JUNIT
3
library
and implement project specific test cases. Identifica-
tion of test cases in the source code can be done bas-
ing on the naming conventions (test classes include
the ”Test” prefix, or suffix in their names), basing on
the class inheritance tree (test cases are subclasses of
JUnit’s TestCase class) and physical location of the
source files (test cases are kept apart from project’s
source code, they are usually placed in folders that are
exclusively dedicated to unit tests). Similar to per-
fective maintenance, this type of maintenance activ-
ities creates new artifacts, changing the structure of
the source code. Since these artifacts are quite sim-
ple and small the efforts invested for their creation are
relatively low.
Preventive Maintenance - Refactoring (P rM
R
).
Refactorings are changes of the internal structure of
source code that improve its modularity, readability
and understandability without changing its observable
behaviour (Fowler, 1999). The source code refactor-
ings have the goal of reducing the amount of dupli-
cated code and improving its reusability. Refactor-
ings may occur at different levels of the project struc-
ture: method, class, package, architecture. The effect
of these activities are important changes in the struc-
ture of the code and a reduction of its size and com-
plexity. When the refactored methods are not reused
(e.g. refactoring is done to support future reuse, or
just to simplify the algorithms), the overall size of
the artifacts is preserved (no lines of code are added,
or deleted, they are just restructured). Because of
automatic support provided by development environ-
ments, simple refactorings require less effort in com-
parison with other development activities.
Adaptive Maintenance. The efforts required to
modify software systems in order to be able to work
3
see http://www.junit.org for reference
ICSOFT 2006 - INTERNATIONAL CONFERENCE ON SOFTWARE AND DATA TECHNOLOGIES
212
in new environments (e.g. new operating system, new
hardware, new databases etc.) are considered to be
adaptive maintenance. We focus our research and ex-
periments on systems developed in Java, which is a
platform independent programming language. In this
context this maintenance category is expected encom-
pass insignificant amounts of efforts, and it is out of
the scope of this paper’s work.
Source code comprehension (SCC). Source code
comprehension is a software engineering and mainte-
nance activity necessary to facilitate reuse, inspection,
maintenance, reverse engineering, reengineering, mi-
gration, and extension of existing software systems
4
. Typical for this activity is the fact that the pro-
grammers spend time just for visualizing source code,
without making any change into it. The efforts in-
vested in these activities need to be redistributed over
the other maintenance categories. A simple solution
for this problem is the distribution of these efforts ac-
cording to the proportion of each maintenance cate-
gory.
3.2 Classification Methodology
When searching for a robust classifier for mainte-
nance efforts, we evaluated the performance of sev-
eral models based on domain knowledge, induced de-
cision rules and probabilistic models. The classifica-
tion itself is done by analyzing the time evolution of a
set of software metrics: Chidamber-Kemerer metrics,
Halsted’s metrics and McCabe’s cyclomatic complex-
ity. Additional two boolean variables, as well as the
collected efforts themselves complete the list of clas-
sifiers’ input. The boolean variables represent the re-
sults of the tests indicating whether a given code frag-
ment is part of a test class (TC), or whether it was
created as a result of source code restructuring (OA).
The OA test is based on the concept proposed by God-
frey et al. (Godfrey and Zou, 2005) and on other ap-
proaches that aim at identifying structural changes in
source code based on software metrics (Kontogiannis,
1997; Germain and Robillard, 2005). A detailed de-
scription of the other above mentioned metrics can be
found in (Norman Fenton, 1997).
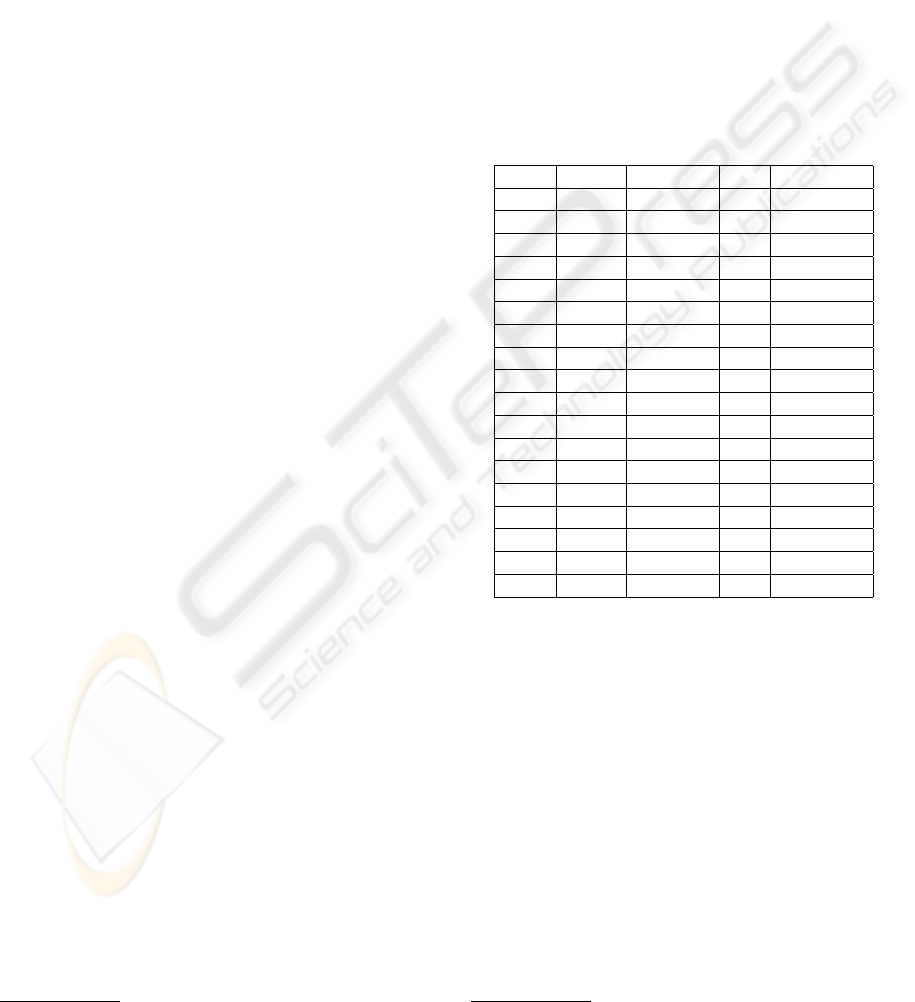
3.2.1 Knowledge-based Approach
The knowledge-based approach captures the domain
heuristics in the classification table (see Table 1) and
transforms into a decision rules representation (see
Table 2). The given heuristics represent rules of
thumb such as: If high amount of effort is spent for
heavily changing the structure of a code fragment
without increasing its size and without reusing code
from other parts of the product, then the effort should
4
see www.program-comprehension.org
be classified as corrective maintenance (compare the
row marked with an asterisk in Table 1). In fact
the heuristics formalize the discussion of the differ-
ent maintenance categories in the previous sections.
The metrics in classification model are grouped
into two classes. The STR group indicates structural
changes and uses the following metrics : Number of
methods, Number of classes and Depth of inheritance
tree. Furthermore, the size and complexity metrics
are grouped in the variable SIZE including: Lines of
code, Response for a class, Fan-out, Cyclomatic com-
plexity, as well as Halstead’s volume. EFF stands for
the time effort associated with a given activity, while
OA and TC signify decision variables on origin anal-
ysis and test classes.
Table 1: Classification Table.
STR SIZE EFF TC Category
0 0 1 0 SCC
0 0 0 1 P rM
T
0 1 0 0 CM
0 1 0 1 P rM
T
0 1 1 0 CM
0 1 1 1 P rM
T
1 0 0 0 P rM
R
1 0 0 1 P rM
T
1 0 1, OA=0 0 CM*
1 0 1, OA=0 1 P rM
T
1 0 1, OA=1 0 P rM
R
1 0 1, OA=1 1 P rM
T
1 1 1 0 P eM
1 1 1 1 P rM
T
0 1 0 0 P rM
T
0 1 0 1 P rM
T
0 1 0 0 P rM
T
0 1 0 1 P rM
T
For TC the value 1 signifies that the maintenance
activity that is currently analyzed is related to the
implementation/modification of test methods. OA
equals 1 indicates that - within the course of the
given activity - code fragments were extracted from
the body of other methods. Small values of time
effort (EFF) are marked with 0, while higher ones
are marked with 1. Changes in the source code that
increase its size (SIZE) or its structural complexity
(STR) are indicated with the value 1 in the corre-
sponding columns, while the value 0 means no change
or a decrease of related metrics values. We inferred
the following classification rules by using the Matlab
statistical toolbox
5
(Zanker and Gordea, 2006):
When analyzing the extracted categorization rules,
we can observe that all efforts related to refactoring or
correcting of test classes are classified with P rM
T
,
5
See http://www.mathworks.com for reference
BUILDING MAINTENANCE CHARTS AND EARLY WARNING ABOUT SCHEDULING PROBLEMS IN
SOFTWARE PROJECTS
213
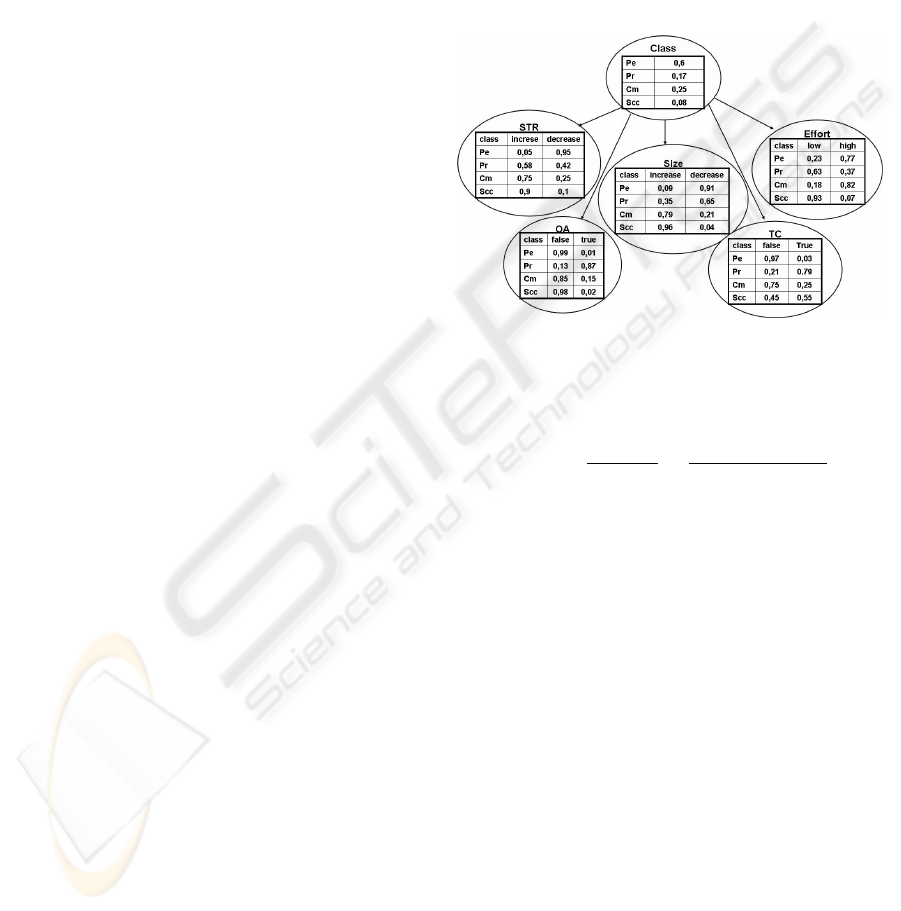
Table 2: Classification rules.
P rM
T
= T C
P eM = ¬T C
V
ST R
V
SIZE
CSS = ¬TC
V
¬ST R
V
¬SIZE
P rM
R
= (¬T C
V
ST R
V
¬SIZE
V
¬EF F )
CM = (¬T C
V
¬ST R
V
SIZE)
W
(¬T C
V
ST R
V
¬SIZE
V
EF F
V
¬OA)
instead of CM or PrM
R
. This definition is consis-
tent with developers’ view, that considers only mod-
ifications of source code that implements a system
behavior as perfective or corrective maintenance. A
more detailed discussion regarding the expert heuris-
tics basing on concrete source code examples is pre-
sented in (Zanker and Gordea, 2006).
3.2.2 Machine Learning Approaches
Machine learning algorithms are widely used for ex-
tracting knowledge out of empirically collected data
sets. The most popular algorithms are based on deci-
sion trees or decision rules as well as on probabilistic
models or neural networks.
Decision Rules. Decision trees, decision tables
and decision rules are related knowledge represen-
tation technologies. Decision trees are classification
schemes that consist of a set of subsequent boolean
tests that end up with leafs indicating the item’s cat-
egory. All paths in the tree starting with the root and
ending with one of the leafs can be expressed in the
form of ”IF (condition) THEN category” rules, where
a condition is a conjunction of tests in the path. This is
in fact the decision table representation of the decision
tree. The description for a class can be described as a
disjunction of all rules in a decision table identifying
the given category, whose representation is generally
known as disjunctive normal form, or decision rule.
Basically, there are two approaches for learning de-
cision rules from a given data set. The top-down ap-
proach is also used for learning decision trees, and
consists of an algorithm that recursively splits the data
set until all sets contain elements belonging to only
one category. The bottom-up rule induction approach
is a two step algorithm. In the initial phase a deci-
sion table is constructed by collecting all individual
instances from a data set. The second step of the algo-
rithm builds generalized rules written in a more com-
pact form by heuristically searching for the single best
rule for each class that covers all its cases. A good
comparison of available algorithms used for learn-
ing decision trees and decision rules can be found in
(Apte and Weiss, 1997).
Bayesian Networks. Bayesian Networks, also
known under the names of causal or belief networks
are directed acyclic graphs (DAG) used to represent
probability distributions in a graphical manner. Each
node in the Bayesian network represents a probability
variable, and has an associated probability distribu-
tion table used to compute class probabilities for any
given instance (see Figure 1). An edge between two
nodes of the network represents the direct influence of
a variable representing the parent node to the acces-
sor’s node variable. If there is no edge between two
nodes of the network, their variables are considered
to be conditionally independent (P(A/B)=1).
Figure 1: Sample Bayesian Network.
The computation of class probabilities is based on
the Bayesian theorem:
P (B/A) =
P (A, B)
P (A)
=
P (A/B) ∗ P (B)
P (A)
(1)
where P(A) and P(B) are the probabilities of event A,
and B respectively, and P(B/A), P(A/B) are the condi-
tional probabilities, of event B given A, and of event
A given B, respectively.
Given the fact that Bayesian networks are acyclic
graphs, they can be ordered such that for each node all
of its accessors get a smaller index. In this case, con-
sidering the conditional independence assumption be-
tween the parents and the accessors of network nodes,
the chain rule in the probability theory can be repre-
sented as (H.Witten and Frank, 2000):
P (a
1
, a
2
, a
3
, ..., a
n
) =
n
Y
i=1
P [a
i
/a
i−1
, ..., a
1
] (2)
where a
i
are networks nodes.
Learning and selecting the best Bayesian classi-
fier from labeled data sets is a challenging problem.
Many different approaches were proposed, most of
them exploiting particularities of the Bayesian net-
work and optimizing the learned models for partic-
ular probability distributions. A general and robust
algorithm based on the minimum description length
(MDL) principle is presented by Lam & Bacchus in
(Lam and Bacchus, 1994).
ICSOFT 2006 - INTERNATIONAL CONFERENCE ON SOFTWARE AND DATA TECHNOLOGIES
214
3.3 Maintenance Charts
Building maintenance charts. The development ef-
forts are not the only indicator of problems occurring
in software projects, but all these problems will be re-
flected in maintenance charts generating instabilities
or out-of control situations. The statistical process
control theory defines well established algorithms for
building different types of control charts (range, av-
erage, etc.). The control limits are computed basing
on previously collected data and using the concept of
three sigma allowed variance. These charts can be
built only after some amounts of empirical data are
collected, and they are static models that will need to
be changed in different phases of development pro-
cess. Therefore we propose a model for building
maintenance charts basing on initial effort estimations
that will define the center line of each chart (CL). The
upper control limit (UCL) and the lower control limit
(LCL) are computed using the risk interval taken into
consideration in project planning.
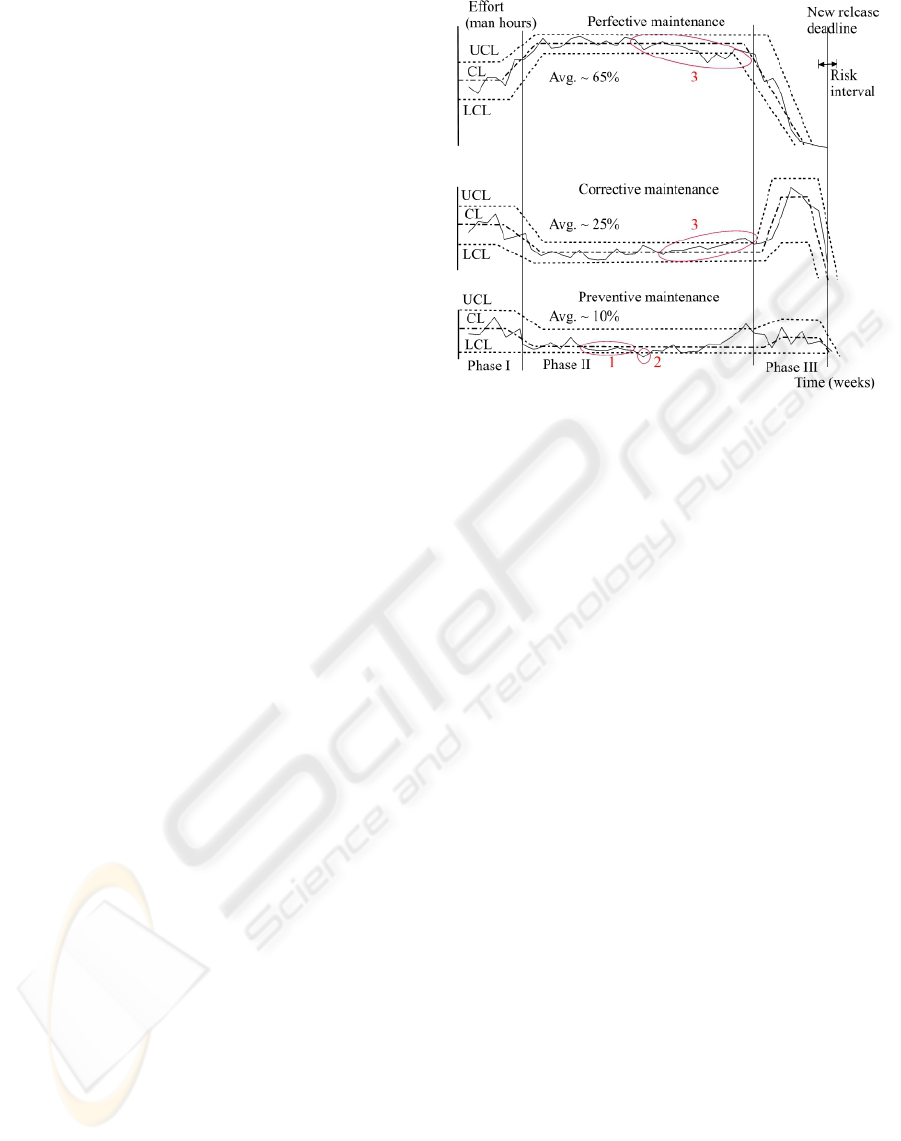
In Figure 2 we present an example of a main-
tenance chart that monitors and controls the evolu-
tion in time of perfective, corrective and preventive
efforts. The maintenance efforts are not uniformly
distributed over the whole development period of a
new release. In the initial phase (Phase I) impor-
tant amounts of efforts are allocated for designing
new modules and for correcting defects of the last re-
lease (corrective maintenance), activities that are usu-
ally associated with refactorings and unit testing ac-
tivities (preventive maintenance). In this phase, fea-
ture implementation activities postponed from previ-
ous releases are implemented too. In the second phase
(Phase II) the most efforts are allocated for imple-
menting new functionality into the system (perfec-
tive maintenance), while the last period before release
(Phase III) is reserved for testing and correcting the
found defects. In case of experienced development
teams these tasks are associated with unit testing and
refactorings. Given this distribution in time of the
maintenance efforts, the maintenance charts are cre-
ated as a combination of normal (simple average and
range control charts) and moving average charts. The
average distribution of the development efforts over
maintenance categories indicates a healthy develop-
ment process (∼65% Perfective maintenance, ∼25%
Corrective maintenance and ∼10% Preventive main-
tenance).
Warning about development and scheduling prob-
lems. Four tests that are effective in detecting lo-
cal unusual patterns in control charts are presented in
(Florac and Carleton, 1999). These tests analyze the
distribution of successive points in the control charts
over the three sigma interval around the center line.
They are used to identify if the process runs out of
control (the variables overpass the control limit) or
Figure 2: Maintenance charts.
when the system looses its stability or calibration (the
variables doesn’t have a random variation around the
center line). We adopted two of these tests that to-
gether with trend analysis are able to uncover pro-
cess instabilities and warn about impending schedul-
ing problems. The first test checks the existence of
four or more points on the same side of the center
line. A positive result of this test shows process insta-
bility and warns that the process may soon run out of
control (see situation 1 in Figure 2).
The second test identifies the cases when the pro-
cesses are out of control like in situation 2 of Fig-
ure 2 when the first point that overpasses the control
limits is found. Apparently, less efforts invested in
preventive actions are not an indicator of scheduling
overruns since the planned functionality is still im-
plemented into the system. Anyway, in this situation
the managers must be aware that the last implemented
source code was not enough tested and its quality was
not verified. In other words, this source code may be
buggy and software quality problems may occur in the
near future.
In the third case (situation 3) the process runs com-
pletely out of control. The trend analysis shows a con-
stant increase of corrective and a decrease of perfec-
tive maintenance efforts. Because of the deterioration
of the source code quality implemented in the last pe-
riod of time, it is harder to implement new function-
ality and more defects need to be corrected. In or-
der to be able to make the release at the planned date
it is absolutely mandatory to make corrections in the
schedule. In order to bring the project back on track,
the manager may decide to postpone the implementa-
tion of some system features for the next release and
to reallocate these resources for improving the qual-
BUILDING MAINTENANCE CHARTS AND EARLY WARNING ABOUT SCHEDULING PROBLEMS IN
SOFTWARE PROJECTS
215
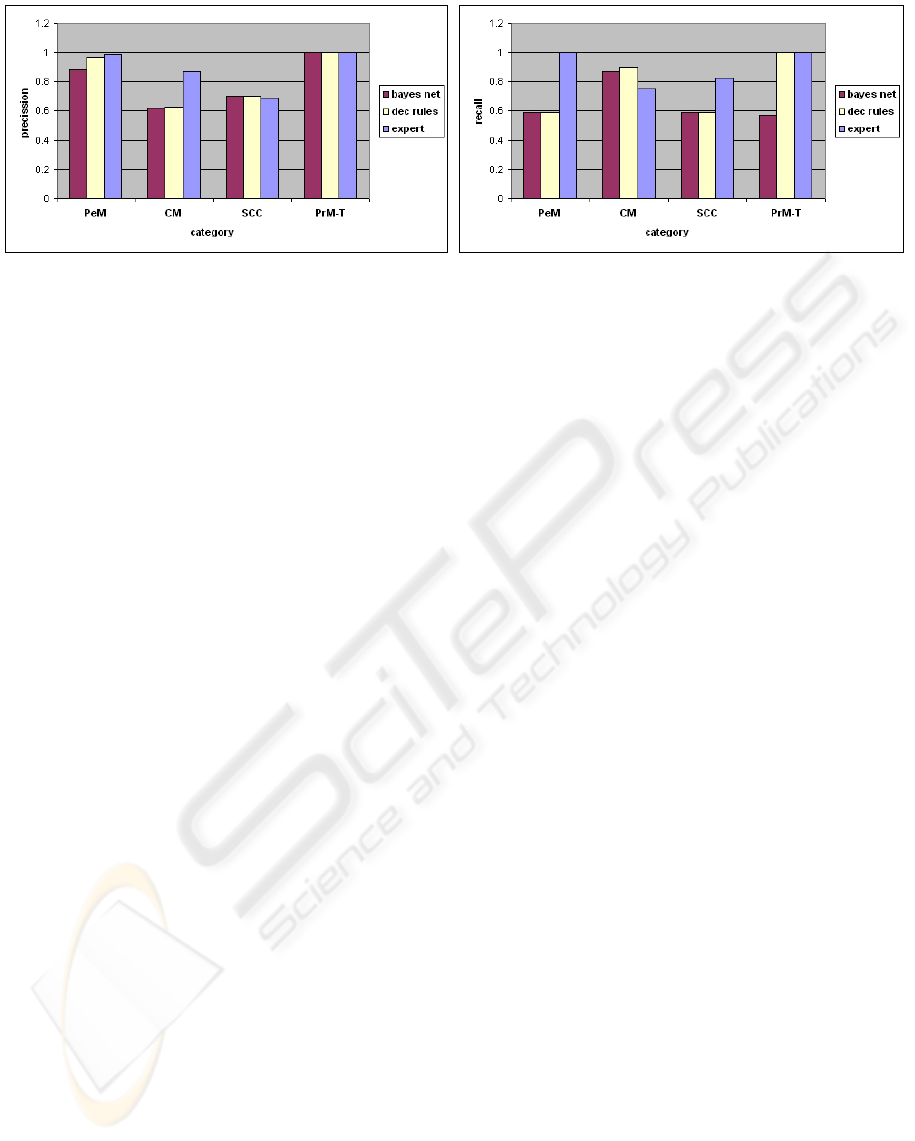
Figure 3: Classification accuracy.
ity of the source code and for correcting more system
defects.
4 EVALUATION OF
CLASSIFICATION MODELS
The purpose of our evaluation was to compare the
classification performance of the presented tech-
niques. For the empirical evaluation we collected time
efforts and software metrics from a student project
over one calendar month. During the evaluation pe-
riod the students were implementing their graduation
project having the size about several tens of thousands
lines of code. At the end of each day the students were
asked to manually classify the collected efforts into
the corresponding maintenance categories. This in-
formation was collected into a database consisting of
2155 events. Each event registered the entity that was
edited, the date and its time effort, as well as the man-
ually inserted maintenance classification of the devel-
opers.
Due to daily annotation of the experimental data set
by developers, we assume the manual classification
to be correct. Now we evaluate the accuracy of the
expert’s set of heuristics and the learned classification
models on the data set.
We compare expert heuristics (expert) with the
three learning techniques (Bayes Net and induced de-
cision rules). The classification accuracy was de-
termined by cross-validating on 50% of the data
set. Using the developers classification as relevance
set, the classification performance of each algorithm
was evaluated using the precision and recall metrics,
which are the standard evaluation metrics used in in-
formation retrieval. Precision is defined as the ratio
of the number of relevant records retrieved to the total
number of irrelevant and relevant records retrieved.
In our case, given the maintenance category X, the
precision measures the ratio of events identically cat-
egorized by classification algorithm and software de-
velopers as belonging to category X from the total
number of records selected by classification algorithm
into category X. Similar to this, the recall is the ratio
of events identically categorized by classification al-
gorithm and software developers as belonging to cat-
egory X, out of the total number of records classified
by developers into category X. These two measures
are inversely related and the best classification algo-
rithms are those that present highest values for both
metrics.
As can be seen in Figure 3 the expert model and
learned decision rules provide the best results. Due
to their classification rule that is realized with a sin-
gle variable (TC), the P RM
T
efforts are identified
with 100 % accuracy by these two algorithms. Con-
trastingly, the probabilistic model identifies P R M
T
with high precision but introduces false positives (re-
call < 1). Perfective maintenance can also be pre-
dicted with a good precision (> 0.87) by all three
models, but the expert heuristics are the only algo-
rithm that do not introduce many false positives (i.e.
also high recall). All algorithms have problems to cor-
rectly predict the source code comprehension activi-
ties (about 60-70% precision) and the machine learn-
ing models have problems to classify corrective main-
tenance, too. With a precision around 85% and a re-
call of about 77%, the expert model classifies correc-
tive maintenance efforts with a reasonable accuracy.
Concluding, the expert model provides the highest
prediction accuracy and is able to correctly classify
about 83% of all events. The prediction accuracy re-
mains stable over time. Using absolute effort numbers
about 86% of total effort has been correctly classified.
5 CONCLUSIONS
Being able to deliver product releases at the planned
deadlines is extremely important in software indus-
try, especially for companies that work under con-
ICSOFT 2006 - INTERNATIONAL CONFERENCE ON SOFTWARE AND DATA TECHNOLOGIES
216

tract. Monitoring the progress and keeping the devel-
opment process under control ensures the success of
a project. However, there are many sources that pro-
duce development and scheduling problems in soft-
ware projects. In this paper we presented an approach
for warning about development and scheduling prob-
lems based on maintenance charts. Three types of
tests inspired from statistical process control theory
are used to identify events indicating instabilities or
processes that get out from statistical control. An
experiment evaluating the performance of different
models used for classifying efforts into maintenance
categories is presented. For this experiment we used
an empirical data set collected from the development
of a student project. The evaluation showed that a
classifier based on expert heuristics outperformed ma-
chine learning algorithms due to a higher stability ver-
sus false leads and noise. Future work will focus on
the implementation of the presented concepts for as-
sessing the management of commercial projects and
further experiences can be acquired.
REFERENCES
Apte, C. and Weiss, S. (1997). Data mining with decision
trees and decision rules. Future Gener. Comput. Syst.,
13(2-3):197–210.
Brown, M. and Goldenson, D. (2004). Measurement anal-
ysis: What can and does go wrong? In METRICS’04
Proceedings, pages 131–138.
Florac, W. A. and Carleton, A. D. (1999). Measuring the
software process: statistical process control for soft-
ware process improvement. Addison-Wesley Long-
man Publishing Co., Inc., Boston, MA, USA.
Fowler, M. (1999). Refactoring - Improving the Design of
Existing Code. Addison-Wesley Publishing Company.
Germain, E. and Robillard, P. N. (2005). Activity patterns
of pair programming. The Journal of System and Soft-
ware, pages 17–27.
Godfrey, M. and Zou, L. (2005). Using origin analysis to
detect merging and splitting of source code entities.
IEEE Transactions on Software Engineering, 31(2).
Goethert, W. and Hayes, W. (2001). Experiences in im-
plementing measurement programs. Technical Report
2001-TN-026, Carnegie Mellon University/Software
Engineering Institute (SEI).
Graves, T. L. and Mockus, A. (1998). Inferring change ef-
fort from configuration management data. In Metrics
98: Fifth International Symposium on Software Met-
rics, pages 267–273, Bethesda, Maryland.
H.Witten, I. and Frank, E. (2000). Data Mining, Prac-
tial Machine Learning Tools and Techniques with Java
Implementations. Morgan Kaufmann, USA.
Johnson, P., Kou, H., Agustin, J., Chan, C., Miglani, C.
M. J., Zhen, S., and Doane, W. (2003). Beyond
the personal software process: Metrics collection and
analysis for the differently disciplined. In ICSE ’03
proceedings.
Kemerer, C. F. and Slaughter, S. (1999). An empirical ap-
proach to studying software evolution. IEEE Transac-
tions on Software Engineering, 25(4):493–509.
Khosgoftaar, T. M., Nguyen, L., Gao, K., and Rajeeval-
ochanam, J. (2003). Application of an attribute se-
lection method to cbr-based software quality classifi-
cation. In ICTAI 2003 proceedings, pages 47–52.
Kontogiannis, K. (1997). Evaluation experiments on the de-
tection of programming patterns using software met-
rics. In WCRE ’97 proceedings.
Lam, W. and Bacchus, F. (1994). Learning bayesian belief
networks: An approach based on the mdl principle.
Lee, M.-G. and Jefferson, T. L. (2005). An empirical study
of software maintenance of a web-based java applica-
tion. In 21st IEEE International Conference on Soft-
ware Maintenance Proceedings (ICSM’05).
Lientz, B. P. and Swanson, E. B. (1980). Software Mainte-
nance Management. Addison-Wesley Longman Pub-
lishing Co., Inc., Boston, MA, USA.
Liu, X. F., Kane, G., and Bambroo, M. (2003). An intel-
ligent early warning system for software quality im-
provement and project management. In ICTAI 2003
proceedings, pages 32–38.
Norman Fenton, S. L. P. (1997). Software Metrics: a rig-
urous and practical approach (second edition). PWS
Publishing Company.
Reformat, M. and Wu, V. (2003). Analysis of software
maintenance data using multi-technique approach. In
ICTAI 2003 proceedings, pages 53–60.
Seacord, R. C., Plakosh, D., and Lewis, G. A. (2003). Mod-
ernizing Legacy Systems: Software Technologies, En-
gineering Processes, and Business Practices. P Addi-
son Wesley Professional.
Sillitti, A., Janes, A., Succi, G., and Vernazza, T. (2003).
Collecting, integrating and analyzing software metrics
and personal software process data. In EUROMICRO
2003, pages 336–342.
Thwin, M. M. T. and Quah, T.-S. (2005). Application of
neural networks for software quality prediction using
object-oriented metrics. Journal of Systems and Soft-
ware, 76(2):147–156.
Vliet, H. V. (2000). Software engineering: principles and
practice. John Wiley.
Zanker, M. and Gordea, S. (2006). Measuring, monitoring
and controlling software maintenance efforts. Time
2006, International Symposium on Temporal Repre-
sentation and Reasoning, 0:103–110.
Zhang, D. and Tsai, J. J. P. (2003). Machine learning
and software engineering. Software Quality Control,
11(2):87–119.
BUILDING MAINTENANCE CHARTS AND EARLY WARNING ABOUT SCHEDULING PROBLEMS IN
SOFTWARE PROJECTS
217
