
A GEOMETRIC REPRESENTATION FOR THE REAL-TIME
SIMULATION OF NC MACHINING PROCESSES
Aitor Moreno, Carlos Toro, Iosu Arizkuren, Alvaro Segura, Jorge Posada
VICOMTech Association, Paseo Mikeletegi 57, 20009 San Sebastian, Spain
Marcelino Novo
FAGOR AUTOMATION S. Coop. Bº San Andrés, 19 - Apdo.144 - 20500 Mondragón, Spain
Juanjo Falcón
SOME Sistemas Informáticos S.L. Avda. Navarra s/n (oficina 10). 20500 Mondragón, Spain
Nieves Alcaín
Alecop, S. Coop. Loramendi, 11, Apto. 81 - 20500 Mondragón, Spain
Keywords: NC-Machining, Verification, Material Removal, Solid Representation, Simulator, Interactive Rendering.
Abstract: In this paper we present a level-based representation used in the implementation of a real-time material
removal simulator, whose principal feature is to be embedded into a commercial NC machine where the
hardware capabilities are limited. The representation and its supporting architecture is used for the
generation of an interactive simulation of the actual machined part taking as input the NC machine feedback
with the following features: i) The virtual and real simulations must be synchronized, ii) the internal
representation of the objects must be as exact and accurate as possible and iii) the graphical quality should
be acceptable, even with low graphics hardware resources. The mentioned representation was implemented
in the frame of a research project, allowing the evaluation of the architecture with some results presented in
this paper. The results confirm the hypothesis that the current implementation simulates low and medium
complexity models synchronously. More complex models require some tuning of the simulation parameters
in order to be correctly simulated.
1 INTRODUCTION
One of the principal industries to experiment the
advantages of the new computer revolution is the
machine tool workshop. New techniques, control
systems and computerized aids are used by leading
CNC companies to embed more information to the
user and in the meantime to foresee potential
mistakes or even dangerous operations as the pieces
manufactured are in most cases sharp steel objects
that must be handled with extreme caution.
The user nowadays is able to simulate the CNC
program with an outstanding efficiency, resembling
real behaviors with no material waste at all. The
possibility to try different approaches to a piece
manufacture is very interesting as well.
However, for the developer of the CNC system, a
good graphical output (3D real-time representation
of the manufactured object) constitutes a very
expensive development as their principal focus is the
hardware.
Almost every company buys a 3D representation
kernel and provides the simulation and real-time
manufacturing operation as a separate add-on to the
machine.
The 3D kernel used in the simulation of the
manufactured object, provides a set of functions and
possibilities that allows the CNC machine developer
357
Moreno A., Toro C., Arizkuren I., Segura A., Posada J., Novo M., Falcón J. and Alcaín N. (2006).
A GEOMETRIC REPRESENTATION FOR THE REAL-TIME SIMULATION OF NC MACHINING PROCESSES.
In Proceedings of the First International Conference on Computer Graphics Theory and Applications, pages 357-363
DOI: 10.5220/0001351503570363
Copyright
c
SciTePress

to show a simulation or real-time action in the CNC
machine workshop.
However, 3D kernels are expensive and only
accessible through a very closed interface which in
many cases is not powerful enough to show the
machine’s potential.
In the scope of the SIMUMEK research project
(Moreno, 2004), we have worked together with a
CNC producer and a NC simulation software
company to test different simulation approaches in a
general framework. The main result of the project is
a low cost NC simulation kernel capable to deal with
different types of machine operations like multi axis
milling, classical lathe (2 ½ DOF) and C-axis lathe.
The obtained simulation kernel is generic and has
been tested with several simultaneous cutters.
In this paper we will address directly the results
obtained from this research project where the most
critical restrictions are:
• There is no previous knowledge of the CNC
machine code.
• The NC machine gives the tool movements as
tool positions, sampled every few milliseconds.
• The graphical system must run in real-time
while the real machine is performing the piece
cut.
This paper will be presented ad follows:
In chapter 2 a brief state of the art is reviewed
not intending to be an extensive study of the actual
techniques but to introduce the non familiar reader
to some of the technical terms used along the paper.
In chapter 3, the internal algorithms of the
simulator are described, focusing in the geometrical
representation and its usage.
In chapter 4, the efficiency results from the
geometrical representation and the simulation test
are shown.
Finally, the conclusions and the future work are
exposed.
2 STATE OF THE ART
The NC machining simulation using computer
graphics techniques is a widely extended research
topic.
Some traditional approaches do not store the
geometrical information during the simulation, but
they simply modify the drawing screen using an
image-based approach.
There are solutions that store in the computers
memory the intermediate result, having an internal
3D geometric representation of the object that is
changed dynamically during the simulation. This
allows a permanent representation and point of view
independency of the object, better geometric
accuracy control, collision detection, etc.
Van Hook (Van Hook, 1989) used an extended
Z-buffer data structure (called a Dexel structure) for
the graphical verification. In his paper he presented a
scan method to convert surface data into his Dexel
(depth element) structure, and to store Z values for
the nearest and the farthest surface at each Dexel.
This technique has been extended by several authors
(Zhu, 2004).
Another traditional CG techniques for the
geometric representation include i) B-Rep ii) CSG,
and iii) Hierarchical Space Decomposition.
Although B-Rep is the most used method for the
solid modeling in modern CAD systems, its
straightforward use for machining simulation is
mainly impaired by the long time required for
simulation (Spence, 2001). A similar problem occurs
with CSG representation, with computational costs
of order O(n
2
), where n is the number of primitives
(Stewart, 2003) being computationally expensive.
To cope with the complexity of the problem and
the long time required in these approaches, the
approximation of the exact geometry, and especially
the partitioning of the object in suitable regions has
been proposed by several authors (Stewart, 2003).
The most classic technique for volume
partitioning is the voxel representation (classical
octree, extended octree (Brunet, 1990), SP-Octree
(Cano, 2002)) that combines the space partitioning,
solid representation and boolean operation support
in a single definition.
Maeng et al (Maeng, 2003) have used the Z-map
scheme, where the work piece is approximated as a
set of z-axis aligned vectors, that restricts the
application to the 3-axis NC machining.
The level (or slice) based representation is
widely used in the computer assisted telemedicine to
generate 3D models from 2D layers (scanners,
CATs) (Fujimori, 2004). However, the support for
true real time visualization is not easily
accomplished.
In this paper, we present a level-based solid
representation. Although some similarities can be
found with the level approximation of the
telemedicine area, the main difference of this work
is the orientation towards boolean operations.
3 PROPOSED REPRESENTATION
In this chapter, we will introduce the simulator
components. For a deeper explanation about the
GRAPP 2006 - COMPUTER GRAPHICS THEORY AND APPLICATIONS
358
high-level architecture and the module definition, we
refer the reader to (Moreno, 2004).
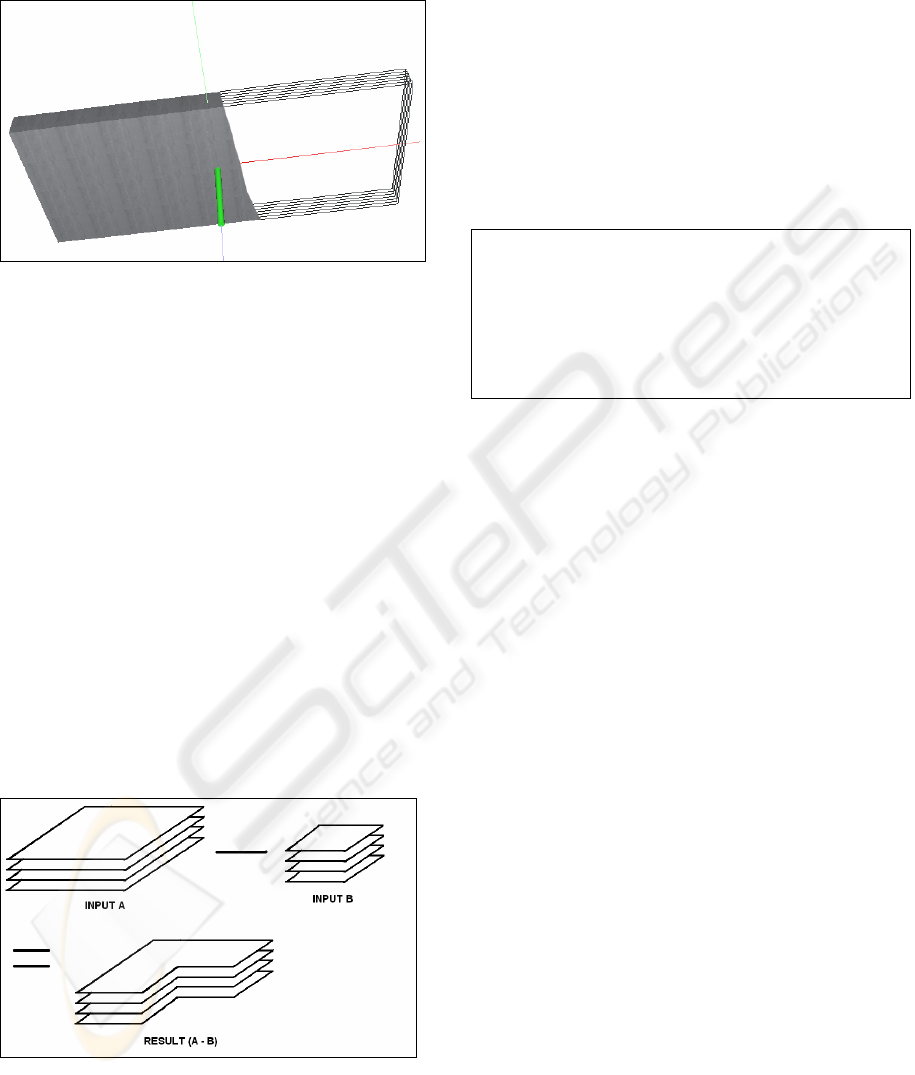
Figure 1: A LBR parallelepiped is shown in solid mode
(left) and its approximation in levels (right).
3.1 Boolean Operation Support
The chosen geometrical representation for the
machined objects is a level-based representation,
consisting of using a set of parallel levels to
represent the 3D object. Each level is a set of non-
intersecting and coplanar polygons with at least
three vertices. The distance between the levels is
defined as ∆ and it defines the maximum detail that
can be perceived. We call LBR (Level-Based
Representation) this representation and LBR object
to the object represented using the LBR
representation (see Figure 1).
The LBR representation provides a direct way to
perform boolean operations between LBR objects: a
3D boolean operation is simplified in a set of 2D
boolean operation between two 2D polygons, that is
a well reviewed research topics (Vatti, 1992),
(Preparata, 1985) (see Figure 2).
Figure 2: A boolean operation example between 2 LBR
objects.
3.2 Spatial Partitioning
The efficiency of the polygon clipping algorithms
depends directly on the total number of contours and
points involved in the boolean operation (Leonov,
1998):
O(n log*n + k + z log n) (1)
where n is the number of edges (points), z is the
number of contours and k is the number of edges
intersections.
Table 1: Pseudo Code algorithm for the boolean operation
between the stock and the tool (LBR Objects).
OpBool (in-out LBR_Object stock, in LBR_Object sweep)
for-each section S in both objects
for-each level L in the section S
stock[S][L]=PolygonClip2D (stock[S][L], sweep[S][L])
end for-each
end for-each
As the simulation is performed, the working piece
gets more complex and in consequence, the number
of points and contours grows. In order to limit the
number of points and contours that would increase
the boolean operation time, a high-level partitioning
system is added to the object definition.
This spatial partitioning decomposes the objects
into a set of smaller regions, each of them being a
set of parallel levels, as it was exposed previously.
Putting all this together, the boolean operation
pseudo-algorithm is shown in Table 1.
3.3 Performance
The overall computational cost is reduced since the
classical boolean operation between geometrical
objects is O(n
4
) (Poutrain, 2001) and this approach
reduces the computational cost to O(n*m) where n is
the number of levels and m is the number of
contours of the levels.
3.4 Model Reconstruction
The rendering of the LBR objects requires the
reconstruction of the set of levels. These levels must
be joined together in order to obtain a 3D polygonal
object. This process is called model reconstruction.
Several authors have solved this problem from a
non-real time point of view. For example, the use of
marching cubes techniques (Nielson, 2003) is one of
the most widely used techniques for the
A GEOMETRIC REPRESENTATION FOR THE REAL-TIME SIMULATION OF NC MACHINING PROCESSES
359
reconstruction of polygonal meshes from a set of
3D contours.
But due to its computational cost, the marching
cubes technique is not suitable for a real-time
material removal simulator.
In order to exploit the temporal and spatial
coherency of the machined object, two consecutive
levels are joined with a set of polygons only if every
contour knows with which contour has to be joined
in the next level (see Figure 3a).
This connectivity information is achieved during
the simulation process, since all the contours are
generated by known tool movements. The
movement identifier is used to determine which
contours must be joined to reconstruct the object.
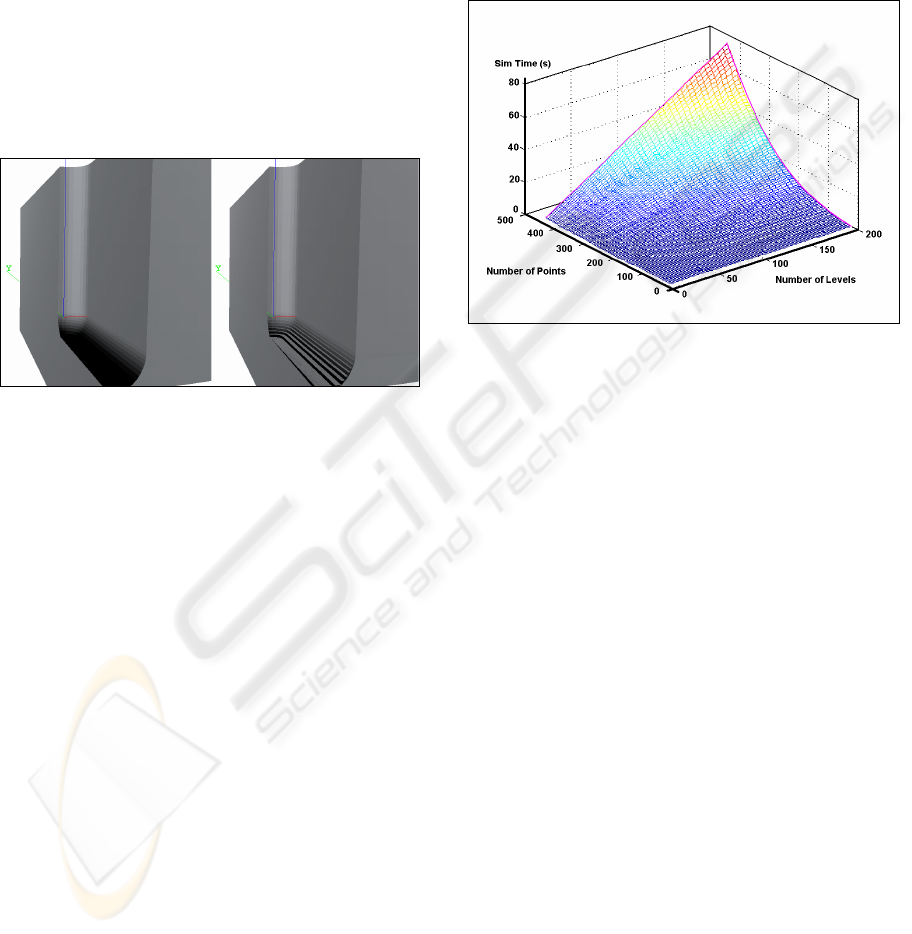
Figure 3: A LBR solid mechanized with a ball-end tool.
Rendered a) joining consecutive levels, and b) extruding
each level towards the next one.
There exist cases and special conditions where a
level contour can not be joined with any other. This
is specially noticeable when the tool passes several
times by the same area or when the number of inner
contour are so complex, that it is uncertain how to
join them. In these cases, there is not enough
information to reconstruct that object portion or slice
so a special and simpler algorithm is used. This
algorithm extrudes a level perpendicularly towards
the next one (see Figure 3b), but the quality of the
graphical output decreases.
The combination of both algorithms makes
possible the rendering of level-based represented
objects at interactive frame rates, even during the
simulation process. Applying visualization
techniques, the reconstruction is performed in those
elements (regions and levels) that are visible,
optimizing the number of triangles sent to the
graphical API (OpenGL in our case).
4 RESULTS
In order to test the efficiency of the presented solid
representation, we have chosen two different
approaches: i) the behaviour of the LBR boolean
operation depending on the number of levels and
regions, and ii) the simulation times when the
simulator is running under final conditions.
Figure 4: A 3D graphic where the axis are: Simulation
time (Y), number of Points (X) and number of Levels (Z).
The simulation time measures the execution time
performing a single 3D boolean operation between two
LBR solids with the given points and levels and a single
region.
The first test set is oriented to study the
computational cost in a single 3D boolean operation
between two LBR solids (see Figure 4) varying the
number of points and the number of levels for a
given set of boolean operation.
The main conclusions deduced from the results
confirms the theory. The number of levels increases
the computational effort in a linear way (each level
has to execute an internal 2D boolean operation) and
the number of points following a non-linear
function, due to the 2D boolean operation cost (see
formula 1).
GRAPP 2006 - COMPUTER GRAPHICS THEORY AND APPLICATIONS
360
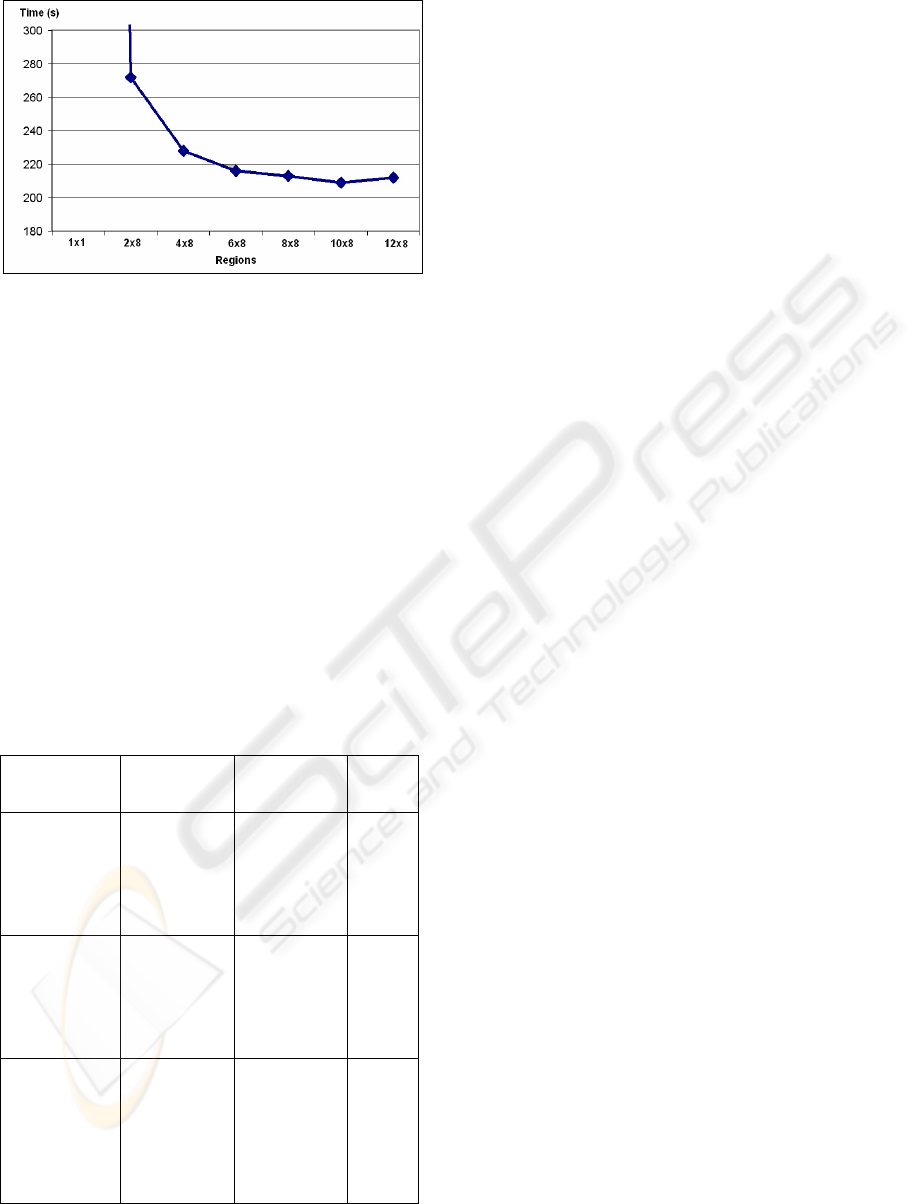
Figure 5: A 3D Number of Regions Efficiency. The same
model has been executed with different number of regions.
In this example, the optimal number of regions is a 10 x 8
decomposition.
The next test set studies the simulation time
behavior varying the number of regions of a single
LBR solid (see Figure 5). Seeing the results, it is
noticeable that, if the number is low, the
computational cost is high. As the number of regions
increases, the computational cost falls till an upper
limit is reached. Going further this limit does not
improve the efficiency, but it worsen it.
Table 2: Simulation times for three test models with
different complexity varying the number of regions. The
factor is calculated dividing the given time with the real
machining time. The complexity of each model is a
subjective qualifier and it is intended to classify the
models in easy and difficult models, depending on the
achieved results after some number of simulations.
This lead us to a uncertain problem: how to
decide the number and distribution of the regions. In
the presented table, the optimal value is different
from each other, so there is no global optimal value.
A workaround for this problem is to classify the
models in different types, each one with common
properties. It is expected that similar models have
similar number of regions as optimal value. Then,
during the simulator initialization, the user informs
the model type he is going to simulate and
internally, the pseudo-optimal values are chosen. We
refer the reader to the future work to see what is
planned to solve definitively this problem.
The final test set is focused in the runtime
efficiency and the synchronization between the
simulator graphical output and the real NC machine
feedback. Different models has been tested in the
simulator and the times of three of them has been
tabulated in Table 2.
The synchronization is achieved when the
simulation time and the machining time are similar.
For testing purposes, we have considered that five
seconds delay is the proper limit to considerate that a
model has been simulated properly. Following this
criterion, just two complex models don’t complain
with the requirements (see third row in Table 2 to
see the details of one of them). The other models
have been correctly simulated.
The results show that with small and medium NC
programs, a synchronized simulation is achieved,
obtaining an interactive visualization and a quite
good graphical output. The reader must take into
account that the graphical hardware is limited (12”
monitor with 800x600 resolution (max)).
With complex models, the simulator becomes
sensible to the initial parameterization. In the tests,
the perfect synchronization has been achieved, but
several preliminary test have been performed in
order to set the proper initial parameters. This
simulator problems will be solved in the future (see
future work section for more details).
5 CONCLUSIONS
The main goal of this work was to present how a
level-based representation is used as the kernel of a
material removal simulator, being able to achieve
real time execution when it is used embedded in a
real NC machine (see Figure 6).
The results in chapter 4 confirm that a proper
real-time simulation is achieved with interactive
rates and a sufficient image quality taking into
Model
(Complexity)
Num
Regions
Simulation
Time (s)
Factor
Test-1
( Low )
1x1
2x2
4x2
8x2
Real Mach.
1740 301
221 174
170
10.2
1.7
1.3
1.02
1.0
Test-2
( Medium )
1x1
2x4
4x8
8x16
Real Mach.
2020 228
211 305
210
9.6
1.10
1.01
1.45
1.0
Test-3
( High )
1x1
4x2
8x4
8x8
16x16
Real Mach.
4215 920
509 470
554 450
9.3
2.04
1.13
1.04
1.23
1.0
A GEOMETRIC REPRESENTATION FOR THE REAL-TIME SIMULATION OF NC MACHINING PROCESSES
361
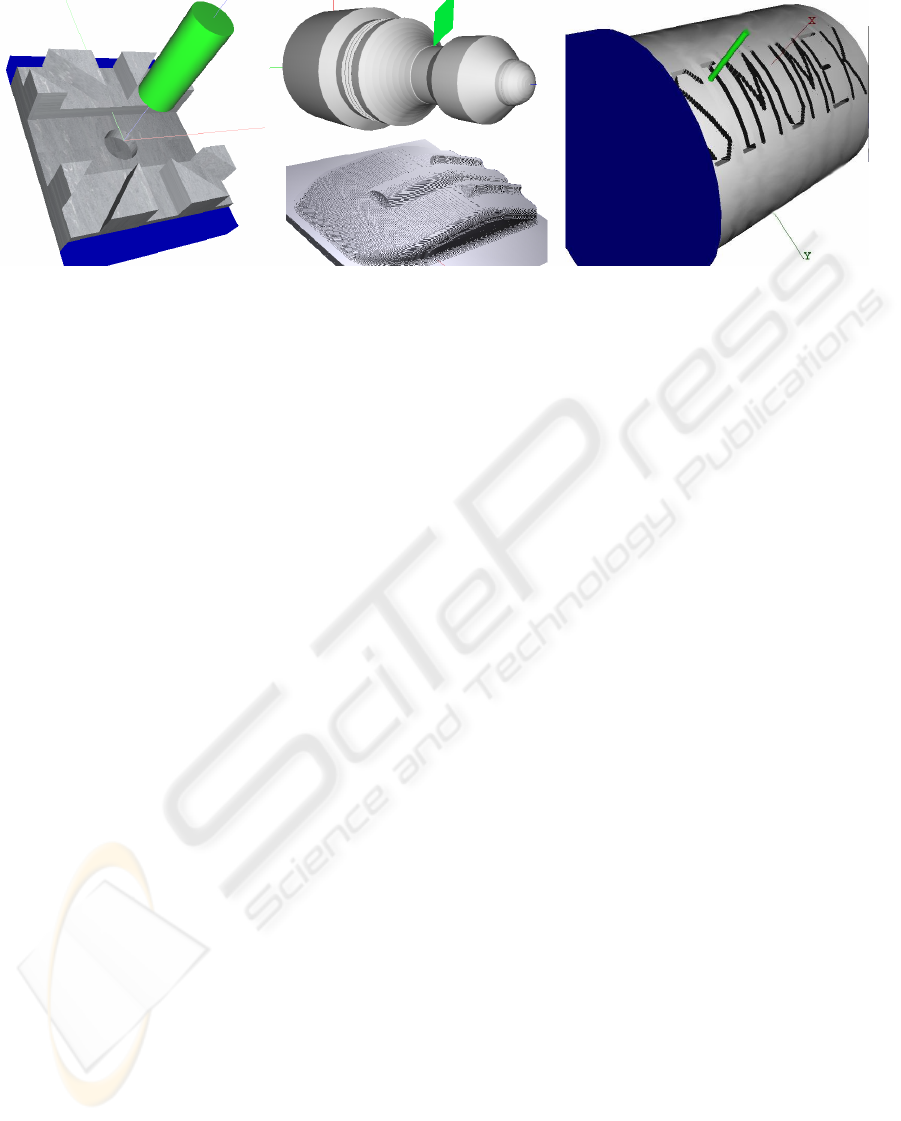
Figure 6: Some simulation results. From left to right: 2D milling, 2.5D lathe, 3D milling and C-axis lathe.
account that the available hardware resources are
limited.
The hardware employed for all the tests is an
AMD K6 1500 processor with a GForce 2 with
32Mb and a 800 x 600 resolution. The NC machine
is a 8070 CNC from Fagor Automation.
6 FUTURE WORK
In order to achieve the best efficiency of the
simulator, the optimal parameter values must be
chosen depending on the concrete NC program that
will be executed. This setup is estimated a priori and
a profile list is created with the pseudo-optimal
parameter values for each simulation type.
This strategy has a big problem. There will be
operations that will not be simulated as expected,
with the need of changing the simulation parameters.
Other related problem is that the chosen parameter
values are static along a simulation, being
impossible to change them if it is necessary.
The addition of a predictive control to the
simulation core is the solution for this kind of
problems. It will monitor some variables, modifying
the simulation parameters following a small set of
rules. We have to define which are the variables that
will be monitored, the rules that are applied and the
which variables will be updated. Each variable
changing action is associated with one action and its
computational cost. The action will be executed if it
worth, speaking in computational cost terms.
Increasing the NC machine hardware
capabilities, a more sophisticated visualization
rendering should be added to the simulation
pipeline. This would improve the achieved graphical
output, increasing the realism of the simulator. For
example, we are planning to use shading techniques
for the global illumination and to modify the texture
of the working piece with heat dependent color.
ACKNOWLEDGMENTS
This work is sponsored by the Basque Government
under INTEK program. The authors would like to
express their gratitude to the SIMUMEK partners
(FAGOR Automation S. Coop, SOME Sistemas
Informaticos and Alecop, S. Coop) for their
collaboration.
REFERENCES
Brunet, P., Navazo, I., 1990, Solid representation and
operation using extended octrees. In ACM
Transactions on Graphics 9, 2 (1990), pp. 170-197.
Cano, P., 2002, Representation of polyhedral objects using
sp-octrees. In Journal of WSCG 10, 1 (2002), pp. 95 -
101.
Fujimori, T., Suzuki, H., Kobayashi, Y., Kase, K., 2004,
Contouring medial surface of thin plate structure
using local marching cubes. In Shape Modeling
Applications, 2004. Proceedings 2004 pp. 297 – 306.
Leonov, M. V., 1998, Implementation of boolean
operations on sets of polygons in the plane. In BS
Thesis (in Russian), Novosibirsk State University,
1998.
Maeng, S. R., Baek, N., Shin, S. Y., Choi, B. K., 2003, A
fast Z-map update method for linearly moving tools. In
CAD, 35(11):995-1009, 2003.
Moreno, A., Toro, C., Arizkuren, I., Segura, A., Posada,
J., 2004, Development of an advanced 3d graphic
simulation system for milling and lathe CNC
machining, Topics 16, 4 (2004), p. 23.
Nielson, G. M., 2003, On marching cubes. In
Visualization and Computer Graphics, IEEE
GRAPP 2006 - COMPUTER GRAPHICS THEORY AND APPLICATIONS
362

Transactions on Volume 9, Issue 3, July-Sept. 2003
pp. 283 - 297.
Poutrain, K., Contensin, M., 2001, Dual B-Rep-CSG
collision detection for general polyhedra. In Computer
Graphics and Applications, 2001, Proceedings. Ninth
Pacific Conference on 16-18 Oct. 2001 pp. 124 - 133.
Preparata, F. P. , Shamos, M. I., 1985, Computational
Geometry: An Introduction. Springer-Verlag, New
York, NY, 1985.
Spence, 2001, Parallel processing for 2-1/2D machining
simulation. In Proceedings of the sixth ACM
symposium on Solid modeling and applications, 2001,
Ann Arbor, Michigan, United States Pages: 140 - 148.
Stewart, N., Leach, G., John, S., 2003, Improved CSG
Rendering using Overlap Graph Subtraction
Sequences. In International Conference on Computer
Graphics and Interactive Techniques in Australasia
and South East Asia - GRAPHITE 2003, pp. 47 - 53.
Van Hook, 1986, Real Time shaded NC Milling Display.
SIGGraph86, Volume 20, Number 4, pp. 15 - 20.
Vatti, B. R., 1992, A Generic Solution to Polygon
Clipping. In Commun ACM 35 1992, pp. 56 - 63.
Zhu, W., Lee, Y., 2004, Product prototyping and
manufacturing planning with 5-DOF haptic sculpting
and dexel volume updating. In Haptic Interfaces for
Virtual Environment and Teleoperator Systems 2004
(HAPTICS '04). Proceedings, pp. 98-105.
A GEOMETRIC REPRESENTATION FOR THE REAL-TIME SIMULATION OF NC MACHINING PROCESSES
363
