
DETECTION THRESHOLDING USING MUTUAL INFORMATION
Ciar
´
an
´
O Conaire, Noel O’Connor, Eddie Cooke, Alan Smeaton
Centre for Digital Video Processing
Adaptive Information Cluster
Dublin City University, Ireland
Keywords:
thresholding, mutual-information, fusion, multi-modal.
Abstract:
In this paper, we introduce a novel non-parametric thresholding method that we term Mutual-Information
Thresholding. In our approach, we choose the two detection thresholds for two input signals such that the
mutual information between the thresholded signals is maximised. Two efficient algorithms implementing our
idea are presented: one using dynamic programming to fully explore the quantised search space and the other
method using the Simplex algorithm to perform gradient ascent to significantly speed up the search, under the
assumption of surface convexity. We demonstrate the effectiveness of our approach in foreground detection
(using multi-modal data) and as a component in a person detection system.
1 INTRODUCTION
The selection of thresholds is an important task in
computer vision and detection systems. A threshold
set too high will result in many missed detections; set
too low, there will be many false positives. A fixed
threshold may not perform well if the properties of the
scene or environment change. For example, the same
threshold is unlikely to be optimised for both daytime
and night time scenes. By dynamically adapting the
threshold to cater for different scenarios, these limita-
tions can be addressed.
Research on dynamic (or adaptive) thresholding
is extensive. The most common approach is to ob-
serve the signal’s properties and to determine the best
threshold to suit these properties. Signal histogram
based methods have generated much interest (Otsu,
1979) (Kapur et al., 1985) (Rosin, 2001). The spatial
distribution of the signal and noise has also been used
(Rosin, 1998). Another similar approach is to per-
form a clustering of signal values, for example, using
K-means (Duda et al., 2001), and to choose a thresh-
old to separate some of the clusters. Our approach is
different in that we do not observe the properties of a
single signal, but observe how the choice of threshold
will affect its relationship with another signal.
Mutual information has been used in computer vi-
sion and machine learning for various applications,
including data alignment (Viola, 1995), particularly
in medical imaging (Pluim et al., 2003). The fusion
of object detector outputs (Kruppa and Schiele, 2001)
and feature selection for classifier training (Peng
et al., 2005) are also applications where mutual in-
formation has proven useful.
In this paper, we introduce a novel non-
parametric thresholding method that we term Mutual-
Information Thresholding. In our approach, the two
detection thresholds for two input signals are selected
so that the mutual information between the thresh-
olded signals is maximised. This encourages high
agreement between detectors, as well as high infor-
mation content. We describe two efficient implemen-
tations of this approach: one using dynamic program-
ming to perform a full-search on the threshold-pair-
space, and another more efficient approach using the
Simplex (Nelder and Mead, 1965) gradient ascent to
find the optimum solution, with the assumption of sur-
face convexity.
The paper is organised as follows. We introduce
our thresholding algorithm in section 2 and provide
two efficient implementations in section 3. Section
4 shows the results of using our approach for fore-
ground detection in multi-modal video sequences and
on pedestrian detection in thermal infrared images.
We conclude in section 5 with a summary of the paper
and note some potential areas for future research.
408
Ó Conaire C., O’Connor N., Cooke E. and Smeaton A. (2006).
DETECTION THRESHOLDING USING MUTUAL INFORMATION.
In Proceedings of the First International Conference on Computer Vision Theory and Applications, pages 408-415
DOI: 10.5220/0001368404080415
Copyright
c
SciTePress

2 PROPOSED ALGORITHM
There are generally two ways in which different data
sources are combined. One approach is to create a
new data representation, providing a better platform
from which to perform analysis. Examples of this in-
clude linear combinations of the data, fusion using the
max or min operator, or other non-linear combina-
tions. The other common approach is that the analysis
(such as thresholding) is performed separately on both
sources of data and results are subsequently combined
(using a binary operator, such as AND or OR, for ex-
ample). Our novel method is to perform the analysis
on both sources of data simultaneously and to use in-
formation from each source to assist the analysis of
the other. In this way, we obtain results from two sep-
arate sources, but enhanced by each other. We thresh-
old two signals, choosing the thresholds so that the
mutual information between the two thresholded sig-
nals is maximised.
Formally, we describe our algorithm as follows.
We define a detection score as a confidence mea-
sure that indicates the presence or absence of an
event when it has a high or low value respectively.
Given two sets of detection scores, X and Y , with
X = {x
1
,x
2
, ..., x
N
} and Y = {y
1
,y
2
, ..., y
N
}, that
are aligned (spatially and temporally), we can choose
thresholds, T
X
and T
Y
, to decide whether the event
was present at a particular point, according to each
set. By thresholding each set, we obtain the event de-
tection sets, X
and Y
, with X
= {x
1
,x
2
, ..., x
N
}
and Y
= {y
1
,y
2
, ..., y
N
}.
x
i
=
1 if x
i
≥ T
X
0 otherwise
(1)
y
i
=
1 if y
i
≥ T
Y
0 otherwise
(2)
These thresholds, T
X
and T
Y
, are chosen so as to
maximise the mutual information between the distri-
butions of X
and Y
, expressed as
I(X; Y )=
u∈{0,1}
v∈{0,1}
p
xy
(u, v)log
p
xy
(u, v)
p
x
(u)p
y
(v)
(3)
where p
xy
(u, v) is the probability that x
i
= u and
y
i
= v, p
x
(u) is probability that x
i
= u and p
y
(v)
is the probability that y
i
= v. In most applications,
these probabilities are easily computed by counting
occurances and dividing by N.
Choosing the thresholds in this way leads to two
desirable benefits. Firstly, it encourages agreement
between the two detection sets, so that they often
agree on whether the event has been detected or not.
Secondly, it leads to high information content (or
entropy). Without this constraint, agreement could
be maximised by setting the thresholds very high
(or very low) but the detectors would always re-
turn the same answer, regardless of the data they are
analysing.
2.1 Fusion
After thresholding, one is left with two binary maps.
If a single map is required, these results need to be
fused in some way to obtain the final decision for
each event. One method is to use a binary operator,
such as AND or OR, to combine the maps. An ap-
proach which is more robust against noise is to use
the spatial information to determine the local support
of each event. Support can be defined, for example, as
the number of neighbouring events that have the same
value as the central event. If the maps disagree on a
detection result, the result with the greater support can
be used. This is very effective at removing isolated
noise. If the support values are equal, this could be
an example of an object which is undetectable in one
modality, such as a room-temperature bag using ther-
mal infrared. Depending on the application, this dis-
agreement could provide additional semantic knowl-
edge.
3 EFFICIENT
IMPLEMENTATION
Every pair of thresholds used on two signals will pro-
vide a corresponding mutual information (MI) value.
By computing the MI value for every pair of thresh-
olds, a MI surface is obtained. In this section, we
present two methods to maximise the MI value. The
first method is to use dynamic programming to com-
pute the entire MI surface using all pairs of thresholds
(chosen from two discrete sets). The second method
is to use the simplex algorithm and perform gradient
ascent to find the maximum MI value, under the as-
sumption of surface convexity.
3.1 Full Surface Mapping
A brute-force approach to computing the MI surface
involves iterating over all pairs of thresholds (chosen
from two discrete sets), using them to threshold both
signals, then computing the MI between the thresh-
olded signals. If T
c
thresholds are tried for each sig-
nal, this results in T
2
c
pairs and a computation in the
order of O(T
2
c
N), where N is signal size (e.g. the
number of pixels in an image). The dynamic pro-
gramming algorithm we describe achieves the same
results in time O(T
2
c
+ N ).
DETECTION THRESHOLDING USING MUTUAL INFORMATION
409

Firstly, we denote A = {a
1
,a
2
, ..., a
P
} as the set
of thresholds we wish to evaluate for the first sig-
nal and B = {b
1
,b
2
, ..., b
Q
} as the set of thresh-
olds we wish to evaluate for the second signal. Next,
we note that equation (3) requires the four values
for p
xy
(u, v), with u, v ∈{0, 1}. p
x
(u) and p
y
(v)
can be obtained from these values (e.g. p
x
(1) =
p
xy
(1, 0) + p
xy
(1, 1)). Each of these four values
are computed by counting the number of occurances
where x
i
= u and y
i
= v, then dividing by the
total number of values, N. Therefore, we wish to
compute these four counts for each pair of thresh-
olds we wish to evaluate. We denote the counts as
C
u,v
(a
i
,b
j
), which equals the number of occurances
where x
i
= u and y
i
= v, when the thresholds are
set at T
X
= a
i
and T
Y
= b
j
. Initially the counts
are all set to zero. For each data point we have the
values x
k
and y
k
. From these values, we can deduce
that C
0,0
(a
i
,b
j
) will be increased by one when both
a
i
>x
k
and b
j
>y
k
. Similarly, C
0,1
(a
i
,b
j
) will be
increased by one when both a
i
>x
k
and b
j
≤ y
k
.
Count maps C
1,0
and C
1,1
have similar rules. For
each data point, we could increase the counters in
each map by iterating over all thresholds that should
be increased. A faster method is to store markers at
the positions in the map where the count increases and
integrate afterwards. This is a similar, complemen-
tary technique to the standard dynamic programming
method used in (Viola et al., 2003) to quickly find
the sum of all pixels in a rectangular area of an im-
age. The pseudo-code describing how to update the
count maps for a data-point is shown in figure 1. Fi-
nally, we integrate the counts horizontally, as follows:
C
u,v
(a
i
,b
j
) ← C
u,v
(a
i
,b
j
)+C
u,v
(a
i−1
,b
j
)
and then vertically,
C
u,v
(a
i
,b
j
) ← C
u,v
(a
i
,b
j
)+C
u,v
(a
i
,b
j−1
)
This array now stores, at location C
u,v
(a
i
,b
j
), the
number of occurances where x
k
= u and y
k
= v,
when the thresholds are set at T
X
= a
i
and T
Y
= b
j
.
Using the obtained values, this approach can be used
to compute the entire MI surface using equation (3).
3.2 Simplex Maximum Search
Although the MI surface is not guaranteed to be con-
vex, strong convexity was present in the vast majority
of types of data we have investigated. Any gradient
ascent method will be very computationally efficient,
compared to a full search, even using the above dy-
namic programming strategy. Using a gradient ascent
approach (such as the Simplex algorithm) also has the
advantage that the thresholds do not need to be quan-
tised into discrete values. Any full-search approach
will require a finite set of pairs of thresholds, therefore
demanding a quantisation of the values. This means
that the Simplex search finds a more precise optimum
Given: data point (x
k
, y
k
)
Find largest threshold a
i
such that a
i
≤ x
k
Find largest threshold b
j
such that b
j
≤ y
k
C
1,1
(a
1
,b
1
)++
C
1,1
(a
i+1
,b
1
) −−
C
1,1
(a
1
,b
j+1
) −−
C
1,1
(a
i+1
,b
j+1
)++
C
1,0
(a
1
,b
j+1
)++
C
1,0
(a
i+1
,b
j+1
) −−
C
0,1
(a
i+1
,b
1
)++
C
0,1
(a
i+1
,b
j+1
) −−
C
0,0
(a
i+1
,b
j+1
)++
Figure 1: Pseudocode for algorithm in subsection 3.1.
solution. Simplex (or another gradient ascent method)
can also be used efficiently for higher dimensional
thresholding. For example, if we wished to choose
P thresholds that would maximise the mutual infor-
mation between P thresholded signals, a full-search
would usually be unfeasible for P>2.
3.2.1 Initialisation and Scale
In order to use Simplex, the initial position and sim-
plex size needs to be specified. The choice of these
parameters may depend on the application. We pro-
pose to initialise Simplex in the following manner, as
it was deemed suitable for our target application of
video processing. In the first two video frames, a full
search is performed, using as fine a quantisation as is
possible within the time constraints. The thresholds
found using the full search can be used to initialise
the Simplex search in subsequent frames (i.e. The
thresholds found in the previous frame are used as the
starting position for the current frame). The simplex
size can be determined by setting it to be a fraction
(e.g. 10%) of the change in thresholds between the
first two frames. This size can be left fixed or adapted
to minimise convergence time. Alternatively, multi-
ple initialisation positions and scales can be evaluated
to choose the one that provides the greatest MI value.
3.2.2 Convexity Assumption
If there are multiple peaks in the MI surface, sim-
plex will not be guaranteed to find the global maxi-
mum. However, by initialising the simplex using the
thresolds of the previous frame, the temporal coher-
ence of the thresholds is enforced, rather than toler-
ating the thresholds jumping between two similarly
MI valued peaks. We also found that multiple peaks
were only likely to occur in two scenarios: either there
VISAPP 2006 - MOTION, TRACKING AND STEREO VISION
410

was a correlation between the detectors false posi-
tives/negatives or the signals did not share much mu-
tual information, in which case the peaks were caused
by noise.
3.2.3 Efficiency Analysis
In order to gauge how efficient the gradient ascent
approach is compared to the full-search, we calcu-
lated the number of iterations required to converge to
the correct foreground-detection thresholds for each
of 200 frames in a multimodal (thermal infrared and
visible spectrum) video sequence. We used a median
background image for both the visible and infrared
sequences. We initialised our simplex at 10 different
scales. In only two tests (out of 2000) did it converge
to a sub-optimum solution. This occurred at the two
smallest scales. We found that larger scales, in gen-
eral, required more iterations to converge, but were
more likely to converge to a more precise solution.
The average number of iterations to convergence was
26.72. When compared to a full-search, using 256
thresholds for each signal, the Simplex method is over
2400 times faster.
4 EXPERIMENTAL RESULTS
4.1 Foreground Detection
To test our algorithm, we used it to choose thresh-
olds for foreground detection for multi-modal (ther-
mal infrared and visible spectrum) video data. The
surveillance-type video was captured using the a joint
IR-Visible camera rig (
´
O Conaire et al., 2005). We
used the non-parametric background model described
in (Elgammal et al., 2000) to separately model the
colour and thermal background of the scene. For each
pixel, the models each return the probability that the
pixel belongs to the background. Since we used a lin-
ear quantisation of the threshold space, we got bet-
ter resolution by using the negative logarithm of the
probability. Specifically, we used min(−log(p), 255)
in the foreground detection map for each pixel, where
p is the background probability. This spread out the
detection values (similar to histogram equalisation),
so that they were not all clumped into one bin.
Our tests were run on three multi-modal sequences
of approximately 850 frames each. Two were daytime
scenes and one was captured at night. In order to eval-
uate our approach to thresholding, we compare the
thresholds produced by our method to those produced
by Kapur thresholding (Kapur et al., 1985). Kapur
et al. also used an information theoretic approach to
thresholding. Using the signal’s histogram, their ap-
proach was to explain positive and negative detections
as two different signals and choose the threshold that
would maximise the sum of the two-class entropies.
In a comparison of thresholding methods (Rosin and
Ioannidis, 2003), Kapur thresholding was determined
to have the best all-round performance. The results of
our experiments are shown in figure 2.
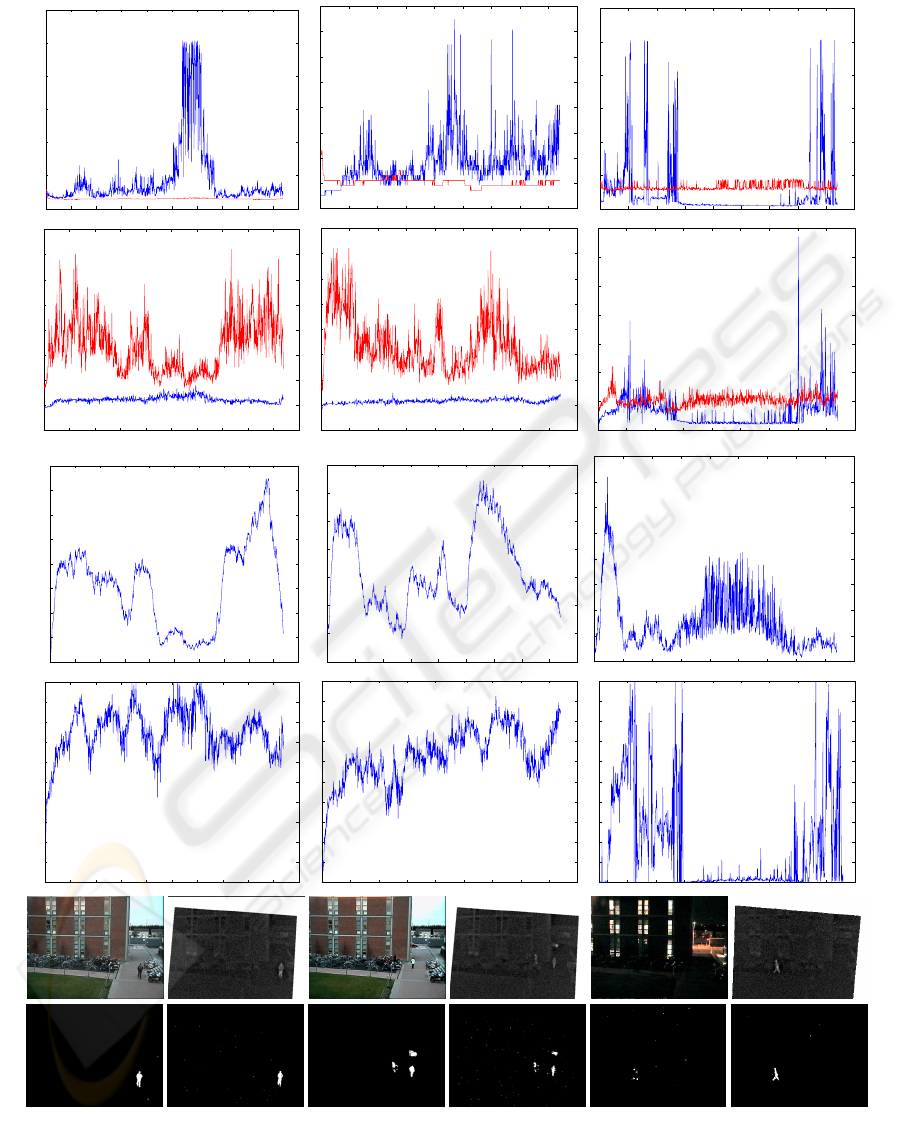
In the daytime scenes, there is strong mutual infor-
mation and the results are good. The Kapur thresholds
behave in exactly the opposite way to our approach.
While the Kapur threshold is very stable in the visible
spectrum, the MI threshold varies significantly. On
the other hand, the Kapur threshold is very unstable
in the infrared spectrum, the MI threshold is very sta-
ble. Our method seems to perform counter intuitively,
since the thermal infrared images are far noisier than
the visible spectrum. However, if one imagines two
well separated distributions, as is the case when there
is a high signal-to-noise ratio, then there is a wide
range of thresholds that would give very good perfor-
mance. In a noisy signal, the noise and signal are not
as well separated, so there is only a very narrow band
of thresholds that give the correct separation. This is
why our method has a very stable threshold for the
infrared images, as there is only a very narrow range
of values where the infrared agrees with the visible
spectum. The visible spectrum threshold, on the other
hand, can vary a lot without causing any performance
degradation, since the noise is so low.
In the night time scene, there is very little mu-
tual information between the visible and infrared fore-
ground maps. Pedestrians are practically undetectable
in visible spectrum images. This leads to a low value
at the MI surface peak and poor thresholds for both
modalities. The MI value itself can be used as a qual-
ity measure to determine the reliability of the thresh-
olds returned. However, the mutual information is de-
pendant on how much foreground is present, so we
therefore considered a more robust quality measure
that takes the foreground size into account. If we
compute f , defined as the fraction of all pixels that
both maps agree is foreground, then the highest possi-
ble MI value is M
max
= −f log(f )−(1−f ) log(1−
f). By dividing the obtained MI score by M
max
,
we obtain a quality (or reliability) measure of the re-
turned thresholds. This quality score was computed
for all sequences and is shown in figure 2(d).
Future work will involve determining how to cater
for scenarios where the threshold quality score is low.
This scenario could mean that one or both signals are
performing very poorly (such as the visible spectrum
in nighttime scenes), or that there is no mutual infor-
mation to utilise (such as when there are no objects or
people in the scene). One approach could be to revert
to using a single-band thresholding method for each
signal (such as Kapur). Another approach might be to
use the motion information in each of the modalities.
DETECTION THRESHOLDING USING MUTUAL INFORMATION
411
(a)
0 100 200 300 400 500 600 700 800 900 100
0
0
50
1
00
1
50
2
00
2
50
3
00
0 100 200 300 400 500 600 700 800 90
0
1
0
1
5
2
0
2
5
3
0
3
5
4
0
4
5
5
0
0 100 200 300 400 500 600 700 800 90
0
0
50
1
00
1
50
2
00
2
50
3
00
(b)
0 100 200 300 400 500 600 700 800 900 100
0
0
5
1
0
1
5
2
0
2
5
3
0
3
5
4
0
0 100 200 300 400 500 600 700 800 90
0
0
5
1
0
1
5
2
0
2
5
3
0
3
5
4
0
0 100 200 300 400 500 600 700 800 90
0
0
1
0
2
0
3
0
4
0
5
0
6
0
7
0
(c)
0 100 200 300 400 500 600 700 800 900 100
0
0
0
.005
0.01
0
.015
0.02
0
.025
0.03
0
.035
0.04
0 100 200 300 400 500 600 700 800 90
0
0
0
.005
0.01
0
.015
0.02
0
.025
0.03
0
.035
0 100 200 300 400 500 600 700 800 90
0
0
1
2
3
4
5
6
7
8
x 10
−3
(d)
0 100 200 300 400 500 600 700 800 900 100
0
0
0
.1
0
.2
0
.3
0
.4
0
.5
0
.6
0
.7
0
.8
0
.9
1
0 100 200 300 400 500 600 700 800 90
0
0
0
.1
0
.2
0
.3
0
.4
0
.5
0
.6
0
.7
0
.8
0
.9
1
0 100 200 300 400 500 600 700 800 90
0
0
0
.1
0
.2
0
.3
0
.4
0
.5
0
.6
0
.7
0
.8
0
.9
1
(e)
(f)
Figure 2: Comparison of our method to Kapur thresholding. Left and Centre columns are from daytime sequences. Right
column is from a night-time sequence. Rows correspond to: thresholds for (a)Visible Spectrum and (b)Infrared, (c)Mutual
Information, (d)Threshold Quality Measure, (e)Example frames from each sequence, (f)Example thresholded images using
our method. In rows (a) and (b), the Kapur thresholds are shown in red, our method’s thresholds are in blue.
VISAPP 2006 - MOTION, TRACKING AND STEREO VISION
412
(a) (b) (c) (d)
(e) (f) (g) (h)
(i) (j) (k) (l)
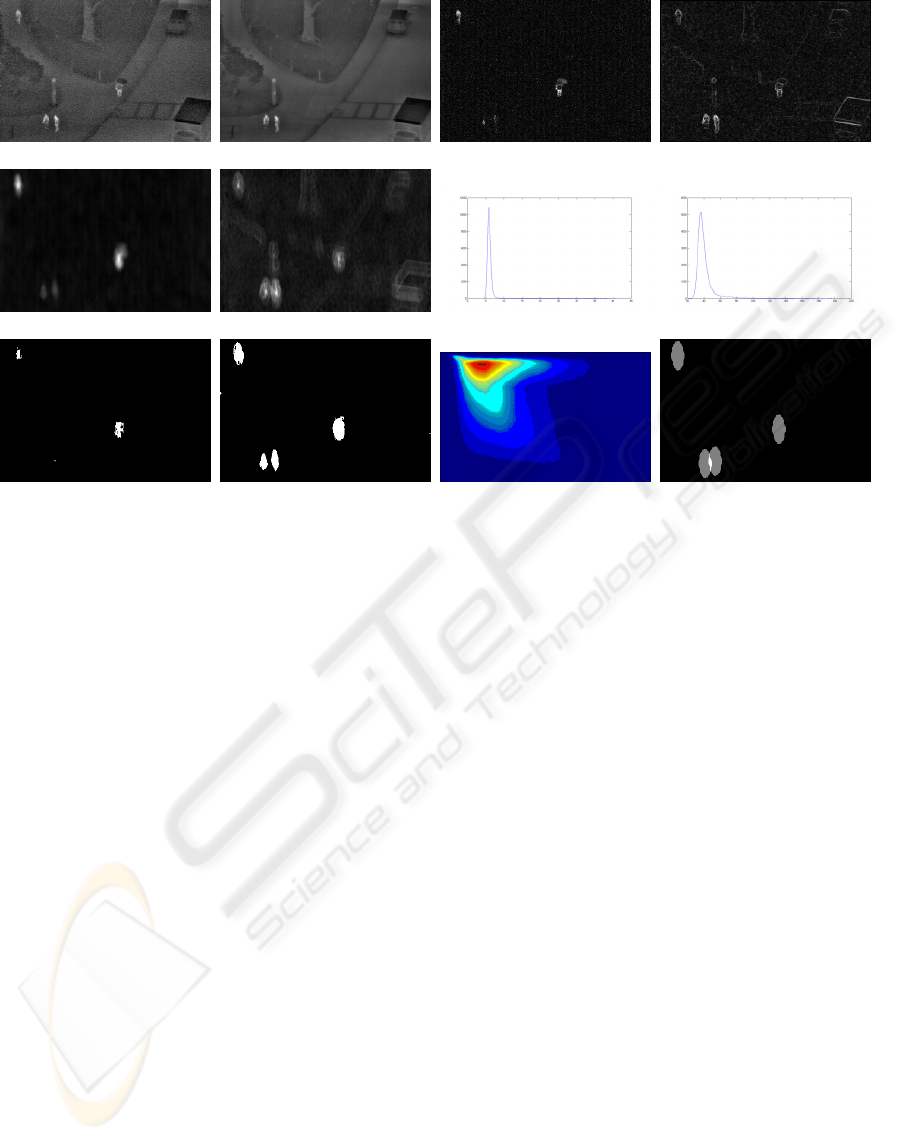
Figure 3: Person-detection example: (a)Current image, (b)Background image, (c)Background difference, (d)Image edges,
(e)Silhouette detection map, (f)Contour detection map, (g)Histogram of (e), (h)Histogram of (f), (i)Kapur thresholded result,
(j)Our method, (k)Mutual information surface, (l)Detected People.
4.2 Person Detection
To further test our algorithm, we incorporated it into
a person detection system and used the OSU Thermal
Pedestrian Database from the OTCBVS Benchmark
Dataset (Davis and Keck, 2005) to evaluate perfor-
mance. The database contains images of pedestrians
taken with a thermal infrared camera in a wide variety
of environments. Since our goal was to evaluate the
thresholding component of the system, the other com-
ponents were chosen to be as simplistic as possible.
The system worked as follows. First, the median
background image was computed. Then for each im-
age, two detectors were used: one based on pedestrian
contour and the other based on silhouette. The con-
tour detection map was obtained by convolving the
pedestrian contour template with the Sobel edges of
the image. The silhouette detection map was obtained
by convolving the pedestrian silhouette template with
the absolute difference image between the current im-
age and the background image. Thresholds for these
maps were obtained using our mutual information
thresholding algorithm (subsection 3.1). Pedestrian
regions were determined as all pixels that had above
threshold values in both maps. Next, each local max-
ima in the contour detection map within these regions
was paired with the closest local maxima in the sil-
houette detection map within these regions. Maxima
in the silhouette detection map were then paired with
the closest maxima in the contour detection map. Per-
son candidates corresponded to each pair of maxima,
from the two separate maps, that were both paired to
each other (i.e. they were both closest to each other).
Candidates were then evaluated according to the min-
imum description length principle, in respect to how
much of the pedestrian regions they could explain.
We use a pedestrian candidate template to evaluate the
fitness of each candidate by calculating the maximum
number of pedestrian-region pixels it overlaps with,
when centred on either maxima of the candidate. The
best candidate is considered a ‘true’ person and the
pedestrian region pixels it overlaps are removed. This
process continues until there are no remaining candi-
dates, or no candidate can explain more than a pre-
defined number of pixels (which was set at one tenth
of the template size).
We used the dynamic-programming full-search
thresholding algorithm and it performed well for al-
most all images. For some images, there were two
peaks in the MI surface. We speculate that this ex-
tra peak was due to the correlation between the noise
in both detection maps, since they were both derived
from the same image. This peak was usually smaller
than the correct peak but it was occasionally greater.
We catered for this scenario by evaluating all local
maxima in the surface and evaluating them in order
DETECTION THRESHOLDING USING MUTUAL INFORMATION
413

Table 1: The results of our pedestrian detection system on
the OTCBVS database are shown below.
Sequence People Precision Recall
1 91 0.95 0.98
2 100 0.95 0.98
3 101 0.87 1.00
4 109 0.94 1.00
5 101 0.92 0.96
6 97 0.98 1.00
7 94 0.93 0.99
8 99 0.97 0.99
9 95 1.00 1.00
10 97 0.92 0.98
Total 984 0.95 0.99
of descending MI score. We discarded peaks whose
thresholds produced binary maps with very high Euler
numbers (an Euler number of a binary image is the
number of regions minus the number of holes and can
be calculated quickly using local pixel information.
A high value indicates high noise). An example of
person detection is shown in figure 3. In this difficult
example, the two people, in the bottom left of the im-
age, have been standing in the same spot for the entire
sequence, so have been included in the background
image. However, the motion of the people leaves an
impression on the difference image and hence, on the
silhouette based detector map. Our method causes the
silhouette threshold to drop so that it agrees with the
strong detection in the contour-based detection map.
Kapur, on the other hand, sets the two thresholds inde-
pendently and therefore fails to detect all the people.
The results of our system are shown in table 1. They
are comparible to those obtained in (Davis and Keck,
2005).
5 CONCLUSION AND FUTURE
WORK
In this paper, we introduced a novel non-parametric
thresholding method that chooses two detection
thresholds for two input signals so that the mutual
information between the thresholded signals is max-
imised. We described two efficent implementations of
our algorithm using dynamic programming for a full-
search and Simplex gradient ascent for a faster search
with the assumption of surface convexity. We evalu-
ated our method by comparing it to a standard non-
parametric thresholding algorithm using multi-modal
video sequences. We also incorporated our method
into a person detection system and achieved good re-
sults using the publicly available OTCBVS pedestrian
database.
Our thresholding method works on aligned data so
can be used for local, as well as global threshold-
ing. It can also be used to threshold space-time slices,
such as groups of video frames. In these scenarios,
the window size is an important parameter: too small
and it may be sensitive to noise, too large and there
is a chance the signal properties have changed and a
global threshold would not be appropriate. Investigat-
ing how the window sizes should be set automatically
is an interesting area of further work.
Determining the types of data that can be used with
our method is another area for future studies. Sources
that are completely independent do not share any mu-
tual information and therefore are not suitable. On the
other hand, data sources that are linearly dependent
will produce thresholds equal to the median data val-
ues, as this maximises their mutual information. In-
dependence in the noise of both sources would seem
an important factor to ensure that good thresholds are
produced. The use of derivatives, such as edges, as a
second data source to select thresholds, has proven
useful, although it may violate the noise indepen-
dance criterion. Similarly, using two sources of data
that come from the same sensor (the red and green
colour bands, for example), may also violate this cri-
terion and produce multiple peaks in the MI surface.
In small-scale experiments for foreground detection,
using a combination of two colour bands, or using
the edges of the absolute difference map as a second
source, our method produced good thresholds, so fur-
ther testing is required to evaluate when these sources
might fail.
The results of our pedestrian detection system were
encouraging. However, the OTCBVS pedestrian data-
base does not contain much clutter, so a future system
will be tested on more difficult pedestrian data, using
multi-modal data we have captured.
Currently, our method does not consider spatial in-
formation or the proximity of pixels when choosing
the thresholds. Incorporating this information into our
method is another avenue of research to consider. For
example, the two parameters (low and high thresh-
olds) for hysteresis segmentation could be selected by
maximising the MI between the resulting segmenta-
tion and another source of data.
Finally, using this method on three or more sources
of data is another area for future investigation. The
quality measure we developed gives a estimate of the
reliabillity of the results and hence, this might be used
to make a system more robust against the failure of
one or more components, if it can quickly detect un-
reliability in the data sources. The combination of
three or more sources provides many interesting chal-
lenges, such as whether they should all be combined
simultaneously, or whether a pair-wise combination,
using the quality values returned, provides better per-
formance.
VISAPP 2006 - MOTION, TRACKING AND STEREO VISION
414

ACKNOWLEDGMENTS
This material is based on works supported by Science
Foundation Ireland under Grant No. 03/IN.3/I361
and sponsored by a scholarship from the Irish Re-
search Council for Science, Engineering and Tech-
nology (IRCSET): Funded by the National Develop-
ment Plan. The authors would also like to express
their gratitude to Mitsubishi Electric Research Labs
(MERL) for their contribution to this work.
REFERENCES
Davis, J. and Keck, M. (2005). A two-stage template ap-
proach to person detection in thermal imagery. In
Workshop on Applications of Computer Vision, vol-
ume 1, pages 364–369.
Duda, R. O., Hart, R. E., and Stork, D. G. (2001). Pattern
Classification. John Wiley & Sons, 2nd edition.
Elgammal, A., Harwood, D., and Davis, L. (2000). Non-
parametric model for background subtraction. In Pro-
ceedings of the 6th European Conference on Com-
puter Vision.
Kapur, J., Sahoo, P., and Wong, A. (1985). A new method
for graylevel picture thresholding using the entropy
of the histogram. Computer Graphics and Image
Processing, 29(3):273–285.
Kruppa, H. and Schiele, B. (2001). Hierarchical combina-
tion of object models using mutual information. In
BMVC.
Nelder, J. and Mead, R. (1965). A simplex method for func-
tion minimization. The Computer Journal, 7:308–
313.
´
O Conaire, C., Cooke, E., O’Connor, N., Murphy, N., and
Smeaton, A. F. (2005). Fusion of infrared and visible
spectrum video for indoor surveillance. In Interna-
tional Workshop on Image Analysis for Multimedia In-
teractive Services (WIAMIS), Montreux, Switzerland,.
Otsu, N. (1979). A threshold selection method from gray-
level histogram. IEEE Transactions on System Man
Cybernetics, 9(1):62–66.
Peng, H., Long, F., and Ding, C. (2005). Feature selec-
tion based on mutual information: Criteria of max-
dependency, max-relevance, and min-redundancy.
IEEE Transactions on Pattern Analysis and Machine
Intelligence, 27(8):1226–1238.
Pluim, J., Maintz, J., and Viergever, M. (2003). Mutual-
information-based registration of medical images: a
survey. IEEE Transactions on Medical Imaging,
22(8):986–1004.
Rosin, P. (1998). Thresholding for change detection. In
IEEE International Conference on Computer Vision,
pages 274–279.
Rosin, P. and Ioannidis, E. (2003). Evaluation of global im-
age thresholding for change detection. Pattern Recog-
nition Letters, 24(14):2345–2356.
Rosin, P. L. (2001). Unimodal thresholding. Pattern Recog-
nition, 34(11):2083–2096.
Viola, P., Jones, M. J., and Snow, D. (2003). Detecting
pedestrians using patterns of motion and appearance.
In IEEE International Conference on Computer Vision
(ICCV), volume 2, pages 734–741.
Viola, P. A. (1995). Alignment by Maximization of Mutual
Information. Phd thesis, Massachusetts Institute of
Technology, Massachusetts (MA), USA.
DETECTION THRESHOLDING USING MUTUAL INFORMATION
415
