
STATISTICAL TECHNIQUES FOR EDGE DETECTION IN
HISTOLOGICAL IMAGES
D. Svoboda†‡, I. A. Williams†, N. Bowring†, E. Guest§
†Department of Engineering and Technology, Manchester Metropolitan University Manchester M1 5GD
‡Centre for Biomedical Image Analysis, Faculty of Informatics,
Masaryk University Botanick
´
a 68a, 602 00 BRNO, Czech Republic
§School of Computing, Leeds Metropolitan University, Leeds LS1 3HE
Keywords:
Edge detection, Statistical, Histological images, Parametric and Non-Parametric tests.
Abstract:
A review of the statistical techniques available for performing edge detection on histological images is pre-
sented. The tests under review include the Student’s T Test, the Fisher test, the Chi Square test, the Kol-
mogorov Smirnov test, and the Mann Whitney U test. All utilize a novel two sample edge detector to compare
the statistical properties of two image regions surrounding a central pixel. The performance of the statistical
tests is compared using histological biomedical images on which traditional gradient based techniques are not
as successful, therefore giving an overall review of the methods, and results. Comparisons are also made to
the more traditional Canny and Sobel, edge detection filters. The results show that in the presence of noise
and clutter in histological images both parametric and non-parametric statistical tests compare well robustly
extracting edge information on a series images.
1 INTRODUCTION
Edge detection is a key process in many computer
vision and image understanding applications. It is
commonly understood how the edges in an image
are vital to region segmentation and object recogni-
tion processes. Therefore any process subsequent to
edge detection has its success directly dependent on
the effectiveness and the accuracy of the edge detec-
tion stage. This has led to the development of many
algorithms for edge and line detection, each with the
unified goal of producing the optimum results for a
range of applications and images.
Many of the early detectors developed are gradient
and therefore derivative based, for example Roberts,
Sobel, and Prewitt (
ˇ
Sonka et al., 1986). These original
detectors were shown to perform effectively on syn-
thetic images, or images with very little noise. Stud-
ies have since illustrated that when applied to images
with significant noise, clutter, or texture as is com-
mon with histological images, their performance is
found to diminish and significant spurious edges are
detected. To partially overcome this problem of addi-
tive noise within images (Canny, 1986) introduced an
analytical optimal step edge detector based on the first
derivative of a Gaussian filter. This reduced the pres-
ence of image noise by providing Gaussian smooth-
ing to the image prior to edge extraction, and there-
fore avoided to some extent the spurious effects of
noise previously observed. The control of the strength
of the Gaussian filter was dependent on the applica-
tion and introduced a measure of user subjectivity,
with the amount of smoothing acting as a user de-
fined threshold on the image edges produced. Canny’s
filter is still widely used for the detection of edge
information and is consequently seen by many as a
benchmark for comparative tests of new edge detec-
tion methods. This said, the use of Gaussian smooth-
ing prior to any edge detection can introduce edge lo-
calization problems due to the blurring nature of such
smoothing filters. This effect can be avoided through
the use of non-linear diffusion filtering (Perona and
Malik, 1990) as a pre cursor to any gradient based
edge detection technique.
As an alternative to these gradient based meth-
ods the problem of edge detection when applied to
the noisy images like the mouse atlas (MA) (Brune
et al., 1999) examples has been approached through
the use of statistical tests. The comprehensive analy-
sis of five such parametric and non-parametric sta-
tistical tests for the detection of edges and rib struc-
tures in X-Ray imagery was illustrated by (de Souza,
1983). Although the results presented in deSouza
use only a single dimension of the image in their
457
Svoboda D., A. Williamsâ
˘
A
˘
a I., Bowringâ
˘
A
˘
a N. and Guest E. (2006).
STATISTICAL TECHNIQUES FOR EDGE DETECTION IN HISTOLOGICAL IMAGES.
In Proceedings of the First International Conference on Computer Vision Theory and Applications, pages 457-462
DOI: 10.5220/0001377904570462
Copyright
c
SciTePress
analysis they are still significant to the application of
two dimensional image data. The work of (Bovik
et al., 1986) illustrated the theoretical use of many
non-parametric tests within a two dimensional im-
age corrupted with noise sampled at four different
orientations. This work although largely theoretical
and lacking in a comprehensive analysis of the re-
sults, did however evaluate the high computational re-
quirements incurred by such ranking statistical tests.
In spite of the computational cost being greater than
the derivative based detectors, similar parametric tests
were used effectively by (Beauchemin et al., 1998) to
overcome the low signal to noise ratio that is evident
in detecting edges in synthetic aperture radar (SAR)
images, and also by (Huang and Tseng, 1988) to over-
come the blurring effect found with gaussian smooth-
ing filters.
To perform statistical tests effectively on two di-
mensional images and therefore allow comparisons to
be made to the more traditional techniques, a novel
edge detection algorithm was introduced by (Fes-
haraki and Hellestrand, 1994) that combined the use
of a 5×5 pixel image mask and the popular two dis-
tribution Student’s T test. This allowed them to ef-
fectively detect edges at eight different orientations in
both noiseless and noisy images. Comparisons to the
traditional gradient methods have illustrated a robust
performance in the presence of noise (Kundu, 1990)
and (Hou, 2003), who illustrated how statistics can
outperform Canny on images corrupted with impul-
sive noise. Also found by (Lim and Jan, 2002) (Lim
and Jan, 2006) was the possibility that a modified Stu-
dent’s T test could perform well on images with little
noise, however was outperformed by the Kolmogorov
Smirnov test in intense noise images.
All these methods, while removing the need for
the smoothing parameters evident in Canny and other
gradient based techniques, do not eliminate the need
for a subjective user threshold. Through the use of
a probability value of the test in question they per-
form a statistical confidence test using lookup tables.
Work by (Bowring et al., 2004) has since indicated
the possibility of producing images superior to both
Canny and SUSAN (Smith and Brady, 1997) using
novel statistical methods without the need for a confi-
dence check simply by varying the size of the image
mask and therefore the amount of data points used in
the tests. Furthermore work by (Williams et al., 2005)
illustrated how through the use of multiple masks of
varying scales applied to the same image and artifi-
cial neural networks, it is possible to remove the need
for any subjective threshold when producing superior
statistical images, albeit at higher computational cost.
2 THE STATISTICAL EDGE
DETECTION FILTER
For all of the results presented here, the same filter
principle is used as that described by (Bowring et al.,
2004). The reader is directed to that work for a more
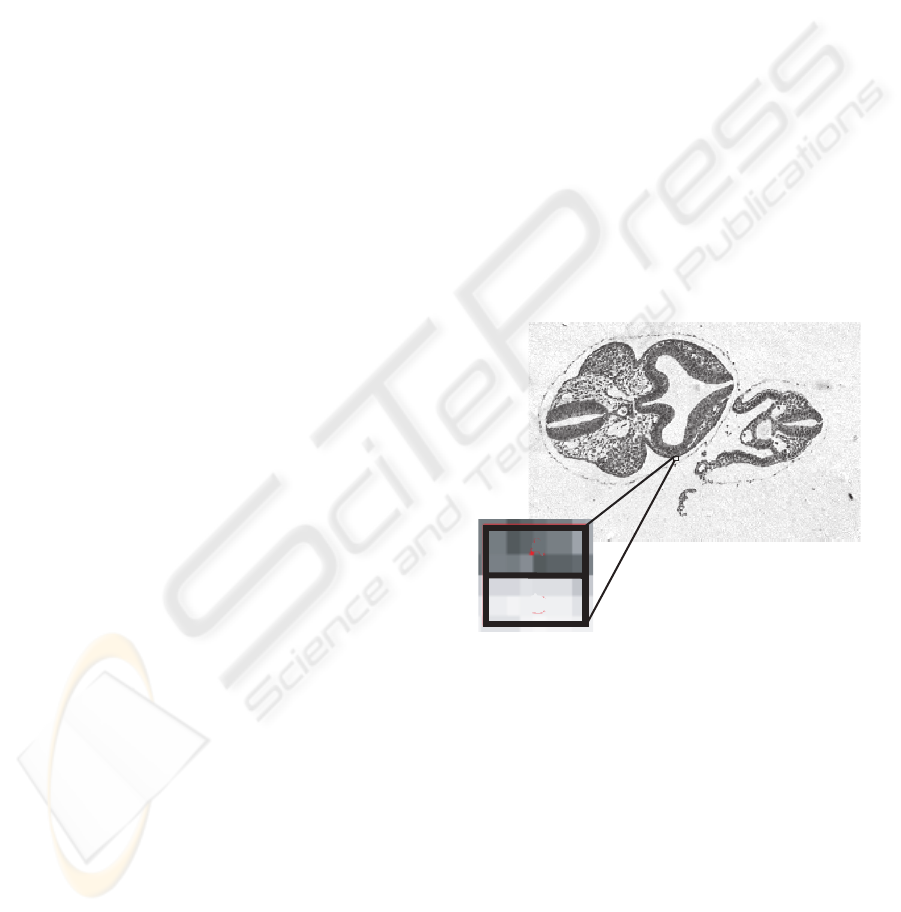
detailed full description of its operation. The statis-
tical edge-detection filter principle is shown in sim-
plified form in (Fig: 1). It details an edge section
of a mouse atlas image (MA) (Brune et al., 1999)
with a single square mask applied. Each mask used
is divided in two equal areas surrounding a central
pixel at various angles of 90
◦
, 60
◦
, 45
◦
etc. If the
mask lies entirely in a homogeneous region within
the image, then there will be little or no difference
in the computed statistical measures between both ar-
eas. The maximum difference will occur when the
mask lies directly over the boundary between the two
regions (as in Fig: 1), therefore generating greatly dif-
fering statistical measures for each of the regions. Us-
ing this technique, the likely edge direction is also de-
termined and is used for later non-maximal suppres-
sion of the image when necessary.
A
B
Figure 1: Illustrating a single statistical mask applied to an
image region at an angle of 0
◦
. Each mask is divided into
two equal sized regions A and B located around the central
pixel of interest.
2.1 Implementing the Statistical
Tests
For the analysis work, various statistical parametric
and non-parametric tests have been used to compare
two equal sized samples. Each of the tests used will
give a high response if the two data sets A and B come
from different regions of the image under evaluation,
and likewise low values if they are from the same re-
gion.
VISAPP 2006 - IMAGE ANALYSIS
458

The tests at use are:
Fisher Test
The Fisher Test (or the F Test as it is commonly
referred) tests the hypothesis that two distributions
will have the same variance. Fishers test is a
non-parametric test, therefore making no assumption
about the two data sets under evaluation.
The two-sample F-test is defined as follows:
F = max
s
A
s
B
,
s
B
s
A
(1)
Where s
A
and s
B
are the variances of the two regions
A and B surrounding the central pixel.
Student’s T-test
The Student’s T-test is a parametric test based on
the hypothesis that the two distributions will have
the same or a similar mean value. The Student’s T-
test is generally used where it is expected that the
two populations will have similar variances. How-
ever it has been shown that even with regions of
greatly differing variances the test gives good results
in practice (Bowring et al., 2004), (Williams et al.,
2005), (Lim and Jan, 2002).
The T-test is given as:
T =
|¯x
A
− ¯x
B
|
α(|A|+|B|)
|A∪B|
(2)
Where ¯x
A
is the mean and |A| is the number of pixels
from region A, and ¯x
B
and |B| correspond to region
B. α is defined as:
α =
|A|¯x
A
+ |B|¯x
B
|A ∪ B|−2
(3)
Kolmogorov Smirnov Test
The Kolmogorov Smirnov test (KS-Test) is a non-
parametric test based on the empirical distribution
function of ascending data points:
F
A
(i)=n(i)/N (4)
Where n(i) is the number of data points less than the
current data point in ranked set A, and N is the num-
ber of overall points contained in data set A.
The two sample KS tests checks for the maximum dif-
ference between the empirical and cumulative distrib-
ution functions for both data sets. From this it returns
the value of D given in the equation:
D = max
i{1,...,N}
|F
A
(i) − F
B
(i)| (5)
Where F
A
is the empirical distribution function for
data set A, and F
B
is the empirical distribution for
data set B
Chi Square Test
The Chi Square test uses checks for the independence
of the two different data sets. The comparison is cal-
culated by taking the difference at the same position
for two binned datasets. Here the bins are defined
by region A and region B of the mask.
The Two Sample Chi Square test is given as:
χ
2
=
i
(R
i
− S
i
)
2
R
i
+ S
i
(6)
Where R
i
is the number of values in bin i of region A,
and S
i
is the number of values in bin i of region B.
Mann Whitney U Test
The Mann Whitney U test checks the hypothesis that
the two data sets under evaluation are taken from the
same distribution. The statistical value U corresponds
to a rank score which is calculated for both data sets.
R
A
=
x∈A
⎛
⎝
y∈B;y<x
1
⎞
⎠
(7)
R
B
=
x∈B
⎛
⎝
y∈A;y<x
1
⎞
⎠
(8)
U = min(R
A
,R
B
) (9)
Where R
A
refers to the data originating from region
A of the mask and likewise R
B
refers to region B.
U is the overall statistical significance relating to the
minimum value between R
A
and R
B
.
STATISTICAL TECHNIQUES FOR EDGE DETECTION IN HISTOLOGICAL IMAGES
459
3 RESULTS AND ANALYSIS
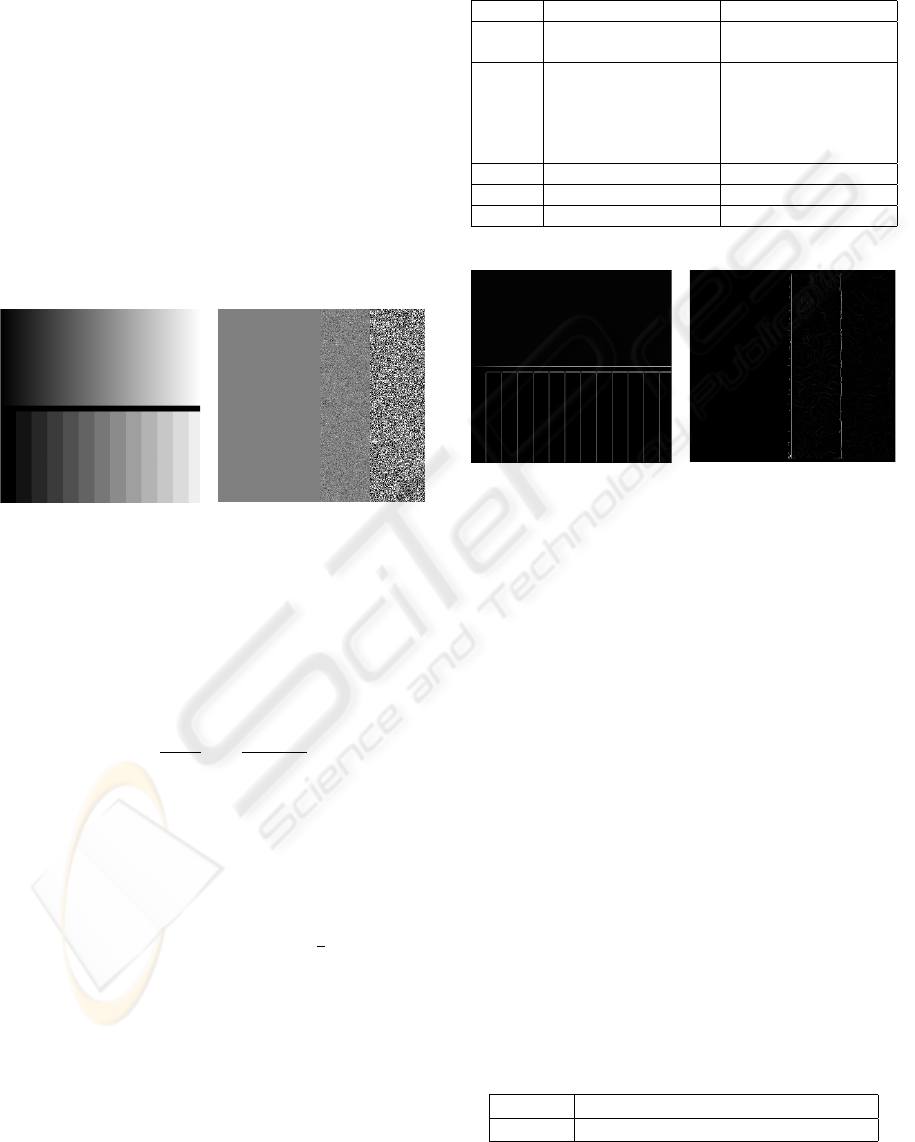
3.1 Synthetic Images
To analyze the performance of the statistical tests it
was important to test their function on synthetic im-
ages. The aim of these images was to exploit or hin-
der the specific characteristics of each test in question.
The first of these images (Fig: 2(a)) featured a gradi-
ent image with continuous and stepped grayscale lev-
els. This image specifically featured a gradual change
in mean but a constant variance. The second of these
test images (Fig: 2(b)) featured three step edges of
varying levels of Gaussian noise. This image featured
noise distributed with uniform mean although having
a gradual change in variance
(a)
(b)
Figure 2: Synthetic test images. a) Uniform variance and
gradual mean change. b) Uniform mean and gradual vari-
ance change.
Figure of Merit:
R =
1
I
sum
I
A
i=1
1
1+βd
2
i
(10)
Where:
I
sum
= max(I,I
A
).
I = The sum of the ideal edge points.
I
A
= The sum of the detected edge points.
d
i
= the distance of the i
th
edge point from the ideal
edge point.
β = A scaling constant (typically set to
1
9
).
Pratt’s figure of merit (FOM) (Pratt, 1991) is adapted
here to work with grayscale images. The performance
value is calculated for each of the 256 grey levels in
both the edge detected image, and the ideal gold stan-
dard image. The mean of these 256 Pratt’s merit val-
ues is then assigned as the figure of merit for that par-
ticular image. Fig: 3 illustrates the FOM for the syn-
thetic test images after non maximal suppression.
Table 1: Measured figure of merit values for the synthetic
images at a range of mask sizes. “1” is the ideal result,
“0” is a poor response. Values in boldface indicate the best
response at the given resolution.
Image Fig: 2(a) Fig: 2(b)
Mask
Size 5×511×11 15×15 5×511×11 15×15
F 0.331 0.122 0.057 0.405 0.567 0.567
T 0.905 0.602 0.469 0.051 0.052 0.069
KS 0.158 0.136 0.123 0.116 0.369 0.437
χ
2
0.159 0.145 0.132 0.262 0.370 0.403
U 0.193 0.127 0.136 0.052 0.028 0.026
Variance 25 725 7
Canny 0.627 0.377 0.270 0.050 0.040 0.034
Sobel 0.880 0.053
(a)
(b)
Figure 3: Edge detection results for Fig: 2(a) and (b) im-
ages. a) T Test 5×5 b) F Test 11×11.
3.2 Histological Images
Histological images often tend to have poorly iden-
tifiable boundaries corrupted by noise, and generally
have a very low contrast. The images used here for
analysis are two typical histological images (Fig: 4).
One is of a mouse atlas embryo (Brune et al., 1999),
and the other is a section of human tissue colon cour-
tesy of Faculty hospital Bohunice of Masaryk Uni-
versity (Brno, the Czech Republic). The FOM re-
sults are shown in (Table: 3). The performance is
measured against gold standard images that have been
pre-segmented by an expert in the field to include only
their ideal edge points.
Table 2: Computational time of test for Fig: 2(b) (300 ×
300 pixels). CPU specification: Pentium 4, 3.20GHz,
256 MB RAM.
Test FTKSχ
2
U
time (s) 2.59 2.48 10.25 5.46 6.42
VISAPP 2006 - IMAGE ANALYSIS
460
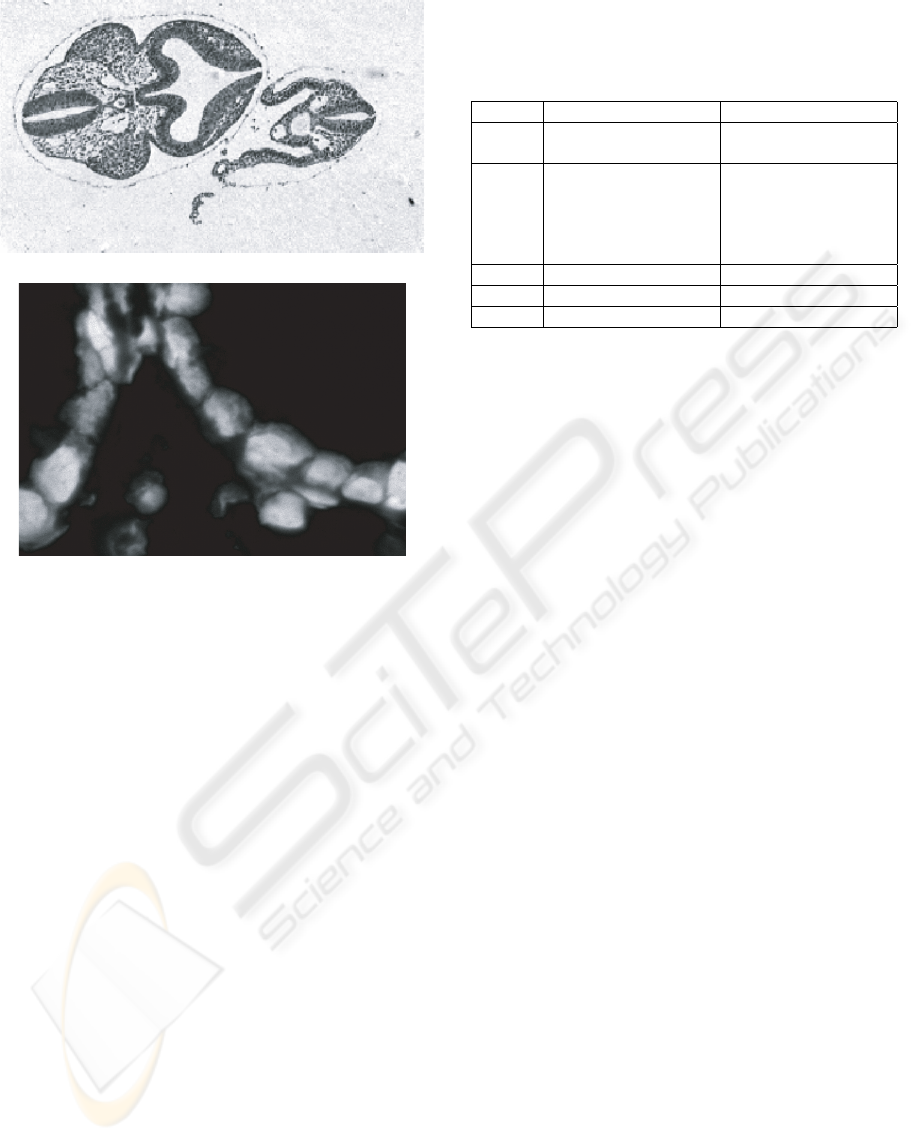
(a)
(b)
Figure 4: Histological images. a) Mouse Atlas Embryo, b)
Human tissue colon.
4 CONCLUSION
An analysis of statistical tests available for detecting
edges in noisy histological images has been presented
here. The results (Table: 1, Fig: 3) have illustrated
that with synthetic images the Student’s T test and
Sobel filters perform better where there is a known
change in mean, however both are outperformed by
the non parametric Fisher, KS and Chi square tests
when the mean is constant and the variance changes.
Further analysis of real image data illustrated that,
when detecting edges in the histological MA images,
the KS, Chi square and Student’s T test performed
the best overall. Even though the Canny filter outper-
formed the statistical tests at a fine resolution when
compared to a mask of 5 × 5, it was outperformed
as the number of data points and therefore the mask
size increased. Also we illustrated how the Student’s
T test performed better with the tissue colon images,
whereas the non-parametric KS and Chi square tests
were poorer. We can assess this poorer performance
for the non-parametric tests to be proportional to the
size of the objects and edges within the image, thus
allowing greater performance where the image con-
tains larger objects. It also is commonly understood
how the Canny produces edge images that, although
Table 3: Measured figure of merit (FOM) values for the
histological image at a range of mask sizes. “1” is the ideal
result, “0” is a poor response. Values in boldface indicate
the best response at the given resolution.
Image Mouse Atlas Tissue Colon
Mask
Size 5×511×11 15×15 5×511×11 15×15
F 0.164 0.315 0.277 0.049 0.130 0.120
T 0.164 0.404 0.337 0.125 0.392 0.368
KS 0.130 0.391 0.405 0.036 0.098 0.104
χ
2
0.061 0.411 0.432 0.034 0.144 0.121
U 0.143 0.376 0.365 0.033 0.066 0.071
Variance 25 725 7
Canny 0.346 0.354 0.331 0.304 0.332 0.301
Sobel 0.360 0.311
accurate in location, have edges that are not continu-
ous. The statistical tests presented here incorporate an
edge tracking process that is inherent in the algorithm.
This tracking produces uninterrupted edges relative to
the mask size. It is therefore a future goal to deter-
mine not only an FOM performance comparison of
the detectors but also to assess edge continuity.
We have also illustrated that there is no specific statis-
tical test suitable for all types of image. It is therefore
a further goal to find the most successful combination
of statistical tests which will perform well on all im-
age data.
ACKNOWLEDGEMENTS
This work was supported by the Ministry of Educa-
tion of the Czech Republic (Projects No.1K05021 and
No. LC535) and by the Academy of Sciences of the
Czech Republic (Grant No.A5004306). We would
also like to thank (EMAP) the University of Edin-
burgh mouse atlas project for providing us with the
MA images.
REFERENCES
Beauchemin, M., Thomson, K. P. B., and Edwards, G.
(1998). On nonparametric edge detection in multilook
sar images. IEEE Transactions on GRS, 36(5):1826–
1829.
Bovik, A. C., Huang, T. S., and Jr, D. C. M. (1986). Non-
parametric tests for edge detection in noise. Pattern
Recognition, 19(3):209–219.
Bowring, N. J., Guest, E., Twigg, P., Fan, Y., and Gadsby,
D. (2004). A new statistical method for edge detection
on textured and cluttered images. In 4
th
IASTED VIIP
Conf., pages 435–440.
STATISTICAL TECHNIQUES FOR EDGE DETECTION IN HISTOLOGICAL IMAGES
461
Brune, M., Bard, J., Dubreuil, C., Guest, E., Hill, W., Kauf-
man, M., Stark, M., Davidson, D., and Baldock, R.
(1999). A three-dimensional model of the mouse at
embryonic day 9. 216(2):457–468.
Canny, J. (1986). A computational approach to edge detec-
tion. IEEE T-PAMI, 8:769–698.
de Souza, P. (1983). Edge detection using sliding statistical
tests. CVGIP, 23(1):1–14.
Fesharaki, M. N. and Hellestrand, G. R. (1994). A new edge
detection algorithm based on a statistical approach. In
ICSIPNN ’94, pages 21–24. IEEE.
Hou, Z. (2003). Robust edge detection. Pattern Recogni-
tion, 36(9):2083–2091.
Huang, J. S. and Tseng, D. H. (1988). Statistical theory of
edge detection. CVGIP, 34(3):337–346.
Kundu, A. (1990). Robust edge detection. Pattern Recog-
nition, 23(5):423–440.
Lim, D. H. and Jan, S. J. (2002). Comparison of two-sample
tests for edge detection in noisy images. Statistician,
51(1):21–30.
Lim, D. H. and Jan, S. J. (2006). Robust edge detection
in noisy images. Computational Statistics and Data
Analysis, 50(3):803–812.
Perona, P. and Malik, J. (1990). Scale-space and edge de-
tection using anisotropic diffusion. IEEE Transac-
tions on Pattern Analysis and Machine Inteligence,
12(7):629–639.
Pratt, W. K. (1991). Digital Image Processing. Wiley.
ISBN: 0-471-37407-5.
Smith, S. and Brady, J. (1997). Susan – a new approach to
low level image processing. IJCV, 23(1):45–78.
ˇ
Sonka, M., Hlav
´
a
ˇ
c, V., and Boyle, R. (1986). Image
Processing Analysis and Machine Vision. Chapman
and Hall Publishing. London.
Williams, I., Bowring, N. J., Guest, E., Twigg, P., Fan, Y.,
and Gadsby, D. (2005). A combined statistical/neural
network multi-scale edge detector. In 5
th
IASTED
VIIP Conf. ISBN: 0-88986-528-0, ref: 480-266.
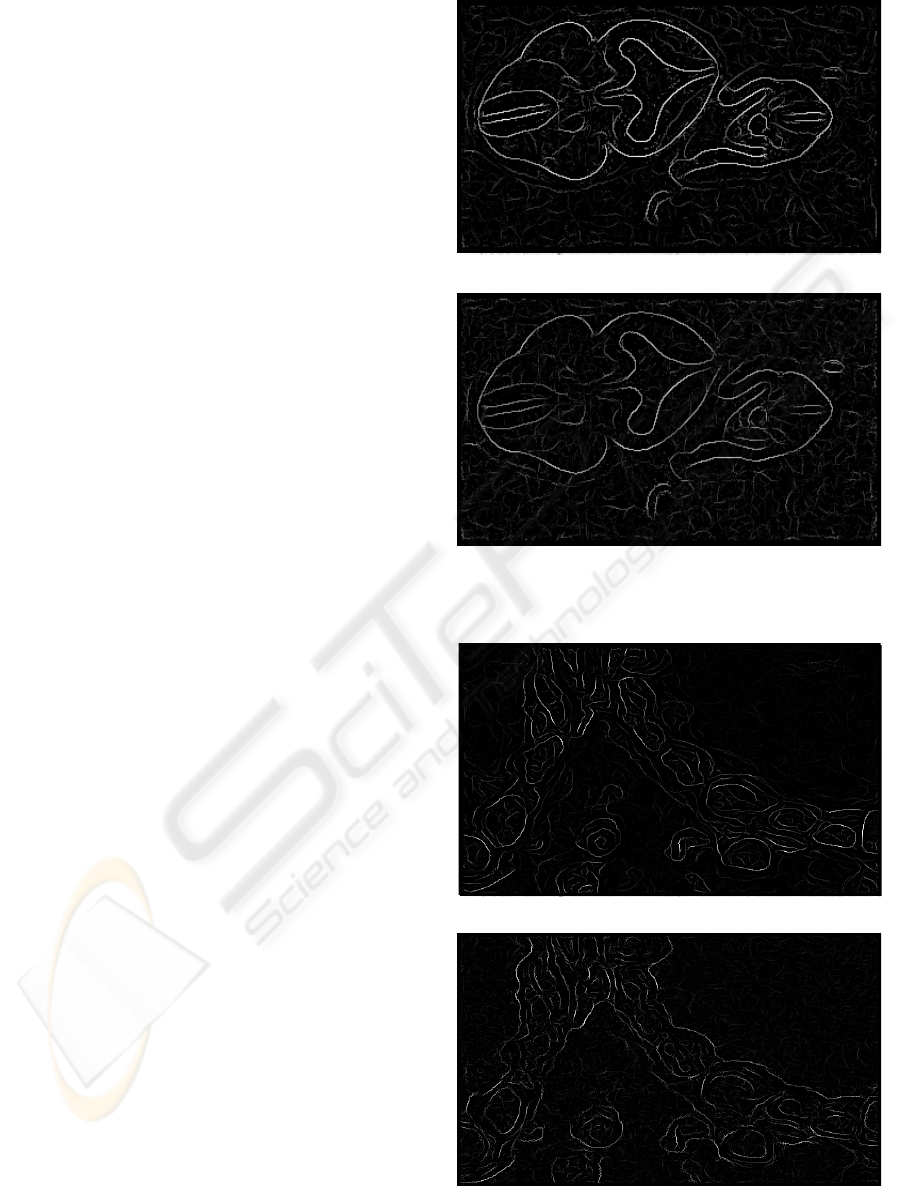
(a)
(b)
Figure 5: Edge Detection results. a) T Test 11x11, b) Chi
square Test 11x11.
(a)
(b)
Figure 6: Edge Detection results. a) T Test 11x11, b) F Test
11x11.
VISAPP 2006 - IMAGE ANALYSIS
462
