
EXTRACTING PERSONAL USER CONTEXT WITH A THREE-AXIS
SENSOR MOUNTED ON A FREELY CARRIED CELL PHONE
Toshiki Iso
Network Laboratories, NTT DoCoMo, Inc.
3-5 Hikarino-oka, Yokosuka, Kanagawa, Japan
Kenichi Yamazaki
Network Laboratories, NTT DoCoMo, Inc.
3-5 Hikarino-oka, Yokosuka, Kanagawa, Japan
Keywords:
Context extraction, sensors, cell phone, wavelet packet, Kohonen self-organizing map, ubiquitous service,
accelerometer.
Abstract:
To realize ubiquitous services such as presence services and health care services, we propose an algorithm
to extract ”personal user context” such as user’s behavior; it processes information gathered by a three-axis
accelerometer mounted on a cell phone. Our algorithm has two main functions; one is to extract feature vectors
by analyzing sensor data in detail by wavelet packet decomposition. The other is to flexibly cluster personal
user context by combining a self-organizing algorithm with Bayesian theory. A prototype that implements
the algorithm is constructed. Experiments on the prototype show that the algorithm can identify personal user
contexts such as walking, running, going up/down stairs, and walking fast with an accuracy of about 88[%].
1 INTRODUCTION
Cell phones are becoming indispensable in daily life
and are carried everywhere due to their sophisti-
cated functions such as camera, music player, IrDA,
wireless LAN, GPS and IC-chip for electronic wal-
let (NTT DoCoMo, Inc., ). Since cell phones have be-
come personal assistants, they are well placed to iden-
tify user behavior. Mobile service providers are de-
manding user context such as user behavior because
they want to provide appropriate services that are suit-
able for the situation of the mobile user. Identifying
”personal user context” is especially important in ad-
vancing health care services and service navigation.
There are many related works on context-aware
systems using sensors in mobile environments
(Siewiorek et al., 2003), (Krause et al., 2003), (Kern
et al., 2004), (K. V. Laerhoven, 2003), (Miao et al.,
2003), (DeVaul and Dunn, ), (Clarkson et al., 2000),
(Healey and Logan, ), LBao2004, (M. Unuma, 2004),
(Randell and Muller, 2000).
However, these conventional methods have two
practical issues; one is that users need to wear some
sensors on specific parts of their bodies, the other is
that their feature extraction output is suitable only for
a limited range of user context. In regard to these is-
sues, most papers adopted the wearable computer ap-
proach and sensor data was extracted by FFT-based
approaches. Thus, they required several sensors to be
fixed to different parts of the user’s bodies to achieve
a high degree of accuracy. Moreover, it was difficult
to analyze the localized wave data present in the sen-
sor data because Fourier transform has lower time-
frequency resolution than wavelet transform. Their
methods are not realistic because wearing many sen-
sors is very cumbersome. On the other hand, one of
the related works (Si et al., 2005) proposed a method
of extracting context that is independent of sensor po-
sition, however, their method had limited context ex-
traction performance because feature extraction was
based on the magnitude of three-axis sensor data.
As a solution to these issues, we proposed the ”Per-
ContEx” (Iso et al., 2005) system which could ex-
tract personal user context by applying an algorithm
to data collected from the user’s cell phone. While
the system placed no constraints on how the phone
was carried, the high computational costs of the algo-
rithm meant that it was not always possible to real-
ize ubiquitous services that require real-time process-
ing. Therefore, as another approach, we propose here
a method of extracting personal user context by sub-
jecting the data collected by sensors tailored to the
user’s activities to wavelet packet decomposition. It
can identify high detailed user contexts such as walk-
ing at normal speed, running, walking fast, and going
up/down stairs. This is because the wavelet packet de-
224
Iso T. and Yamazaki K. (2006).
EXTRACTING PERSONAL USER CONTEXT WITH A THREE-AXIS SENSOR MOUNTED ON A FREELY CARRIED CELL PHONE.
In Proceedings of the International Conference on Signal Processing and Multimedia Applications, pages 224-231
DOI: 10.5220/0001568902240231
Copyright
c
SciTePress

composition provides a finer analysis of sensor data
than FFT.
Section 2 explains the concept of processing in Per-
ConEx which extract personal user context. Section 3
describes detail algorithm at each stages in PerCon-
tEx. We then show some experiments. Finally, we
draw several conclusions and describe future works.
2 OVERVIEW OF PROCESSING
Since we use a three-axis sensor to implement our
proposals, our system must satisfy the following re-
quirements;
• feature extraction: it should deal with a variety of
personal user contexts
• context extraction: it should be independent of how
the three-axis sensor is carried.
To satisfy the first requirement, we propose a method
to extract features from sensor data by using the Best
Basis method with wavelet packet decomposition. To
satisfy the second requirement, we propose a context
extraction method that consists of a self-organizing
algorithm and Bayesians theory; a variety of pseudo-
data is used as training data for context clustering.
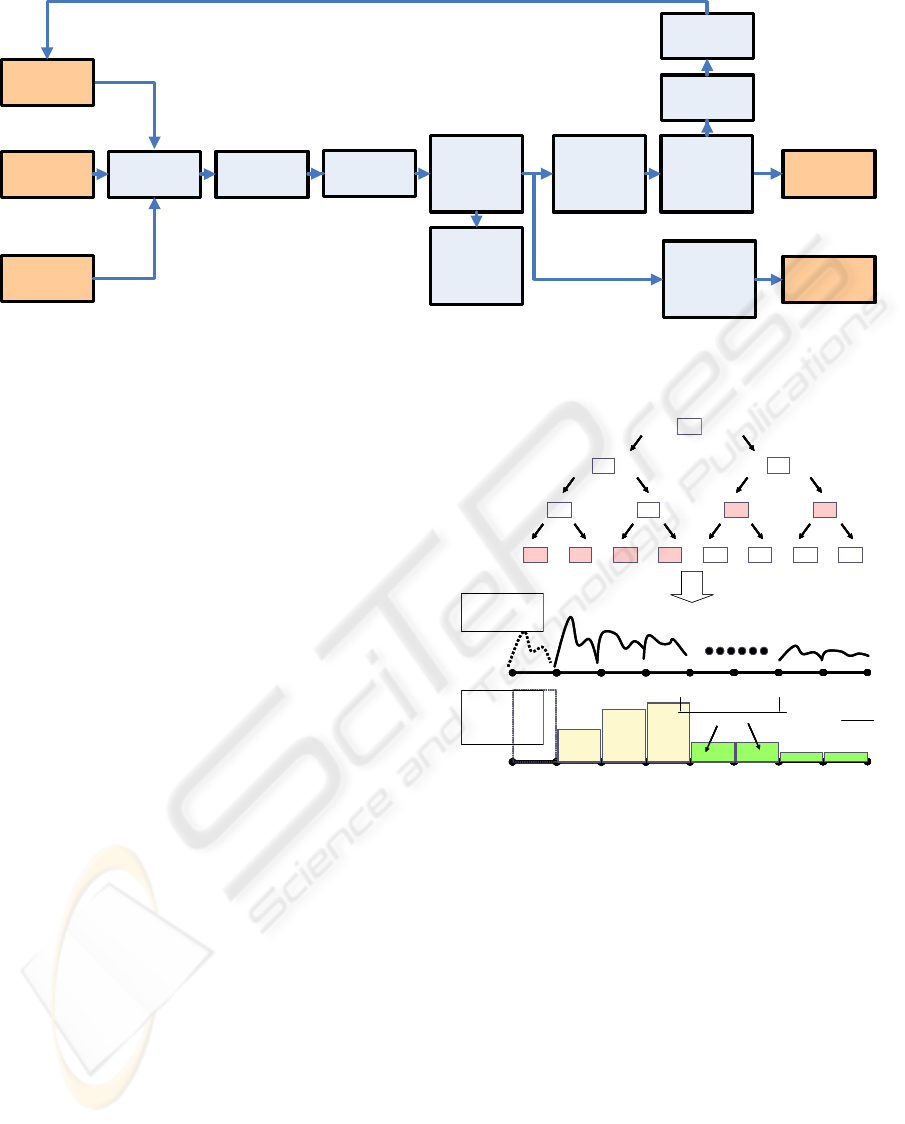
We show the overall processing flow of the algo-
rithm in Figure 1. The algorithm has three stages:
feature extraction, learning, and personal user context
extraction.
At first, in order to handle the variety of signal pat-
terns which are possible, we use wavelet packet de-
composition (WPD) for wave analysis in the feature
extraction stage. This is because WPD provides finer
analysis in each frequency range through the use of
localized orthogonal basis functions. Moreover, by
using information criteria, we can obtain decomposed
signals which can efficiently representing the features
of signal patterns. We extract feature vectors from the
decomposed signals.
Second, in order to avoid the influence of data fluc-
tuation and noise, we use the Kohonen self-organizing
map (KSOM) as a non-linear learning method. This
is because KSOM can provide not only robustness
to noise and signal fluctuation, but also flexibility in
terms of the number of clusters. By calculating ap-
pearance probabilities of personal user contexts, we
can extract the most representative feature vectors
and time-series data while avoiding the vague vectors.
Moreover, in order to achieve robustness with regard
to where the sensors are set, we prepare a variety of
KSOMs and train them using pseudo-data generated
from the most representative time-series data by rota-
tional transformation.
Third, in order to extract personal user context, we
use all feature maps including the appearance possi-
bilities of personal user context trained by both ob-
served and pseudo-data. Finally, we can extract the
personal user context from three-axis sensor data by
setting adequate criteria. We describe the three stages
below.
3 ALGORITHM
3.1 Feature Extraction Stage
Noise is naturally present in time-series data from
sensors mounted on mobile devices. Moreover, in
the case of cell phones carried freely, the time-series
data often contain signals generated by non-targeted
behavior. It is difficult to make a comprehensive
disturbance model because of the variety of distur-
bances. Under the assumption that the majority of
time-series data is generated by the targeted behav-
iors, we propose a method to extract features by an-
alyzing the time-series data decomposed by a combi-
nation of wavelet packet and information entropy.
3.1.1 Sensor Data Extraction and Preprocessing
At first, we divide the time-series data from a three-
axis sensor into frame data. We define t
s
as the time
range. We assume that the three-axis sensor does not
experience twisting in time frame t
s
as follows.
{t
s
|
1
2
(s − 1)∆T ≦ t
s
<
1
2
(s + 1)∆T }
(s = 1, 2, · · · ) (1)
where ∆T is frame length. To divide the sensor data,
some overlap time must be set to get data stability.
At this time, we define an observed three-axis sensor
data a(t) as follows;
a(t) = (a
x
(t), a
y
(t), a
z
(t)) (2)
Feature extraction is preceded by preprocessing oper-
ations such as data and time calibration.
3.1.2 Wavelet Packet Decomposition
Time-series data analysis is commonly based on
Fourier transform. Actually, it is a very strong tool
for feature extraction if we can assume that the in-
put represents regular periodic data that extends over
relatively long periods. Unfortunately, this assump-
tion fails in the case of time-series data generated
by the user’s behavior; the data here is generated by
many short-term events. Therefore, wavelet trans-
form should be applied rather than Fourier transform.
Wavelet transform is very common in the fields of sig-
nal processing applications such as image compres-
sion and analysis of electrocardiograms (Ishikawa,
2000).
EXTRACTING PERSONAL USER CONTEXT WITH A THREE-AXIS SENSOR MOUNTED ON A FREELY
CARRIED CELL PHONE
225
Sensory Data
Extraction
Wavelet Packet
Decomposition
Best Basis Function
Selection based on
AIC
Sensory Data
Preprocessing
XYZ-Feature Pattern
by composition of
Entropy Distribution
on each axis
Self-Organizing
Feature Map
(Training Stage)
Dictionary Feature
Map Extraction
XYZ-Feature Pattern
by composition of
Statistic Values of
Entropy Distribution
on each axis
Specific Patterns
Occurrence
Probabilities Map
based on Best
Matching Units
Basis Feature
Pattern Extraction
Basis Sensory Data
Extraction
Pseudo-Sensory
Data Generation
Sensory Data
Extraction
Self-Organizing
Feature Map
(Clustering Stage)
Specific Patterns
Extraction
Figure 1: Processing flow.
Wavelet packet analysis provides more detail be-
cause it uses a splitting algorithm that downsamples
not only the scaling components but also the wavelet
components.
In order to realize the flexible analysis of sen-
sor data, we use discrete wavelet packet decomposi-
tion (DWPD). By using DWPD, the three-axis sen-
sor data a(t) can be represented at level p (p =
0, 1, . . . , p
max
) as follows;
a(t) =
2
p
−1
X
q=0
u
(p,q)
(t) (q = 0, 1, . . . , 2
p
max
−1) (3)
where u
(p,q)
(t) is q-th of decomposed data at level p.
3.1.3 Best Basis based on Information Entropy
In order to find the best basis for a(t), we define a cost
function of information entropy L
i
(p, q) as follows;
L
i
(p, q) = −
X
t
s
|u
(p,q)
i
(t
s
)|
2
log |u
(p,q)
i
(t
s
)|
2
(i = x, y, z) (4)
We find the pairs of (p
B
i
(k), q
B
i
(k)) that minimize
L
i
(p, q).
(p
B
i
(k), q
B
i
(k)) = arg max
p,q
(L
i
(p, q)) (5)
where k is kth of the best basis. Then, a
i
(t
s
) (i =
x, y, z) can be represented as follows;
a
i
(t
s
) =
X
k
u
(p
B
i
(k),q
B
i
(k))
i
(t
s
) (6)
)0,0(
u
)0,2(
u
)1,2(
u
)2,2(
u
)3,2(
u
)0,1(
u
)1,1(
u
)0,3(
u
)1,3(
u
)2,3(
u
)3,3(
u
)4,3(
u
)5,3(
u
)6,3(
u
)7,3(
u
Generate Feature Vector from Distribution of information entropy
0
max
ω
pmaxp
2
BiBiBi
2
))k(q),k(p(L
−
0)1(Xd
Bi
=
)2(Xd
Bi
ω∆
ω∆2
⋅⋅⋅
⋅
⋅
⋅
)k(Xd
Bi
0
max
ω
0)1(Xs
Bi
=
)2(Xs
Bi
ω∆
ω∆2
⋅⋅⋅
⋅⋅⋅
)n(Xd
Bi
Periodgrams
Distribution
Information
Entropy
Distribution
max
p
max
2
ω
=ω∆
)0,0(
u
)0,2(
u
)1,2(
u
)2,2(
u
)3,2(
u
)0,1(
u
)1,1(
u
)0,3(
u
)1,3(
u
)2,3(
u
)3,3(
u
)4,3(
u
)5,3(
u
)6,3(
u
)7,3(
u
)0,0(
u
)0,2(
u
)1,2(
u
)2,2(
u
)3,2(
u
)0,1(
u
)1,1(
u
)0,3(
u
)1,3(
u
)2,3(
u
)3,3(
u
)4,3(
u
)5,3(
u
)6,3(
u
)7,3(
u
Generate Feature Vector from Distribution of information entropy
0
max
ω
pmaxp
2
BiBiBi
2
))k(q),k(p(L
−
0)1(Xd
Bi
=
)2(Xd
Bi
ω∆
ω∆2
⋅⋅⋅
⋅
⋅
⋅
)k(Xd
Bi
0
max
ω
pmaxp
2
BiBiBi
2
))k(q),k(p(L
−
0)1(Xd
Bi
=
)2(Xd
Bi
ω∆
ω∆2
⋅⋅⋅
⋅
⋅
⋅
)k(Xd
Bi
0
max
ω
0)1(Xs
Bi
=
)2(Xs
Bi
ω∆
ω∆2
⋅⋅⋅
⋅⋅⋅
)n(Xd
Bi
Periodgrams
Distribution
Information
Entropy
Distribution
max
p
max
2
ω
=ω∆
Figure 2: Feature Vectors generated by Wavelet Packet De-
composition.
3.1.4 Definition of Feature Vectors
As a wavelet packet is a kind of bandpass filter,
each u
(p
B
i
(k),q
B
i
(k))
i
are filtered at their frequency
ranges. We calculate both periodgrams and informa-
tion entropy of each feature each u
(p
B
i
(k),q
B
i
(k))
i
(i =
x, y, z) (see Figure 2). Next, we calculate the feature
vectors Xs
B
i
by distributing the periodgrams of the
best basis to the maximum level p
max
and we define
the feature vectors Xs as follows;
Xs =
Xs
B
x
Xs
B
y
Xs
B
z
(7)
where
Xs
B
i
= (Xs
B
i
(1), . . . ,
Xs
B
i
(n), . . . , Xs
B
i
(N
max
)) (8)
SIGMAP 2006 - INTERNATIONAL CONFERENCE ON SIGNAL PROCESSING AND MULTIMEDIA
APPLICATIONS
226
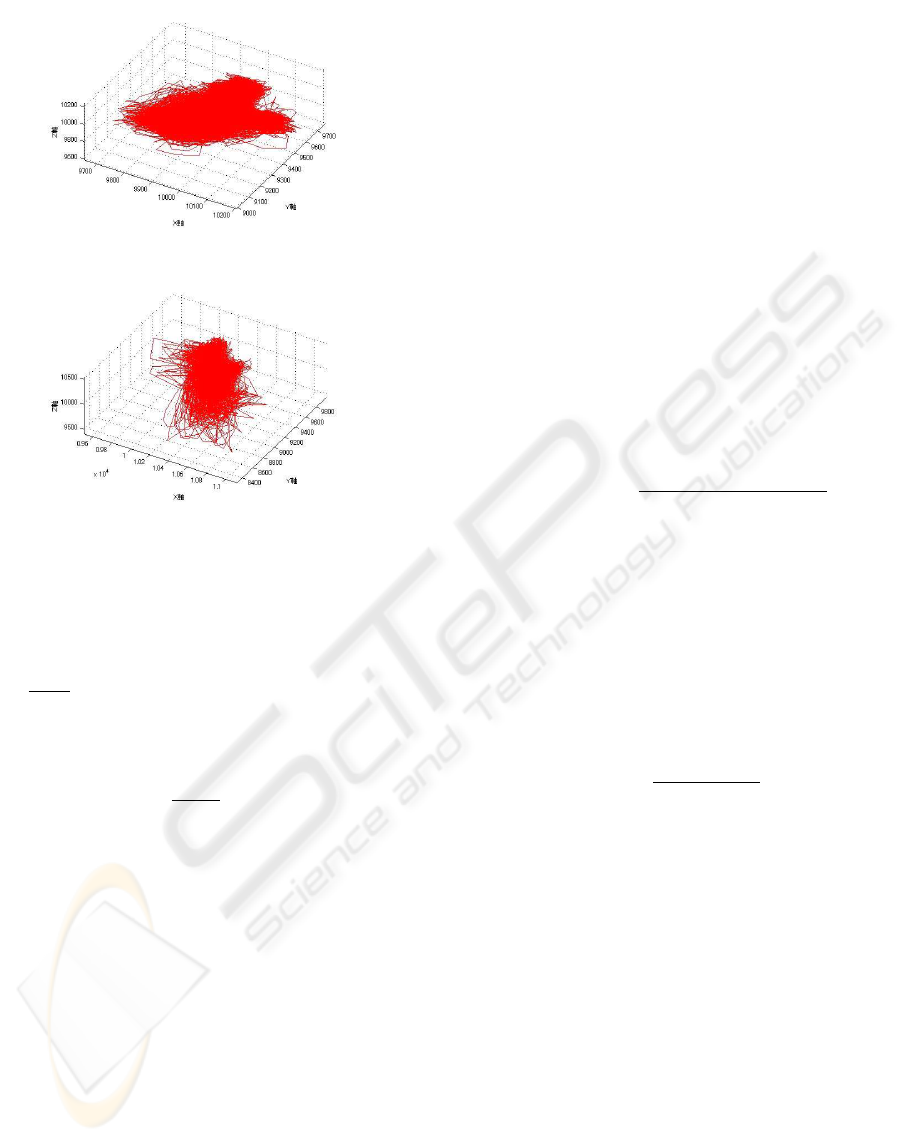
(a) Walking on flat road(a) Walking on flat road
(b) Going up stairs(b) Going up stairs
Figure 3: Trajectory of Three-Axis sensor data.
Xs
B
i
(n)
=
1
2∆T
X
t
s
|u
(p
B
i
(k),q
B
i
(k))
i
(t
s
)exp(−jω
n
t
s
)|
2
(9)
and
ω
n
=
ω
max
2
p
max
n(p, q) (10)
2
p
max
−p
q ≦ n(p, q) ≦ 2
p
max
−p
(q + 1) − 1 (11)
where ω
n
represents frequency. The above formula
does not contain Xs
B
i
(0), the DC component, be-
cause basically it contains gravity of center, moreover,
not DC but AC components contain effective features
for determining user behavior. Conventional methods
have a critical constraint in that sensors must be fixed
to specific parts of the user’s body. Therefore, in order
to extract what context they wanted, they selected spe-
cific components of three-axis sensor data or used the
magnitude of three-axis sensor data. However, these
methods can extract only a limited range of contexts
because they treat the sensor data as scalar data, not
vector data.
Figure 3 shows trajectories of three- axis acceler-
ation data for the user actions of walking on a flat
road and up stairs. Both actions yield characteristic
three-dimensional patterns, a kind of chaos attractor.
It is difficult to detect features accurately by project-
ing just one or two axes. Therefore, we use all com-
ponents of sensor data as vector data which allows us
to assess as many kinds of user behavior as possible.
We define two kinds of feature vectors, Xs
B
i
and
M
i
, as vector and statistic of information entropy, re-
spectively. X s
B
i
is the feature vector used to detect
similar sensor data while M
i
is for analyzing the at-
tribution of sensor data.
At first, we define the feature vector X d which is
composed of feature vector Xd
B
i
by distributing the
information entropy of the best basis to the maximum
level p
max
as follows;
Xd =
Xd
B
x
Xd
B
y
Xd
B
z
(12)
where
Xd
B
i
= (Xd
B
i
(1), . . . ,
Xd
B
i
(k), . . . , Xd
B
i
(2
p
max
−1
)) (13)
Xd
B
i
(k) =
|L
B
i
(p
B
i
(k), q
B
i
(k))|
2
2
p
max
−p
(14)
This allows us to calculate the momenta M
i
as fol-
lows;
M
i
= (M
i
(1), . . . , M
i
(l), . . . , M
i
(N
l
)) (15)
where
M
i
(Xd
B
i
) =
X
l
(l − M(1))
n
Xd
B
i
(l)
(n = 1, 2, 3, 4) (16)
and
M(1) =
P
l
lXd
B
i
(l)
P
l
Xd
B
i
(l)
(17)
Afterward, we use the Xs = (Xs
B
x
Xs
B
y
Xs
B
z
)
and M = (M
x
M
y
M
z
) as feature vectors of frame
in three-axis sensor data for extracting personal user
context.
3.2 Training Data Learning Stage
Most human action such as walking exhibits fluctu-
ations and noise. Moreover, they are always chang-
ing. This suggests that non-linear approaches to clus-
tering them are better than linear ones such as prin-
ciple components analysis, because the linear ap-
proaches are sensitive to the influences of fluctua-
tion and noise. From among non-linear approaches
available, we choose the Khonen self-organizing
map (KSOM) (Kohonen., ) for clustering personal
user context such as human behavior. This is because
KSOM offers competitive learning and also has rea-
sonable computational costs; it eliminates the need
to set the number of clusters beforehand. However,
EXTRACTING PERSONAL USER CONTEXT WITH A THREE-AXIS SENSOR MOUNTED ON A FREELY
CARRIED CELL PHONE
227

Table 1: Dictionary Data Example.
Feature Vector Personal User Context
Xd(t
1
) Walking at normal speed
Xd(t
2
)
Walking fast
· · ·
· · ·
Xd(t
k
)
going up to stairs
Xd(t
k+1
)
going down to stairs
· · ·
· · ·
Xd(t
k+N
)
running
KSOM has several problems. One of them is its
weakness in deciding cluster borders on the learnt
feature map because of the existence of uncertain
cells. In order to overcome this problem, we apply
a probabilities-based technique after learning the fea-
ture map. Under our proposal, we can prepare dic-
tionary data (see Table 1) whose labels are kinds of
personal user context. This allows us to calculate the
probability. By using the probability information, we
can obtain the sensor data most representative of each
personal user context.
3.2.1 Competitive Training by KSOM
We use feature vector Xs as main feature vector and
feature vector M as auxiliary feature vector, respec-
tively. Because Xs can contain more detail charac-
ters of sensor data than M . At this stage, we use fea-
ture vector Xs as input vectors X
i
to train KSOM.
They are generated from three-axis sensor data asso-
ciated with each personal user context. In training, the
KSOM measure and update rule are set as follows.
kX
i
− X
n
c
k = min
c
{kX
i
− X
c
k} (18)
X
Nearest
n
c
(t + 1) = X
Nearest
n
c
(t)
+ δ(t)h
ci
(r(t)){X
i
(t) − X
Nearest
n
c
(t)} (19)
where X
n
c
(t), X
Nearest
n
c
(t), X
i
(t) and c are the vec-
tors of the cell nearest to X
i
(t), the neighborhood
vectors of X
nc
(t), the input feature vectors at time t
in training and a cell in the KSOM, respectively. δ(t),
h
ci
and r (t) are the learning rate, the neighborhood
kernel around the winning unit n
c
, and neighborhood
radius, respectively. After training, we can obtain a
2D array of cells on the feature map represents the
distribution of training data. The cells also hold infor-
mation about the number of times each personal user
context appeared.
3.2.2 Detecting Representative Vectors for
Personal User Context
Based on the information about the number of times
in each personal user context appears, we make a
probability map by calculating the personal user con-
text appearance probabilities in each cell. We de-
fine the personal user context appearance probabili-
ties P (C
n
c
|X
n
c
) as follows;
P (C
n
c
|X
n
c
) =
P (X
n
c
|C
n
c
)P (C
n
c
)
P
k
c
P (X
n
c
|C
k
c
)P (C
k
c
)
(20)
We also define probabilities P (X
n
c
|C
n
c
) and
P (C
n
c
).
P (X
n
c
|C
n
c
) =
N(X
n
c
(C
n
c
))
P
k
c
N(X
k
c
(C
k
c
))
(21)
P (C
n
c
) =
N(C
n
c
)
P
k
c
P (C
k
c
)
(22)
where C
n
c
and X
n
c
represent the appearance of per-
sonal user context n
c
and the selected cell on the fea-
ture map as nearest to input vector X , respectively.
P (X
n
c
|C
n
c
) and P (C
n
c
) are the conditional prob-
ability of appearance C
n
c
given X
n
c
and the prior
probability of C
n
c
, respectively. N(X
k
c
(C
k
c
)) rep-
resents amount of X
k
c
(C
k
c
).
We use the probability map of personal user context
appearance for two purposes; to find representative
feature vectors for personal user context and to output
possibilities of the existence of personal user context
from three-axis sensor data. To realize the former,
we find the representative feature vectors when the
probability satisfies the below condition.
P (C
n
c
|X
n
c
) > T h
p
(23)
where T h
p
is a threshold to judge whether X
n
c
is
representative of C
n
c
. We can obtain the best repre-
sentative sensor data corresponding to X
n
c
which are
found as described above.
3.2.3 Training by using Pseudo Sensor Data
In order to achieve robustness with regard to the
positions of the sensor, we have already proposed
a method based on non-linear simultaneous equa-
tions. Unfortunately, its computational cost is exces-
sive and it often fails to provide the real-time process-
ing needed by ubiquitous services. Therefore, the
feature map includes the possibilities generated from
not only observed training data but also pseudo-data,
which are generated from the best representative sen-
sor data by rotational transformation. After obtaining
the best representative sensor data (see section 3.2.2),
we transform them using the rotation matrix as de-
scribed below;
a
p
=
1 0 0
0 cos α
n
− sin α
n
0 sin α
n
cos α
n
!
cos β
n
0 sin β
n
0 1 0
− sin β
n
0 cos β
n
!
×
cos γ
n
− sin γ
n
0
sin γ
n
cos γ
n
0
0 1 0
!
a
r
(24)
SIGMAP 2006 - INTERNATIONAL CONFERENCE ON SIGNAL PROCESSING AND MULTIMEDIA
APPLICATIONS
228
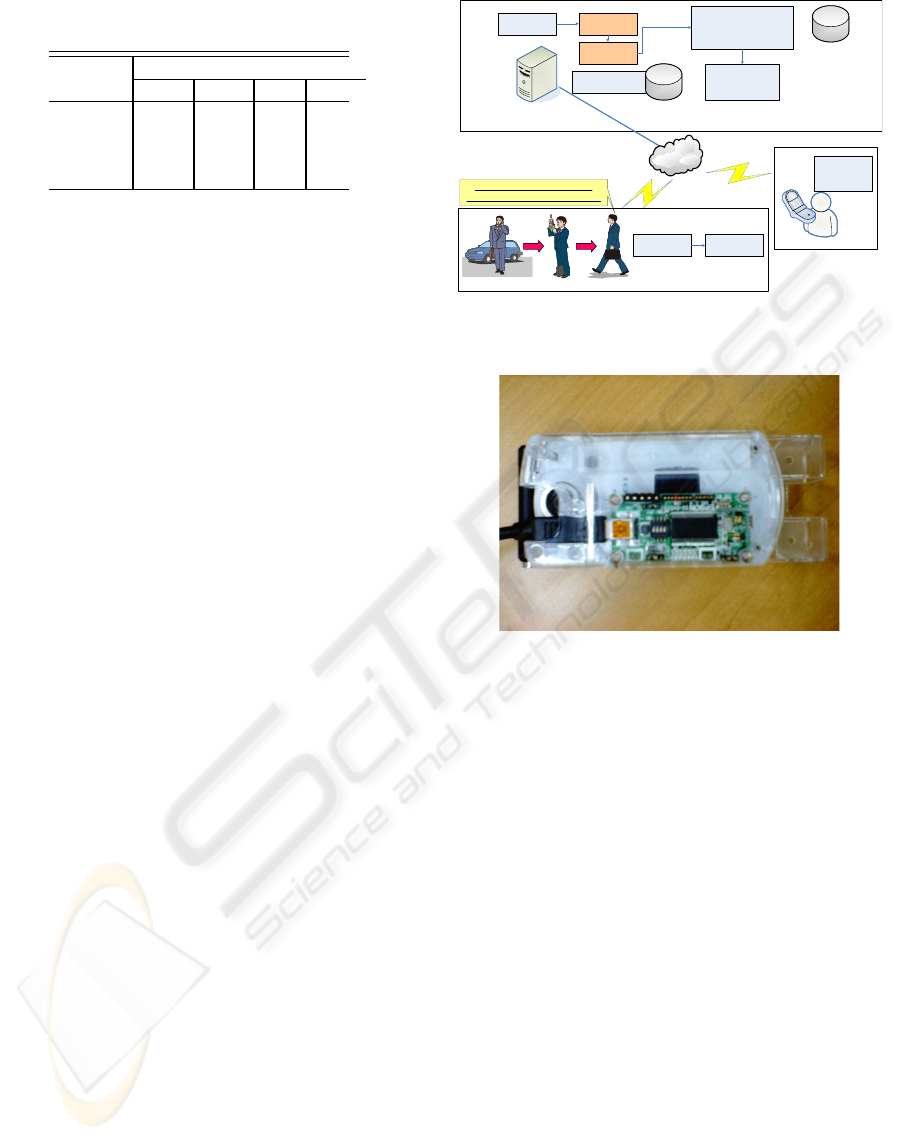
Table 2: Probability Map Example.
Feature Probabilities [%]
Vector WN WF · · · US
X
1
82.3 0.0 · · · 17.7
X
2
73.7 25.6 · · · 0.7
· · ·
· · · · · · · · · · · ·
X
k
28.6 0.0 · · · 71.4
where α
n
, β
n
and γ
n
are the angles around x, y and z-
axis, respectively. By increasing these angles in steps
of ∆θ, we can obtain a variety of pseudo sensor data
a
p
. Subsequent training with each pseudo-data in an-
gle sets (α
n
, β
n
, γ
n
) following the approach given in
section 3.2.1 and 3.2.2, yields as many number of fea-
ture maps as the angle sets.
3.3 Personal User Context
Extraction Stage
In order to recognize personal user context from
three-axis sensor data, we use all feature maps with
the possibilities trained by both observed and pseudo
sensor data. The specific pattern detection stage pro-
ceeds as follows;
1. Extract three-axis sensor data
2. Convert them into frame data and calibrate them in
terms of scale
3. Decompose them using the best basis approach by
wavelet packet decomposition and calculate feature
vectors from their spectrogram
4. Calculate residential errors between them and the
nearest cells in each feature map
5. Find the most suitable cell X
bm
for the below con-
ditions;
X
bm
= arg min
X
c
{kX − X
c
k}
kX
bm
− X
c
k < T h
bm
Corr(M
bm
, M
c
) > T h
corr
(25)
where M
bm
and M
c
are the feature vectors of
the information entropy distributions of X
bm
and
X
c
, respectively. Corr(M
bm
, M
c
) means the nor-
malized crosscorrelation between M
bm
and M
c
.
T h
bm
and T h
corr
are thresholds to judge feature
vector similarity.
An example of the probability map described in
the previous section in given in the below table.
Retrieving the most suitable cell X
bm
from Table 2
yields personal user context.
Mobile Network
User Context
Management Server
User A
Sensory Data
Detection
Sensory Data
Analysis
User Context
Extraction
Specific Signal
Data Extraction
Sensory Data
Receiver
Sensory Data
Transmitter
Presence
Information
Receiver
Presence Information
Conversion
(includes Security
Management)
Presence
Information
Transmitter
Specific Signal Data
⇔
⇔⇔
⇔User Context DB
User Context
⇔
⇔⇔
⇔Presence Information DB
Extracting physical user context
without wearing sensors on his body
User X with multi sensors
mounted on a cell phone
When a user is moving
Figure 4: PerContEx System.
4
Figure 5: A Three-Axis Accelerometer mounted on A Cell
Phone.
4 EXPERIMENTS
We validate of our proposed method using a prototype
system. The experiments targeted four user contexts
associated with movement: walking, going up/down
stairs, walking rapidly, and running. These targets are
thought to be relatively hard to discriminate as well as
being extremely useful in health advice services such
as calculating a person’s calorie consumption.
4.1 Experimental Conditions
Our system is composed of a cell phone with three-
axis sensor and a PerContEx server. The cell phone
transmits the sensor data to the PerContEx server. The
PerContEx server extracts the user’s context the data
and send the results of context extraction to the cell
phone or another personal computer (see Figure 4).
The experimental conditions of the system are as fol-
lows; We show experimental conditions of the system
as follows;
• System specifications
EXTRACTING PERSONAL USER CONTEXT WITH A THREE-AXIS SENSOR MOUNTED ON A FREELY
CARRIED CELL PHONE
229
– Cell phone: IMT-2000 Terminal
(NTT DoCoMo P900i, see Figure 5)
– Sensor: three-axis accelerometer
(Hitachi: H48C)
– PerContEx server: Personal Computer
(DELL: Dimension9150)
∗ OS:WindowsXP Pro.
∗ CPU: PentiumD830 3[GHz]
∗ MEM:2[GB]
• Parameters
– Mother wavelet: Harr Function
– Scale level: 5
– KSOM: 15[cell] × 10[cell]
• Data specifications
– Personal user context: five kinds of gait pattern
∗ walking at normal speed (WN),
∗ going up stairs (US)
∗ going down stairs (DS)
∗ walking fast (WF)
∗ running (RN)
– Carrying style: placed in user’s breast pocket
and hip packet
– Real data: data sampling: 100[Hz]
∗ training data 30[min]
∗ test data 50[min]
– Pseudo-data:
∗ step of rotation angle15[deg]
∗ range of rotation angle (round x, y, z-axis, re-
spectively) from 0[deg] to 45[deg]
– frame length: 3[sec] (overlap time: 1.5[sec])
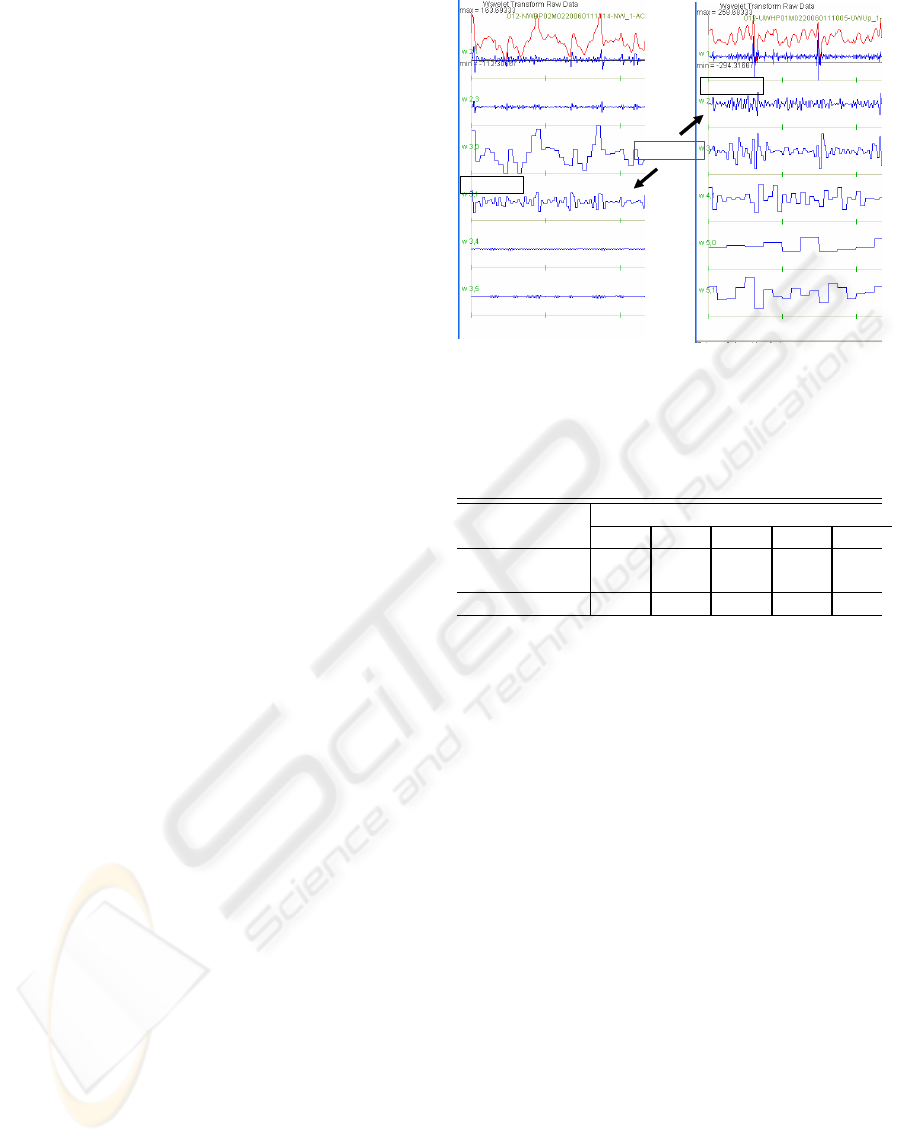
4.2 Results and Estimation
Figure 6 shows the results of identifying ”walking at
normal speed” and ”going up stairs”. As both move-
ments contain the behavior of ”walking”, we can see
similar wave patterns at the best basis level 2 and 3.
Thus, the other best bases are useful for discriminat-
ing between ”walking at normal speed” and ”going
up stairs” and noise. After feature extraction, we
made a feature map with personal user context ap-
pearance probabilities by using real data and pseudo
sensor data as described above. Figure 7 shows the
resulting feature map. We can see that each personal
user context has its own feature map. Table 3 Lists the
accuracy of personal user context extraction. In the
experiment, we identified the context which has the
maximum probabilities in probabilities of the other
contexts.
According to the above Table 3, our proposed al-
gorithm can extract and discriminate the above gaits
as personal user context independent of cell phone
(a) Walking at normal speed
(b) Going up stairs
Similar Waves
Best Basis 3.1
Best Basis 2.1
Figure 6: Sensor Data Decomposited by Wavelet Packet.
Table 3: the accuracy of personal user context extraction.
Cell Phone Probabilities [%]
Position WN US DS WF RN
Breast pocket 83.2 79.3 76.6 88.4 94.2
Hip pocket
85.1 88.5 72.1 94.9 92.0
Average 84.2 84.1 74.4 91.6 93.1
position. Other tests showed that the proposed al-
gorithm can extract not only walking (WN) and run-
ning (RN) but also going up/down stairs (US/UD) and
walking fast (WF). The most difficult gait to identify
was DS (”going down stairs”). We think that DS has
weaker constraints on body movement than the other
gaits such as US (”going up stairs”) and RN (”run-
ning”). Many DS events were misidentified as ”walk-
ing at normal speed” or ”walking fast”. We need to
enhance the algorithm to provide a more detail analy-
sis of the sensor data.
5 CONCLUSION
We proposed an algorithm to extract personal user
context; it uses feature extraction based on wavelet
packet decomposition and KSOM with the context
appearance probabilities. Experiments on a prototype
system showed that in case that the cell phone with the
sensor was not fixed in user’s pockets, it could extract
personal user context at the accuracy of about 88[%].
Moreover, we showed that, with only a single three-
axis accelerometer, it could extract personal user con-
texts such as walking, running, walking fast, and go-
ing up/down stairs at the accuracy of about 80[%].
SIGMAP 2006 - INTERNATIONAL CONFERENCE ON SIGNAL PROCESSING AND MULTIMEDIA
APPLICATIONS
230
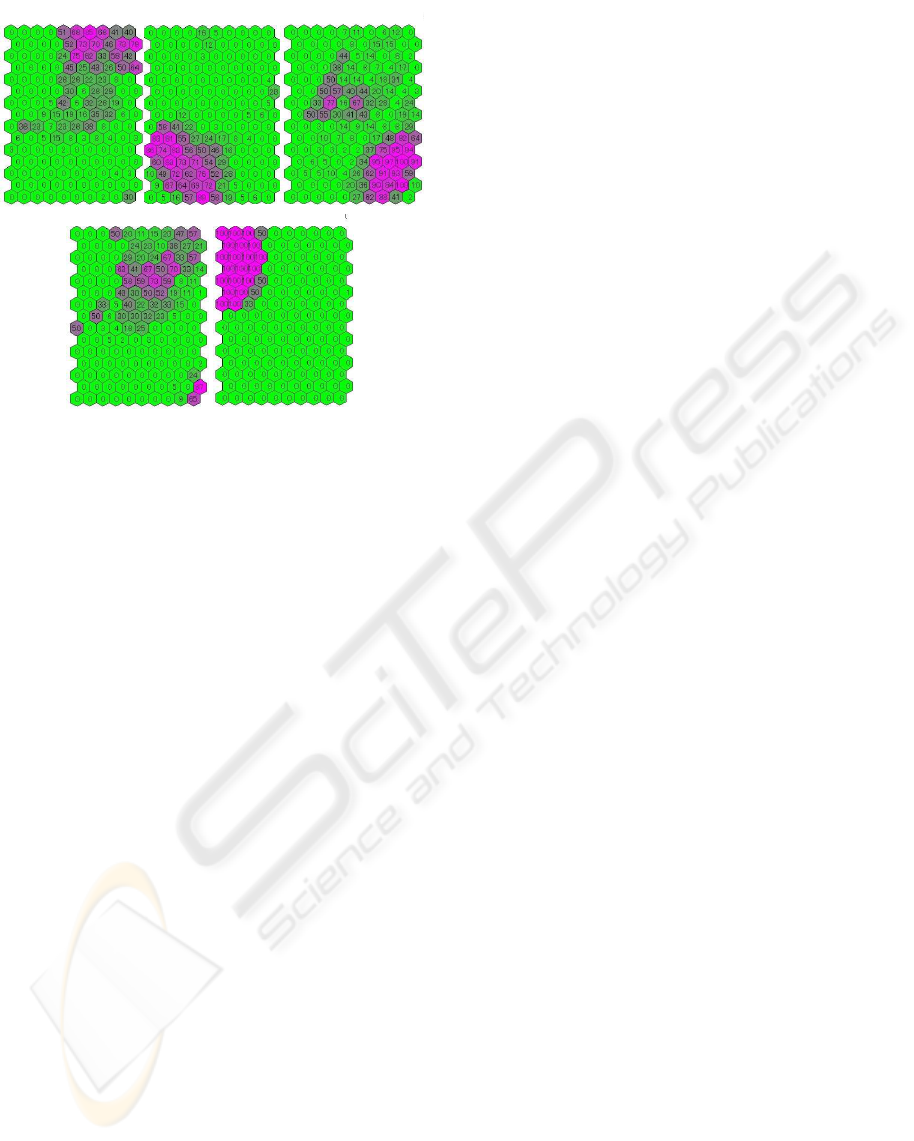
Walking at normal speed Going up stairs Going down stairs
Walking fast Running
Walking at normal speed Going up stairs Going down stairs
Walking fast RunningWalking fast Running
Figure 7: Learnt Feature Map with Probability Information.
The results prove that the algorithm can not only
reduce the constraints placed on users but also be ap-
plied for ubiquitous services which require personal
user context.
Future works is to realize a more comprehensive
analysis of sensor data in order to identify personal
user context in more complicated situations such as
carrying the cell phone by hand. We will then apply
the algorithm to ubiquitous services such as presence
and health care services.
ACKNOWLEDGEMENTS
The authors would like to thank Dr. K. Imai, NTT
DoCoMo Network Labs for his encouragement. We
also thank Mr. M. Kinoshita, NTT-IT Corporation and
Mr. H. Miyoshi, Seiko Epson Corporation for their
technical support in the experiments.
REFERENCES
Clarkson, B., Mase, K., and Pentland, A. (2000). Recogniz-
ing user’s context from wearable sensor’s: Baseline
system. Technical Report 519.
DeVaul, R. W. and Dunn, S. Real-Time Motion
Classification for Wearable Computing Applications.
http://www.media.mit.edu/wearables/mithril/
realtime.pdf.
Healey, J. and Logan, B. Wearable Wellness Mon-
itoring Using ECG and Accelerometer Data.
http://www.hpl.hp.com/techreports/2005/HPL-2005-
134.pdf.
Ishikawa, Y. (2000). Wavelet Analysis for Clinical Medi-
cine. IGAKU-SHUPPAN.
Iso, T., Kawasaki, N., and Kurakake, S. (2005). Per-
sonal context extractor with multiple sensors on a cell
phone. In 7th IFIP International Conference on Mo-
bile and Wireless Communications Networks, 2005.
K. V. Laerhoven, A. Schmidt, H. W. G. (2003). Limitations
of multi-sensor context-aware clothing. 7(3).
Kern, N., Antifakos, S., Schiele, B., and Schwaninger,
A. (2004). A model for human interruptability: ex-
perimental evaluation and automatic estimation from
wearable sensors. In 8th IEEE International Sympo-
sium on Wearable Computers.
Kohonen., T. SOM Toolbox 2.0. The Labora-
tory of Information and Computer Science
in the Helsinki University of Technology,
http://www.cis.hut.fi/projects/somtoolbox/.
Krause, A., Siewiorek, D. P., Smailagic, A., and Farring-
don, J. (2003). Unsupervised, dynamic identifica-
tion of physiological and activity context in wearable
computing. In 7th IEEE International Symposium on
Wearable Computers, pages 8–17.
M. Unuma, K. Kurata, A. T. T. H. (2004). Autonomy posi-
tion detection by using recognition of human walking
motion. J87-A(1):78–86.
Miao, T., Shimizu, T., Miyake, S., Hashimoto, M., and Shi-
moyama, O. (2003). Alteractions of complexity mea-
sures during subsidiary task in multi-attribute opera-
tions. In Human Interface Symposium, pages 791–
792.
NTT DoCoMo, Inc. http://www.nttdocomo.com/home.html.
Randell, C. and Muller, H. (2000). Context awareness
by analysing accelerometer data. Technical Report
CSTR-00-009.
Si, H., Kawahara, Y., Kurasawa, H., Morikawa, H., and
Aoyama, T. (2005). A context-aware collaborative fil-
tering algorithm for real world oriented content deliv-
ery service. In Ubicom2005 Metapolis and Urban Life
Workshop.
Siewiorek, D., Smailagic, A., Furukawa, J., Krause, A.,
Moraveji, N., Reiger, K., Shaffer, J., and Wong, F. L.
(2003). Sensay: A context-aware mobile phone. In 7th
IEEE International Symposium on Wearable Comput-
ers, pages 248–257.
EXTRACTING PERSONAL USER CONTEXT WITH A THREE-AXIS SENSOR MOUNTED ON A FREELY
CARRIED CELL PHONE
231
