
QOS MONITORING AND FAULT DETECTION USING CALL
DETAIL RECORDS
A Different Approach that has Come to Add Value
Gean Davis Breda, Leonardo de Souza Mendes
Universidade Estadual de Campinas – Unicamp, Telecommunications Department, Faculty of Eletrical Engineering
Campinas, Brazil
Keywords: Qos Monitoring, Performance Evaluation, Call Detail Records, Management Systems, Failure Detection.
Abstract: The purpose of this paper is to demonstrate an algorithm to monitor the QoS and, while monitoring, detect
the occurrence of failures in wireless and wireline communication systems. It’s a new approach based on the
analysis of data stored in Call Detail Records (CDR). Each time a call is made in a voice system, VoIP or
PSTN, a detailed record is generated. Detail Records are tickets whose data provide information related to
the system elements involved, such as time and duration of the call, phone types and numbers, SS7
signaling, etc. The tickets are generated and stored either in PSTN switches or in VoIP gateways. For VoIP
systems the detail records are usually called IPDR (Internet Protocol Detail Record). As we have already
mentioned, the algorithm works on the information stored in Detail Records. So, our main goal here is to
show, analyze and classify this algorithm according to its performance and use.
1 INTRODUCTION
In the analysis and production of information
performed by Telecom companies we often see a
rather technical and immediate approach, frequently
disregarding important information collected and
stored in the Telecommunications Management
Databases. An important example of such occurrence
can be found when we analyze the use of Call Detail
Record. Currently, their only function in Telecom
Companies is dispose information to the billing
system. CDRs are tickets whose data provide many
information related to the call, such as time and
duration, phone types and numbers, SS7 signaling,
etc. The tickets are generated either in the PSTN
switches or in VoIP gateways, in the case of Internet
Protocol Detail Record, IPDRs.
The objective of this paper is to analyze an
algorithm that can be used for monitoring the QoS
and, in this process, detect failures in wireless
systems (voice communication systems). It is based
on a new approach to where the information
contained in CDR is subjected to several treatments
and analysis. For CDR we mean the Call Detail
Records (Ginzboorg, 2000), for conventional
networks, or the Internet Protocol Detail Record
(IPDR Organization, 2004) (Borthick, 2001), for
VoIP networks.
There are basically no conceptual differences
between CDR and IPDR, therefore, the algorithm
can be equally applied to both cases. Detail records
have a complete range of information that contains
the entire history of a call. It is unlikely that the
information contained in the detail records can be
found anywhere else on the telephone network. Some
examples of information that a detail record contains
are: switch’s name and point code, in/out voice
trunks, in/out voice time slots, origin and terminal
BTS (base transceiver station) number, origin and
terminal RF channels (Radio Frequency), switch
peripheral components (through where the call
passes inside the switch), calling and called phone
numbers, serial phone number, dialed number,
transferred number, phone features, starting and
ending conversation time, call duration, signaling
duration time, SS7 signaling information, internal
call transit, type of response for the call, what
happened to the call, etc. The majority of the
elements contained in detail records can be
monitored in order to detect failures.
Another characteristic of the detail records is
reliability. This allows us to work with the detailed
information contained in the CDR to perform critical
tasks with large confidence in the results. In a
95
Davis Breda G. and de Souza Mendes L. (2006).
QOS MONITORING AND FAULT DETECTION USING CALL DETAIL RECORDS - A Different Approach that has Come to Add Value.
In Proceedings of the International Conference on Wireless Information Networks and Systems, pages 95-100
Copyright
c
SciTePress

broader view, we can consider the possibility of
using CDR to perform from simple tasks like traffic
monitoring (Chen, Hsu, Dayal, 2000) (Sestak, Kaye,
1990) to complex ones, like the analysis of social and
economic aspects of the system (Yan, et al., 2005).
Such analysis can be performed once each call
received or originated from the system has a
correspondent detail record, making it possible to
analyze the behavior of each user/element in the
network. Therefore, the use of detail records, along
with the algorithms presented here, can help decrease
economic losses as well as lower complaints
associated to a deficient Quality of Service (Mozer,
et al., 2000).
There is only a handful of publications available
about CDRs and IPDRs. Since the CDR and IPDR
carry very strategic information for the operators and
suppliers, it is understandable the reason why
Telecom companies choose to restrict the
information associated to it. There are some works
developed for the use of CDR in Fraud Detection
(Dong, et al., 2004) (Rosset, et al., 1999). In these
works, information is extracted from CDR and used
to build up customer profiles. Other works that use
CDR are related to data mining (Cortes, et al., 2004)
(Trisolini, et al., 1999). As far as we know, there are
no publications using detail records to monitor the
QoS and, consequently, no ways to detect failures in
communications systems.
The remainder of this paper is organized as
follows: in section 2, we describe detail records
classification; in section 3, the algorithm is
introduced and its performance is analyzed; finally,
in section 4, we present the conclusions of this work.
2 RECORDS CLASSIFICATION
The classification of a detail record, which we call
event, is a representation of what happened in a
specific telephone call. It’s much like attributing a
badge or label to each possible call termination. For
instance, if a call were successfully concluded, in
which user “A” spoke to user “B” and the call was
finalized by any of the users, we would have an OK
call. This classification is necessary in order to
identify the system behaviour in all of its range and
paths where the call has been through.
In telephone switchs of some Telecom
companies, such as Nortel (Northern Telecom,
1998), Motorola (Motorola, 1998), and Ericson
(Ericson, 2001), it is possible to classify a detail
record in approximately 300 different ways of a call
termination, which can be considered a highly
detailed classification. This type of classification can
be extremely useful when we are looking for the
cause/origin of a problem in the system. Some
examples of classification: Carrier Loss (CL), RF
channel dropped (RFD), User B does not answer
(UA), User B busy (UB), Technical failure (TF),
Incorrect Dialing (ID), etc.
In Figure 1, we have a flowchart of a typical
call showing some possible events that may happen
in a call attempt.
3 ALGORITHM
We are going to use the algorithm for the monitoring
of the different resources in a wireless
communication system. By resource, we refer to all
the elements in the system, both logical and physical.
A physical resource, as the name says, is related to a
physical component of the system, such as switch
name, BTS number, RF channel, phone number, etc.
A logical resource is a definition like the country and
area codes in the call direction monitoring, switch
software components, etc. The information about the
resources are contained in the detail records. By
monitoring these resources, we aim at following the
behavior of all the events associated to that specific
resource. A resource fails when one or more events
associated to this resource fails. It means that when
we are monitoring a resource in fact we are
monitoring the QoS of each event related to that
resource. In a general way the QoS term is related
with the reliability of the resources, but it can have a
different meaning depending the resource that is
being monitored.
Following, we present the algorithm called Real Time
Algorithm which can be used to detect failures using
CDRs contained in database of telecommunication
management systems of Telecom companies.
Call
Attempt
Detail
Reco rd
Generated
•UserB does notanswer(UA);
• User B busy (UB);
• Resources Overload (RO);
• Technical Failure (TF);
• Incorrect Dialing (ID);
• Premature Hang Off (PH);
•Carrier Loss(CL);
• RF Channel Dropped RFD);
• Congestion (CO);
•...
Call OK
Retry
Call Abandon
Call
Attempt
Detail
Reco rd
Generated
•UserB does notanswer(UA);
• User B busy (UB);
• Resources Overload (RO);
• Technical Failure (TF);
• Incorrect Dialing (ID);
• Premature Hang Off (PH);
•Carrier Loss(CL);
• RF Channel Dropped RFD);
• Congestion (CO);
•...
Call OK
Retry
Call Abandon
Figure 1: Call’s Flowchart.
WINSYS 2006 - INTERNATIONAL CONFERENCE ON WIRELESS INFORMATION NETWORKS AND SYSTEMS
96

3.1 Real Time Algorithm
The Real Time Algorithm is based on the Renewal
Theory (Feller, 1968) (Cox, 1970) (Nunes, 2001)
applied to Bernoulli trials. The term “Real Time”
means that the algorithm can be run on tickets in the
same time that they are generated and stored.
Another possibility is to run the algorithm offline on
tickets already generated and stored.
To explain the algorithm, we will start to model
the events of the system as random variables. For
example, let X be a random variable that represents a
specific event in a Bernoulli experiment. The Sample
Space of X can take two values
⎭
⎬
⎫
⎩
⎨
⎧
=
0
1
X ,
(1)
where the value X = 1 stands for the occurrence of a
specific event and 0 the occurrence of any other
event. Let’s also assume the probability of X = 1
being equal to p.
Now, we introduce a new random variable Y,
which is the number of events occurring until a
sequence of r ones is formed for the first time, as we
can see from Figure 2. According to the Renewal
Theory, N = E(Y), the mean or the expected value of
Y, can be given as
)1(
1
)(
pp
p
NYE
r
r
−
−
==
.
(2)
Isolating variable r in (2), we obtain
[]
p
pN
r
ln
1)1(ln +−−
=
.
(3)
The value of r should always be rounded to the next
integer number in order to assure that the probability
of occurrence of a false positive alarm is restricted to
a certain limits. Then, we should modify the last
equation as
[]
⎥
⎦
⎤
⎢
⎣
⎡
+−−
=
p
pN
INTr
ln
1)1(ln
.
(4)
As a result, this last equation gives the number of
times, r, that an event should happen consecutively
for the correspondent fault to be considered as
having happened. The quantity is directly related to
the probability p and the value N. N is directly
related to the guarantee that a false positive alarm
will be generated in the stipulated limit. We can use
many values for N in accordance with the
necessities. In the example that follows N is equal to
100,000 meaning one false positive alarm in 100,000
alarms. This value is a good level of confidence to be
used.
To analyze the relationship among the quantities,
let’s suppose, for example, that an event has an
average of occurrence of 1% (p = 0.01) and that N is
100,000. Then, by inserting these values in (4) we
obtain that r=3. Therefore, if there are 3 or more
consecutive events an alarm will be generated. If we
want to have a greater guarantee, a bigger N, that a
real fault in fact occurred, that is, a lower probability
of a false positive alarm, we must observe the
corresponding event sequentially occurring in a
larger number of times.
Y
1 1 1 0 0 0 0 1 1 0 . . . . . . . . . . . 1 1 0 0 1 0 1 1 1 1 1 . . . 1 1 1
Sequence of “r” ones
Y
1 1 1 0 0 0 0 1 1 0 . . . . . . . . . . . 1 1 0 0 1 0 1 1 1 1 1 . . . 1 1 1
Sequence of “r” ones
Figure 2: Random Variable.
3.2 Experiment
The algorithm’s performance was tested using data
from real voice communication systems, in this case,
a Brazilian cellular communication company. This
company has 5 million customers appoximately and
uses CDMA technology.
We applied the algorithm to analyze faults of
various resources of the system, such as, Base
Transceiver Station, RF channels, time slots, specific
peripheral controllers, etc. The results shown in
Figure 3 synthesize the behavior of a Base
Transceiver Station (BTS) of a cellular system with
high traffic density.
The algorithm behavior was tested over different
quality levels or probability p, which assumed the
values 1%, 2%, 7%, 17%, 27%, 37%, 47%, 57%,
67% and 77% . For each level we find, by using
formula (4), the number r for detection of failure for
that specific event. The quality level or probability p
is used here as the Acceptance Quality Level (AQL).
The method adopted in the fault detection was to
degrade the QoS of the BTS through random
generation of problems in the RF channels. The
troubleshooting was generated in a cumulative form,
which means, a RF channel with a normal behavior
starts to behave irregularly, presenting problems. In a
second instant another channel starts to present the
same failure and so on successively. As more
channels present problems the QoS degrades. Each
time the QoS degrades the algorithm is applied in
order to detect any anomalies.
QOS MONITORING AND FAULT DETECTION USING CALL DETAIL RECORDS - A Different Approach that has
Come to Add Value
97
The detection of this type of failure is complex,
considering that the generation of these problems is
purely random. It will be easier and faster to detect it
if there is some order in the degradation of resources.
An order presumes smaller entropy or a greater
amount of information than just purely random
occurrences.
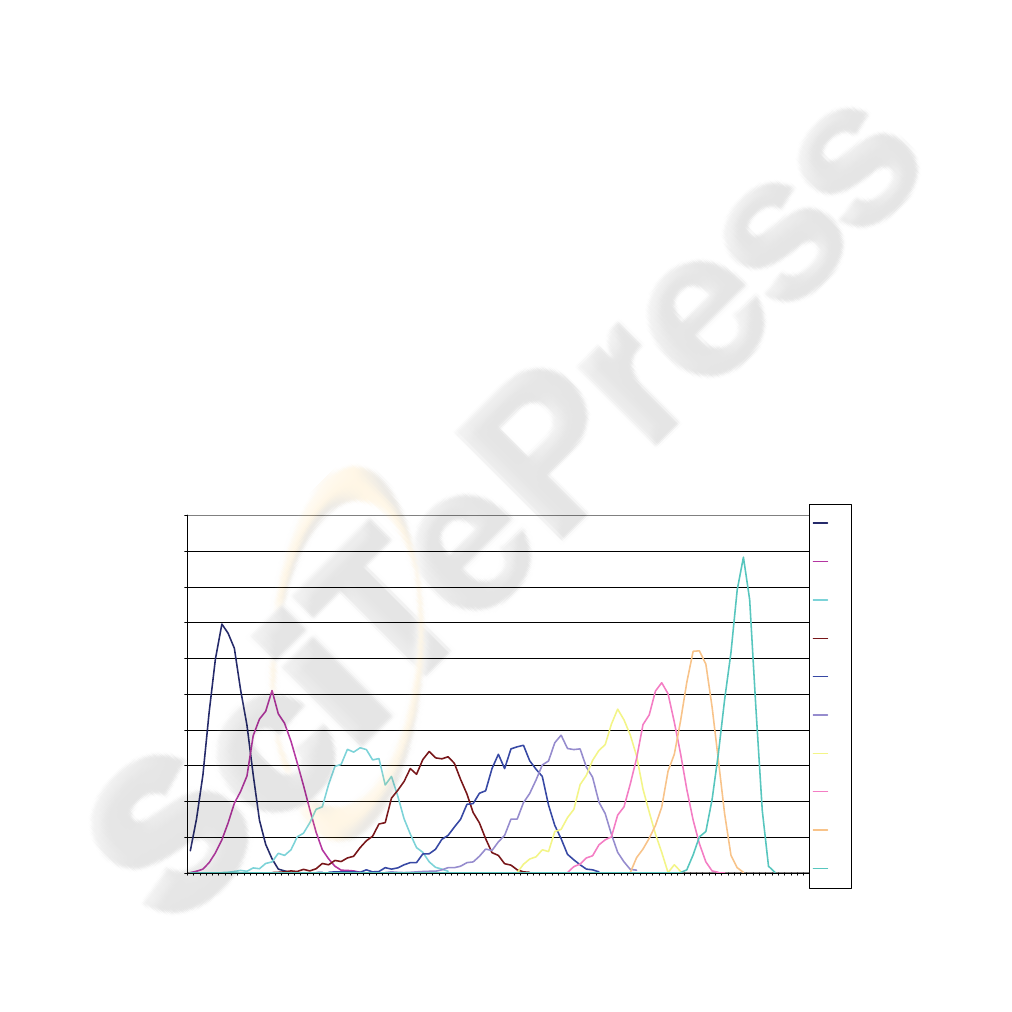
3.3 Results
Each curve in Figure 3 represents the algorithm’s
behavior for one specific quality level or probability
p. Each curve was created through the degradation of
QoS on the BTS, represented on the horizontal axes.
Around 5,000 experiments were done for each
probability p, each curve, and evaluated in each
experiment the value of degradation (%) of the QoS
in which the failure was detected. The results are
curves similar to Normal Distribution.
Each curve basically shows that if a resource
starts to degrade its QoS, this degradation will be
monitored by the algorithm according to the behavior
of the specific curve shown in Figure 3. In order to
know the probability of failure detection on a
resource when the quality level is, for instance, 3%
and the degradation is, for instance, 10%, it is
necessary to integrate, on the relative curve, from the
initial point until to the point 10%. This represents
the Cumulative Distribution Function and expresses
the chance of detection.
As the degration in the QoS increases the
probability of detention of the failure also increases.
When the degradation in the resource is caused by a
small failure that causes small changes in the QoS,
the algorithm can or not detect the failure.
Another important variable that should be
measured is the amount of time needed to detect the
fault. We could observe that the algorithm’s behavior
related to time detection varies according to the
quality level as well as the QoS degradation level.
We concluded that these algorithms are extremely
efficient once there is a great degradation on the QoS
of a resource. In these cases, the failure detection
only takes a few seconds.
When degradation is not so critical, the algorithm
may or may not detect the failure. Therefore, there is
no way to guarantee the exact moment the
degradation on the QoS will be detected. This can be
verified by inspecting the four graphs in Figure 4,
where we have a representation of the BTS behavior
with quality level or p equals to 12% and with a
degradation of 24.7%, 44.5%, 64.3% and 74,2%,
respectivelly. Degradation of 24.7% means that
24.7% of all RF channels in the BTS are out of
service. The horizontal axis represents the time in
which the failure was detected and the vertical axis
shows the amount of times in which the failure was
detected in the total of 4,000 experiments.
Different Quality Levels
0
100
200
300
400
500
600
700
800
900
1000
1
4
7
10
13
16
19
22
25
28
31
34
37
40
43
46
49
52
55
58
61
64
67
70
73
76
79
82
85
88
91
94
97
Response related to Degradation of the Resource (%)
Occurences
1%
2%
7%
17%
27%
37%
47%
57%
67%
77%
Figure 3: Response related to the BTS’ degradation.
WINSYS 2006 - INTERNATIONAL CONFERENCE ON WIRELESS INFORMATION NETWORKS AND SYSTEMS
98


Knowledge discovery and data mining, pp: 409-413,
August 1999.
Cortes, C., Fisher, K., Pregibon, D., Rogers, A., Smith, F.,
2004. “Hancock: A language for analyzing
transactional data streams”, in ACM Transactions on
Programming Languages and Systems (TOPLAS),
Vol. 26, Issue 2, pp: 301-338, March 2004.
Trisolini, S., Lenzerini, M., Nardi, D., 1999. “Data
integration and warehousing in Telecom Italia” in
proc. ACM SIGMOD international conference on
Management of data SIGMOD, Vol. 28, Issue 2, pp:
538-539, June 1999.
Northern Telecom, Inc., 1998. “Billing Management”,
Version MTX 07-Preliminary 06.01, Northern
Telecom, March 1998.
Motorola, Inc., 1998. “Call Final Class (CFC)
Definitions”, Motorola, Inc., November 1998.
Ericson, Inc., 2001. “Mapping of Cause Codes and
Location Information”, Ericson, Inc., January 2001.
Feller, W., 1968. “An introduction to Probability Theory
and Its Applications – Volume 1”, Chapter XIII, p.
303-341, John Wiley & Sons, Inc.
Cox, D.R., 1970. “Renewal Theory”, Mthuen &
Company.LTD;
Nunes, G., 2001. “Probability Theory and Renewal
Theory”, Curse of Probability theory applied to
Engineering, unpublished.
WINSYS 2006 - INTERNATIONAL CONFERENCE ON WIRELESS INFORMATION NETWORKS AND SYSTEMS
100
