
USERS’ DISSATISFACTION PERFORMANCE FOR MOBILE
COMMUNICATION NETWORK
An AHP Approach
Kei Oguchi, Yoshitaka Takahashi
Faculty of Commerce, Waseda University, 1-6-1 Nishiwaseda, Shinjuku, Tokyo 169-8050, Japan
Kentaro Hoshi
Graduate School of Global Information and Telecommunication Studies, Waseda University,
1-6-1 Nishiwaseda, Shinjuku, Tokyo 169-8050, Japan
Shigeru Kaneda, Yoshikazu Akinaga
Network Laboratories, NTT DoCoMo, Inc., 3-5 Hikarinooka,Yokosuka, Kanagawa, 239-8536, Japan
Keywords: AHP (Analytic Hierarchy Process), Teletraffic analysis, Traffic control, User lead.
Abstract: In this paper, we deal with a mobile communication network via an AHP (Analytic Hierarchy Process)
approach. To apply the AHP approach, we first consider three hierarchies; goal, dissatisfaction, and traffic
control schemes (spatial distribution, time distribution, and traffic reduction). We then assume practical
situations where network congestions occur; a terrible earthquake, a large firework, and a popular ticket
reservation. Based on these situations we propose an internet AHP questionnaire. Analyzing the AHP
questionnaire results, we finally evaluate users’ dissatisfaction regarding these traffic control schemes.
Namely, we show how badly traffic control schemes perform for mobile communication network from
users’ point of views.
1 INTRODUCTION
In a terrible earthquake and a large firework, and for
a popular ticket reservation, mobile communication
traffic may exceed the system capacity to deteriorate
the network performance. Several important traffic
control schemes have previously proposed to avoid
this network performance deterioration. Above all,
Akinaga and Kaneda have proposed traffic control
schemes (Akinaga, 1999); spatial distribution, time
distribution, and traffic reduction. By spatial
distribution, we mean that users are recommended to
move in an area where communication channels are
not so busy. Traffic can be spatially distributed. By
time distribution we mean that users are
recommended to wait for a while so that users can
access the network with a higher probability. Traffic
can be distributed over a period of time. By traffic
reduction we mean that users are recommended to
change from voice service into data (e-mail or web)
service. Traffic can be reduced since data service
channel holding time is known to be much shorter
than voice service time. However, there are very
few literatures on studying the relationship between
user satisfaction (dissatisfaction) and the effect of
traffic control scheme. The main purpose of this
paper is to provide this relationship by using an AHP
(Analytic Hierarchy Process) approach.
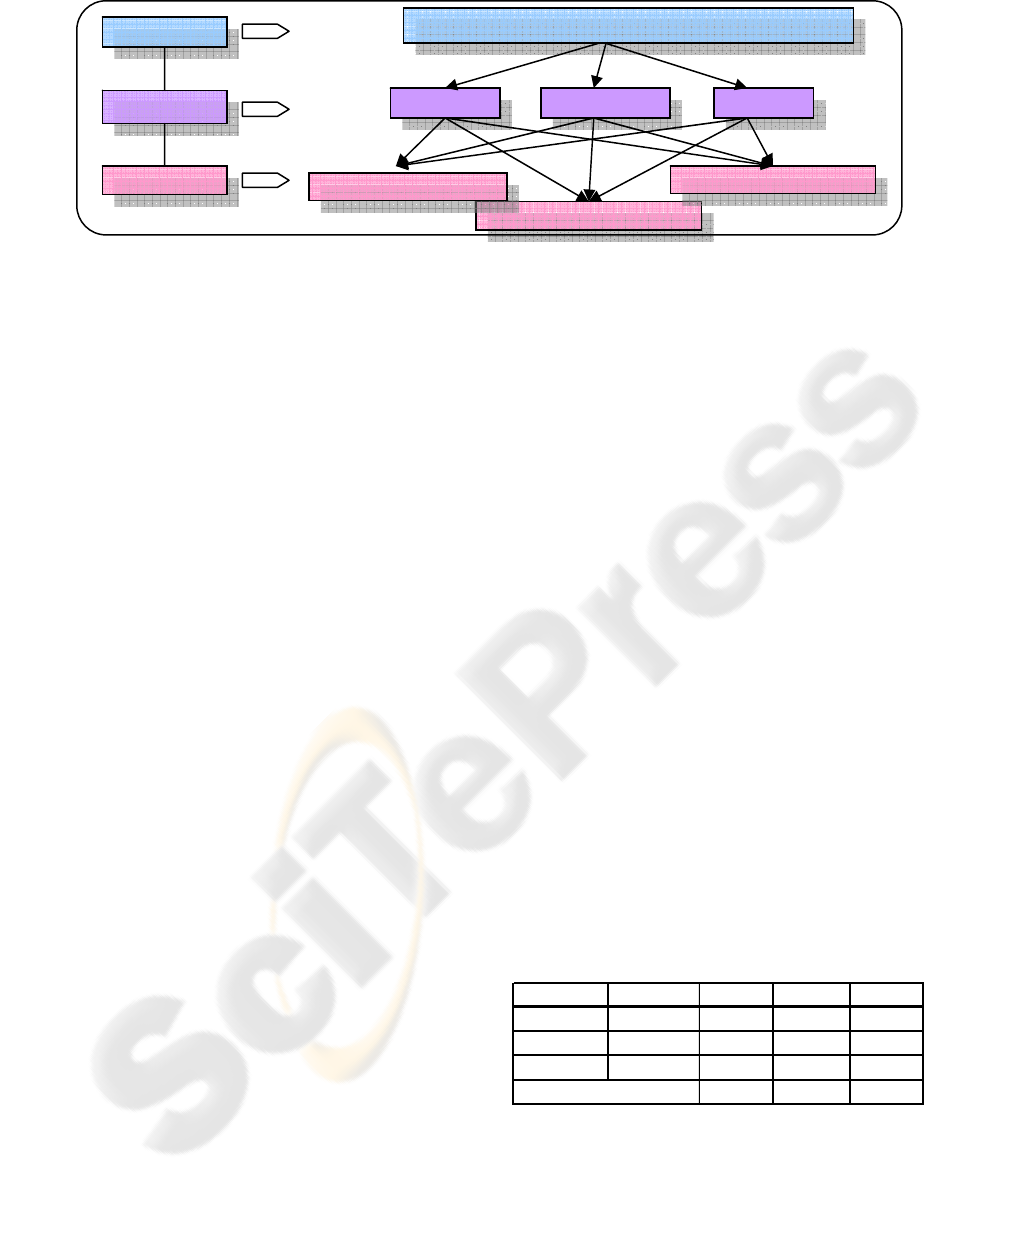
To apply the AHP approach, we consider THREE
levels; 1) goal, 2) dissatisfaction
and 3) traffic
control schemes (see Figure 2 for details). The top
level corresponds to our problem goal. At the
second level dissatisfaction is evaluated from three
view points (usability, preference, and reliability).
At the bottom level we consider three traffic control
schemes proposed in (Akinaga, 1999): spatial
distribution, time distribution, and traffic reduction.
The rest of this paper is organized as follows.
Section 2 illustrates how network congestions occur
and traffic control is of practical importance.
Section 3 describes three traffic control schemes at
the above-mentioned bottom level for more details.
143
Oguchi K., Takahashi Y., Hoshi K., Kaneda S. and Akinaga Y. (2006).
USERS’ DISSATISFACTION PERFORMANCE FOR MOBILE COMMUNICATION NETWORK - An AHP Approach.
In Proceedings of the International Conference on Wireless Information Networks and Systems, pages 143-146
Copyright
c
SciTePress
Section 4 is devoted to consider practical situations
where network congestions occur. Based on these
situations we propose an AHP questionnaire.
Section 5 finally analyzes the AHP questionnaire
results to evaluate users’ dissatisfaction performance
for mobile communication networks. Section 6
summarizes our results and describes our future
research topics.
2 CONGESTION
Congestion is the situation that something
concentrates on one place. When the telephone
communication traffic increases and the
communication demand to exceed the network
accommodation is generated, congestion is caused.
When customers begin to reserve various tickets and
when the disaster occurs, congestion causes. For the
congestion avoidance, the network side manages to
restrict the traffic. Previously congestion research
focus on restricting the traffic on the network side
and maintaining the system in congestion. When
user wants to use mobile phone, the user cannot use
it because the network side limits the demand
temporarily and compulsorily. In congestion, the
user cannot use the service and dissatisfaction
remains. The new method is needed.
3 TRAFFIC CONTROL
SCHEMES
There is a method of user interactive control. The
idea can control users before they flow in the
network so that the user can be appropriately
induced. Users’ service chance can be improved by
combining with the traffic control. The inflow
traffic to the network can be controlled by
dynamically inducing the users’ behaviour. When
the network communication demand increases, this
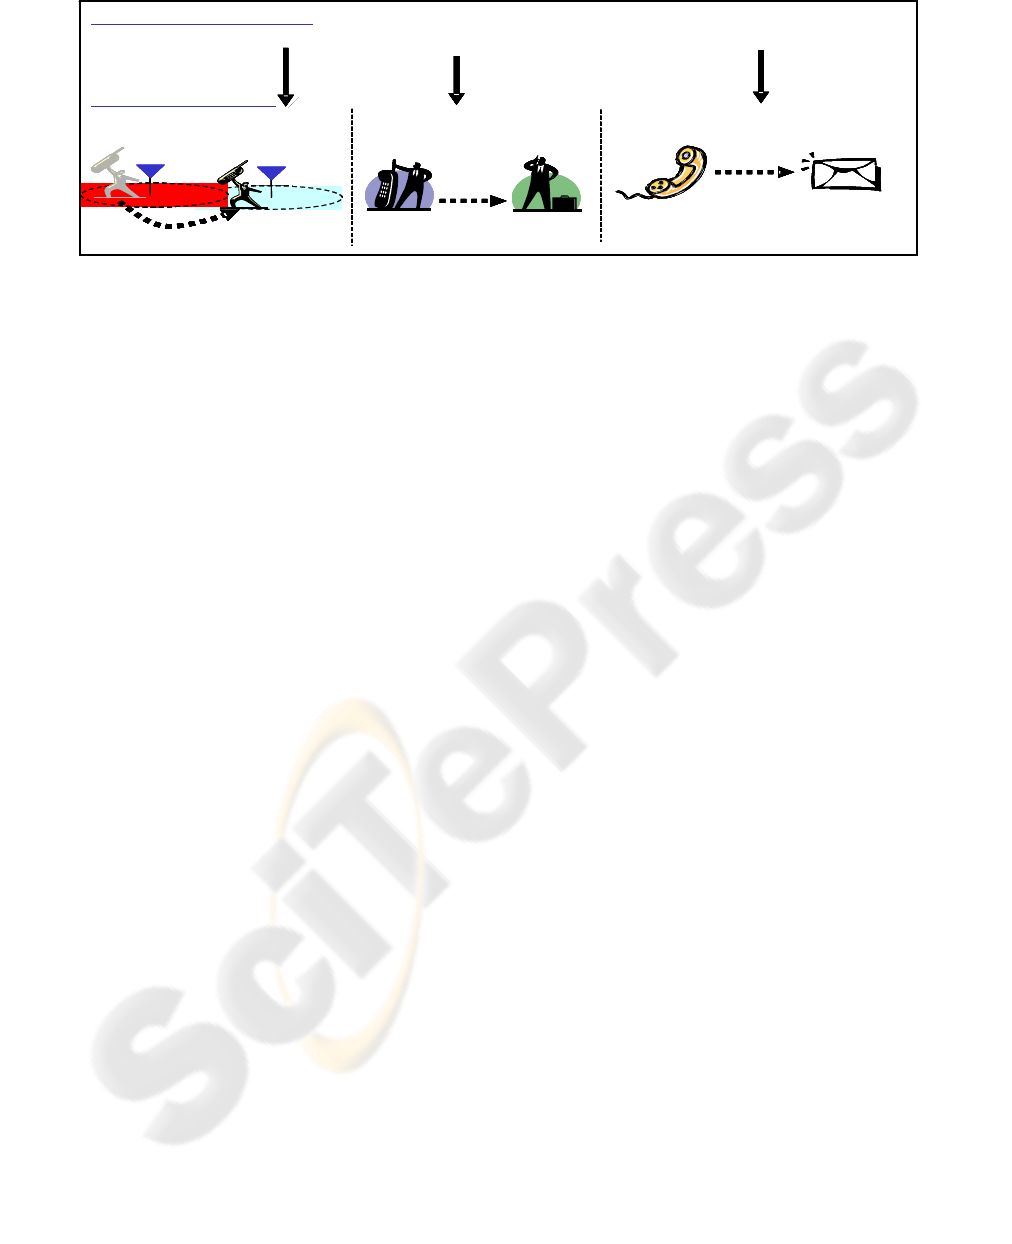
method shows that the traffic is distributed by three
methods (spatial distribution, time distribution, and
traffic reduction). In this paper, spatial distribution
is defined as the spatial movement, time distribution
is defined as the time shift, and traffic reduction is
defined as other media recommendation (see
Figure 1). This method also assumes reducing the
traffic by using other media such as mail, the web
use, and the push talk instead of the user's using the
telephone. We assume three situations, and induce
the user. Three situations are a terrible earthquake,
a large firework, and ticket reservation for events.
When taking it as an example of a terrible
earthquake, when the user tries the call out, and not
connecting, the voice guide said “The telephone is
not connected due to a terrible earthquake.” The
announcement must tie according to three movement
patterns after this guide.
“It becomes easy to connect the telephone in
several-meter previous Tokyo Station area.”
(spatial movement)
“It becomes easy to connect the telephone after
several minutes.” (time shift)
“It becomes easy to connect the telephone in case
of the use for E-mail etc.” (other media
recommendation)
The guides add after the announcement each
situation, and lead the user. We work for the
congestion avoidance.
4 AN AHP QUESTIONNAIRE
AHP (Analytic Hierarchy Process) is a hierarchy
decision making method. This method is a
technique for challenging the possession of a
scientific approach for various trade-offs and the
opinion collisions encountered by the scene of the
Traffic control schemes
①
spatial distribution
②
time distribution
③
traffic reduction
①spatial movement ②time shift ③other media recommendation
「move」
「wait 」
「other media」
①
User lead
(voice service to data service )
Traffic control schemes
①
spatial distribution
②
time distribution
③
traffic reduction
①spatial movement ②time shift ③other media recommendation
「move」
「wait 」
「other media」
①
User lead
(voice service to data service )
Figure 1: Traffic control schemes.
②
t
i
me
di
str
ib
ut
i
on
WINSYS 2006 - INTERNATIONAL CONFERENCE ON WIRELESS INFORMATION NETWORKS AND SYSTEMS
144
decision making and the solutions. AHP enables
people to make a decision containing many kinds of
considerations. While general statistics are
objectivities, AHP makes the analytical result
objectivity by expressing people's subjectivity and
intuitions numerically. There are a lot of things to
which AHP is actually applied. The effect in the
place of the decision making is clear and is
remarkable. The problem when the questionnaire is
executed has the inclusion of a point to need a big
sample and non-logical answer in the questionnaire
total result. In the setting of the questionnaire item
by using AHP, a big sample like a statistical analysis
is not necessary. Non-logical answer can be
excluded according to CI (Consistency Index)
requested by AHP (Saaty, 1980). The points are the
reasons to introduce AHP that the comparative
assessment in the mind can be correctly shown and
non-logical answer can be deleted. This paper has
aimed to measure users’ dissatisfaction, and to
understand the characteristic of the action. The
opinion like the vote is not good when thinking
about the communication quality of service. We can
show the plan of which everyone can compromise
convincing considering all psychological priority
levels by the result of AHP. The AHP questionnaire
has a pair-wise comparison. A pair-wise
comparison makes the priority level of each user and
the action based on the priority. We made a
questionnaire with three evaluation items (usability,
preference, and reliability) for users’ dissatisfaction.
We can quantitatively understand the priority of the
user. As in Figure 2, the hierarchy diagram that uses
AHP hierarchically constructs goal, dissatisfaction
(usability, preference, and reliability), and traffic
control schemes (spatial distribution, time
distribution, and traffic reduction). We made the
questionnaire for the respondent to execute directly
the pair-wise comparison. There are three
situations; A terrible earthquake: Situation in which
user calls terrible earthquake to know safety of
important person in the emergency. A large
firework: Situation in which user who gets lost and
cannot contact the other party to friend in a large
firework calls. Ticket reservation: Situation in
which user calls for early ticket’s reservation of
event and tries redial until the ticket reservation can
be taken.
5 RESULTS AND ANALYSIS
We made Waseda university students as well as
Fukagawa high school students reply to the
questionnaire from December, 2005 to February,
2006 through the Internet. We totaled result of the
questionnaire, and analyzed it by AHP. The data of
CI 0.1 or more was deleted (Hoshi 2006). The AHP
data of the group can be requested by using
individual AHP data. From questionnaire result, we
formulate a pair-wise comparison matrix (p.c.m.).
We then calculate the maximum eigenvalue of the
matrix (p.c.m.). Though this process, we obtain a
user’s dissatisfaction for an individual questionnaire
respondent. Taking the geometric average over
individual pair-wise matrices enables us to finally
get the total users’ dissatisfaction (Hoshi, 2006).
Table 1: Group dissatisfaction at a terrible earthquake.
Importance
Spatial Time
Other media
Usability
0.248 0.423 0.255 0.322
Preference
0.186 0.423 0.255 0.322
Reliability
0.567 0.365 0.277 0.358
Dissatisfaction
0
.
390
0
.2
67
0
.
3
42
selection
time distribution
usability
time
di t ib ti
l
t
i
spatial distribution
traffic reduction
goal
traffic control
dissatisfaction
Figure 2: Hierarchal questionnaire concept.
USERS’ DISSATISFACTION PERFORMANCE FOR MOBILE COMMUNICATION NETWORK - An AHP Approach
145
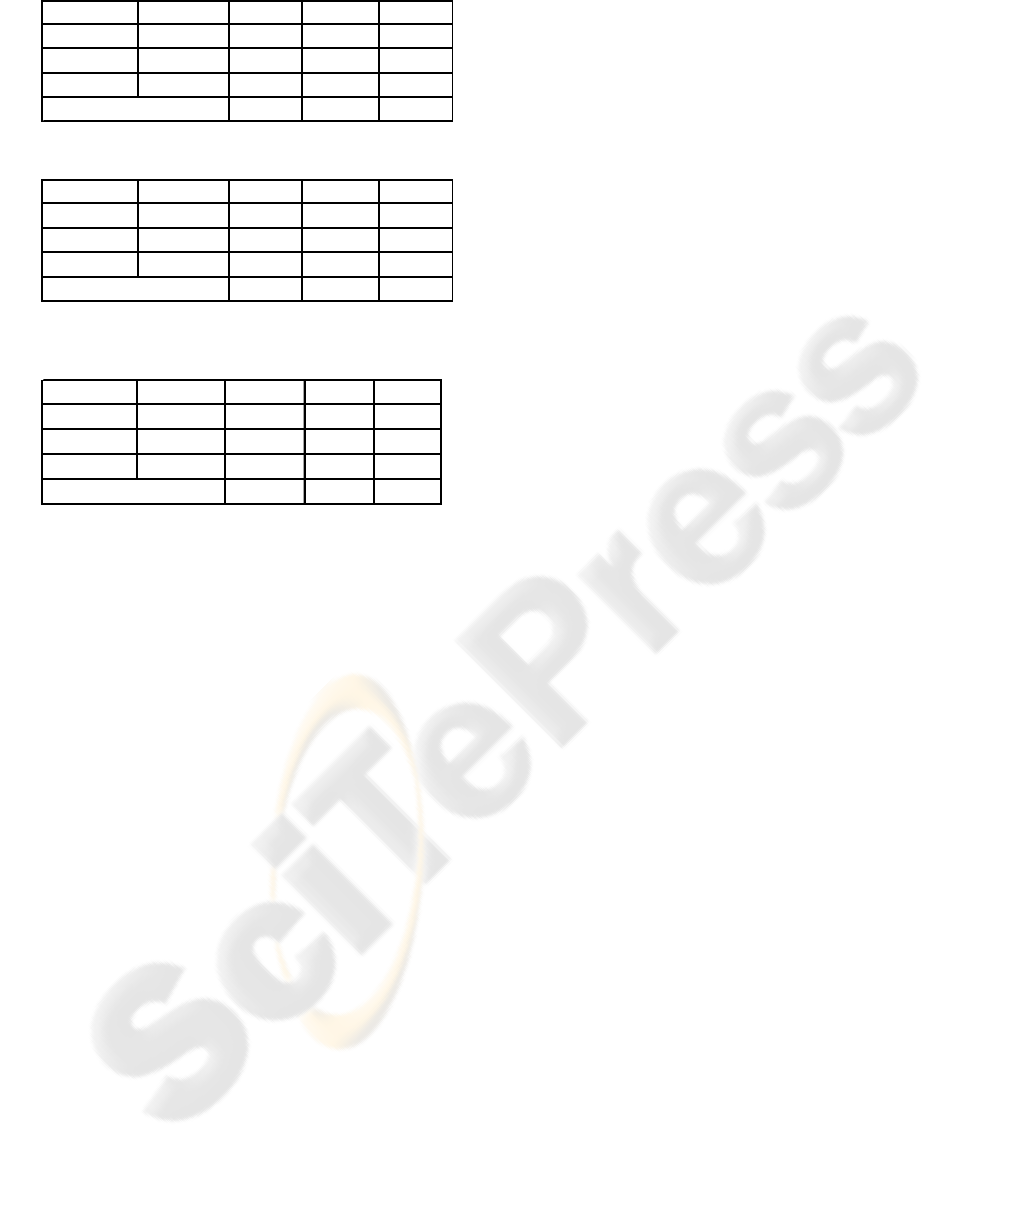
Table 2: Group dissatisfaction at a large firework.
Importance
Spatial Time
Other media
Usability
0.210 0.460 0.222 0.318
Preference
0.217 0.434 0.359 0.206
Reliability
0.574 0.496 0.296 0.208
Dissatisfaction
0
.47
5
0
.2
9
4
0
.2
30
Table 3: Group dissatisfaction at ticket reservation.
Importance
Spatial Time
Other media
Handiness
0.267 0.421 0.208 0.370
Preference
0.221 0.417 0.340 0.243
Reliability
0.511 0.424 0.298 0.279
Dissatisfaction
0
.422
0
.2
83
0
.2
95
Table 4: Group does not adopt when the user at time does
an important report usually.
Importance Telephone
E-mail Web
Handiness
0.255 0.146 0.251 0.603
Preference
0.261 0.247 0.240 0.512
Reliability
0.484 0.189 0.271 0.540
Dissatisfaction
0
.1
93
0
.2
58
0
.
5
4
9
As in Table 1, in congestion at a terrible
earthquake, the group feels dissatisfied at a rate of
0.390: 0.267: 0.342 (spatial movement: time shift:
other media movement). The priority level that the
entire group adopts is time shift > other media
recommendation > spatial movement. In congestion
at a large firework (Table 2), the group priority level
is other media recommendation > time shift > spatial
movement. In congestion at ticket reserving (Table
3), the group priority level that the entire group
adopts is time shift > other media recommendation >
spatial movement.
It is clear from result of the questionnaire that the
method of “It becomes easy to connect the
telephone in several-meter previous Tokyo Station
area. ” (spatial movement) is not allowed by users
and users’ dissatisfaction is much. We understood
that clear domination is not seen about time shift and
other media recommendation, and the approximation
might be shown, and some user allowance is
admitted. As in Tables 1, 2, 3, and 4, we can
understand a more detailed characteristic.
6 CONCLUSION
We have studied a mobile communication network
user opinion by using the AHP approach. To apply
the AHP approach, we have firstly assumed THREE
hierarchies; goal, dissatisfaction, and traffic control
schemes. We have subsequently assumed practical
situations where network traffic exceeds the system
capacity; a terrible earthquake, a large firework, and
a popular ticket reservation. Using these situations
we have presented the internet AHP questionnaire.
We have made Waseda University students as well
as Fukagawa High School students reply to the
questionnaire. We have analyzed the AHP
questionnaire results to finally evaluate users’
dissatisfaction regarding these traffic control
schemes. In other words, we have shown which
traffic control scheme performs worst in the mobile
communication network from users’ dissatisfaction
view point.
It is left for future research to make senior (old)
people to reply to our internet questionnaire
(because our questionnaire respondents were nothing
but university and high school students belonging to
a young generation). Our qualitative result may
change to a questionnaire respondent generation.
NTT DoCoMo,Inc. started ‘Push Talk’ service in
2005. It is also left for future research to investigate
that this ‘Push Talk’ can be an alternative media as a
traffic control scheme at the bottom level in our
AHP analysis.
REFERENCES
Akinaga, Y., Kaneda, S., Shinagawa, N., and Miura, A.,
2005. A proposal of mobile communication traffic
forecasting method using call characteristics and
environmental information. IEICE Technical Report,
vol. 105, no. 12, NS2005-6, pp. 21-24.
Ferguson, P., and Huston, G., 1998. Quality of Service.
John Willy & Sons, New York.
Hoshi, K. Kano, S. Takahashi, Y. Kaneda, S., Shinagawa,
N., 2006. Analytic hierarchy process and its
application to grade of traffic service in cellular
network. (To be presented at ICETE)
Kaneda, S., Akinaga, Y., Shinagawa, N., and Miura A.,
2005. Traffic control by influencing users’
behaviour in mobile networks. Proc of the 19
th
International Teletraffic Congress, 6A, pp. 583-592.
Saaty, T.L., 1980. The Analytic Hierarchy Process.
McGraw-Hill, New York.
Takahashi, A., Takahashi, Y., Kaneda, S., Akinaga, Y.,
and Shinagawa, N., 2005. The robustness of
blocking probability in a loss system with repeated
customers. Proc. of the 2
nd
ICETE 2005, vol. II, pp.
60-65.
Oodan, A.P., Ward, K.E., and Mullee, A.W., 1997.
Quality of Service in Telecommunications. IEE.
London.
Ramarswami, V., and Wirth, P.E. Ed, 1997. Teletraffic
Contributions for the Information Age. Elsevier.
Amsterdam.
WINSYS 2006 - INTERNATIONAL CONFERENCE ON WIRELESS INFORMATION NETWORKS AND SYSTEMS
146
