
SENSOR SYSTEM USING INTERNET COMMUNICATION
Measuring via Internet
Miroslav Husak
Department of Microelectronics, Czech Technical University in Prague,
Technicka 2, CZ-166 27 Prague 6, Czech Republic
Keywords: Sensor, Measurement, Internet, Data communications.
Abstract: The paper describes a sensor system for measurement and transfer of data via internet. Sensor data are
measured at different locations. The concept of read up sensor data, data transfer and data display is
presented in the paper. The realized system for measurement of air temperature, pressure and humidity is
described. Hardware and software of the measuring device have been realized. Eight physical quantities can
be measured by basic sensor system. The system consists of 16 configurations input/output for sensor
connection. Additionally, sensors can be used by the support of software widespread. RS-232 interface has
been used for its simplicity. Ethernet interface can be used by the converter. The control software of the
whole system has been designed. There are many program functions implemented. The design has been
were verified by the realized system sample. All implemented functions can be displayed on WEB pages.
Common software equipment can be used to view the web pages (PDA or mobile phone).
1 INTRODUCTION
The paper describes design and implementation of a
system solving transfer of measured sensor data via
the Internet. A web page has been created on an
Internet server where information is stored,
processed, and displayed. The system is divided into
four basic function blocs and each bloc can be used
at a different location.
Measuring equipment. Measuring equipment
acquires the data from the sensors, e.g. temperature,
pressure or humidity. The device consists from the
hardware and software for handling the sensors and
sending the measured data to the computer. The
measuring equipment is able to be active without
external power supply for certain time period.
Measured data are stored into the internal memory
and later sent to the computer.
Program for reading. The program is determined
for reading the data and saving them into the
computer. If the measuring equipment is connected
to the computer the program is able to read the saved
data from the internal memory of the device. The
program sets up the measuring equipment for correct
addressing the data from the sensors, i.e. where to
store the data from which sensor. The configuration
of the measuring equipment determines the number
of the active sensors, the position of the inputs and
other properties. The measuring equipment is
connected to the computer through corresponding
interface, e.g. serial port. It is essential to ensure
sufficient memory of the computer for saving the
measured data. Successive distribution of the
measured data is realized using the Internet
connection.
Software for data transfer. This software
cooperates with the presentation layer and it is
running on the same computer or server as the
program for reading. The software is reading the
data which have been stored by the program for
reading; it is modifying them and consequently
storing them into the database. If the data are not
stored on the same computer as the software for data
transfer is running on, the data must be in the same
format. The software can run on the Linux as well as
on the MS Windows platforms.
Presentation layer. This part is used for
generating dynamic web pages. The web pages
combine the text information and the graphical
curves which are representing the measured data or
some previously recorded data. The presentation
layer consists of the set of the PHP scripts. The
scripts are changing the server configuration,
specifying the way of the data presentation, loading
304
Husak M. (2006).
SENSOR SYSTEM USING INTERNET COMMUNICATION - Measuring via Internet.
In Proceedings of the International Conference on Wireless Information Networks and Systems, pages 304-309
Copyright
c
SciTePress
the data from the database, changing the data,
computing the statistics from the measured data,
creating the graphical characteristics, etc.
Measuring
device
Sensor
INTERNET
Sensor
Sensor
Read up
Data transfer
software
WEB page
presentation
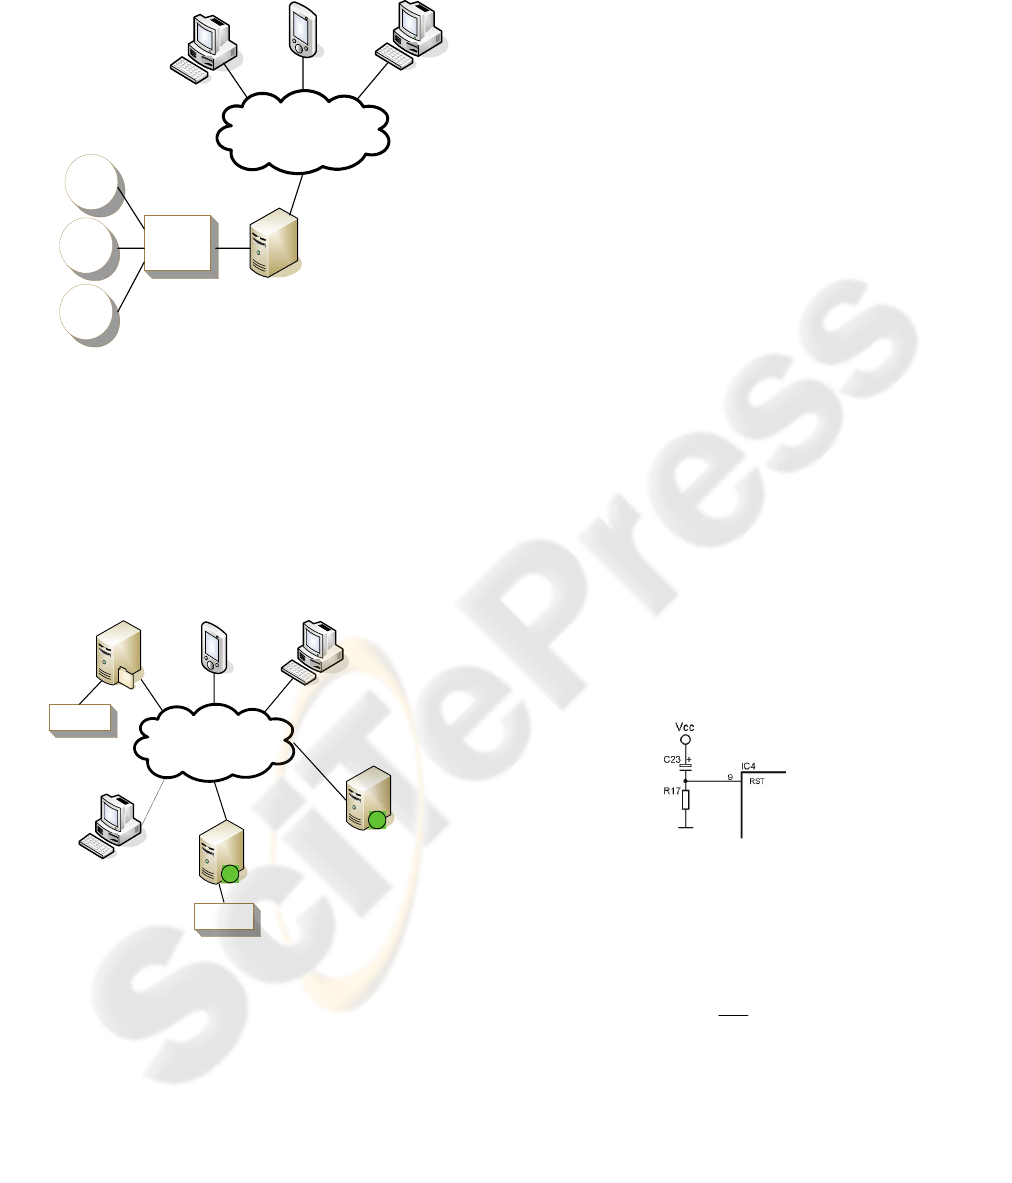
Figure 1: The simplest configuration of the measuring
system.
Web pages are generated by the web server and
MySQL database server. These applications can be
run on the several kinds of the operating systems.
The simplest configuration of the system is shown in
Figure 1. All software is running on the one
computer, which is connected with the sensors.
Measuring
device
INTERNET
Measuring place B
π Read up
π Data transfer software
π WEB page presentation B
Measuring
device
Measuring place A
π Read up
WEB pages presentation A+B
π Data transfer software
π WEB page presentation A
π WEB page presentation B
Figure 2: System measuring at different locations.
The system configuration for measuring the data
at different locations is illustrated in Figure 2. The
system has one presentation layer, which is common
for all other parts. Each measuring point can differ
in the hardware and software equipment. This
difference is caused by different demands laid on the
measuring function of each part of the system.
2 DESIGN OF MEASUREMENT
INSTRUMENTATION
HARDWARE
A measurement equipment enabling connection of
sensors has been designed. The sensors are aimed at
measuring various physical quantities. Both
analogue and advanced digital-output sensors can be
used. The sensors are designed as single-chip
combinations with signal-processing circuits. The
sensors can be connected directly to a
microprocessor. The microprocessor takes care of
the communication with multiple peripheral
instruments. The analogue-output sensors are
connected to the microprocessor via an A/D
converter. The connection to the PC is through a RS-
232 interface. A logic level converter matches the
microprocessor signal to the RS-232 voltage levels.
A character display has been selected for displaying
the data to the operator.
2.1 Microprocessor and its
Supporting Circuits
An ATMEL 89S9252 type has been selected as the
control processor. The clock frequency generator
circuit has been selected with an 11.0592 MHz
crystal. The crystal frequency selected is suitable for
accurate setting of serial communication speed. In
order to prevent undefined states from appearing on
switch-on conditions, the processor start is delayed.
The delay can be set by connecting a RC network to
the reset input of the processor – see Figure 3.
Figure 3: Reset circuit of the processor.
After the 5 V V
CC
supply voltage is applied, a
logical zero appears at the RST input (defined as V
L
= 0 ... 3.5 V). The run-up time to the logical zero can
be calculated as
L
CC
V
V
RCt ln⋅=
(1)
where V
CC
= 5 V and V
L
= 3.5 V. The processor
supports a connection of external memory to the
input/output ports P0 and P1. When no memory is
connected, these ports must be voltage-treated
properly.
SENSOR SYSTEM USING INTERNET COMMUNICATION - Measuring via Internet
305
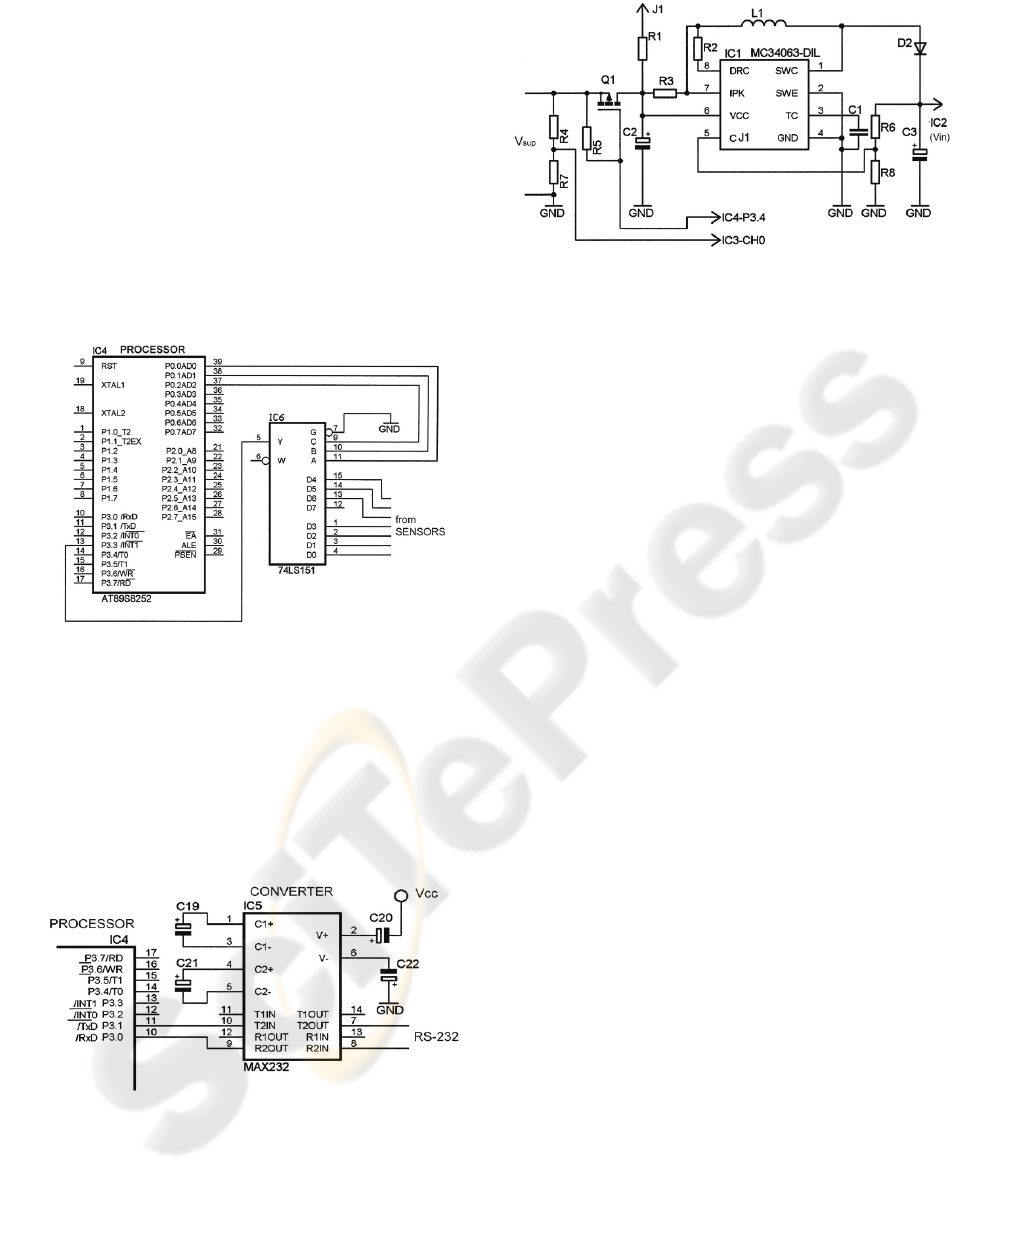
2.2 Connection of Sensors
Digital-output sensors are connected via an AD
converter – see Figure 4. The sensors are connected
to inputs marked as D0 to D6. Analogue output
sensors can be connected through an AD converter.
For the required applications, an 11-bit converter is
sufficient. A MCP3208 type has been selected. It is a
12-bit successive-approximation AD converter. The
converter has 8 inputs (programmable as 4 pseudo-
differential inputs or as 8 independent inputs). The
converter communicates through a four-wire serial
bus, compatible with the SPI protocol. Conversion
speed is up to 10
5
samples per second.
Figure 4: Connection of digital sensors to the processor
through a multiplexer.
2.3 Output Circuits and Power
Supply
The RS-232 interface is used for PC connection,
because RS-232 implementation is very simple
(having preference over USB). The interface is
connected to UART of the
Figure 5: Circuit connection of serial bus.
processor. The converter MAX232 is used for
change of logical levels – Figure 5. The switch
power supply is used in circuit powered – Figure 6.
The MC34063A is used (ON Semiconductor).
Figure 6: The circuit connection of power supply.
2.4 Used Sensors
The SMT160-30 sensor can be used for the
measurement of temperature (
SMARTEC). The
sensor is 3-pin integrated Si sensor. The output
signal has the form of mark-space ratio. The signal
can be connected to a multiplexer. The mark-space
ratio must be measured and converted using a
counter.
The SHT11T integrated sensor can be used for
the measurement of humidity or temperature
(
Sensirion). The output signal is in digital form. The
sensor is connected to a 2-wire digital bus (signal
clock SCK and a data bidirectional signal DATA).
The output signal as function of humidity is
nonlinear. The temperature compensation must be
applied.
The MPX4115A sensor is used for pressure
measurement (Freescale). A circuit is integrated one-
chip Si sensor of absolute pressure. The sensor has
signal processing on chip together with pressure
measurement and temperature compensation. The
output signal has analogue form in the range of 0.2
V to 4.8 V (range of pressure is from 15 kPa to 115
kPa). The sensitivity in the pressure range is
46mV/kPa. The pressure resolution is 0.045 kPa.
3 SOFTWARE OF
MEASUREMENT
INSTRUMENTATION
HARDWARE
The control program is divided to different
functions. Individual functions control behaviour of
the corresponding instrumentation parts. The
program for communication with AD converter is
simple implementation of the SPI protocol. Another
function performs data read-up and saving from/to
WINSYS 2006 - INTERNATIONAL CONFERENCE ON WIRELESS INFORMATION NETWORKS AND SYSTEMS
306
the EEPROM inner memory of the processor.
Another function controls character LCD display. 8-
wire bus is used for data transfer. Further function
performs data transfer using serial bus and
communication with the SHT11 sensor.
3.1 Program Operation
After initialization the program runs in the infinity
loop. The PC instructions are loaded form the
computer in the loop. Individual functions might be
called from these instructions. All functions are
periodically running in the PC interruption.
a) Device
initialization. The program starts from the
processor memory after power supply switch on.
The output ports of the processor are set up to the
initial state. The timer parameters are set up for
interruption generation. The counter is set up to the
speed of 9600 baude per second. The Watchdog
circuit is triggered. The configuration information is
read from the EEPROM memory of the processor.
The configuration information contains:
• Number of connected sensors (1-8)
• Interval of data record to inner memory - when
data are not processed in the PC
• EEPROM dimension of processor
• Frequency of measurement (frequency is
determined by frequency of interruption calls)
• Configuration bytes of individual sensors
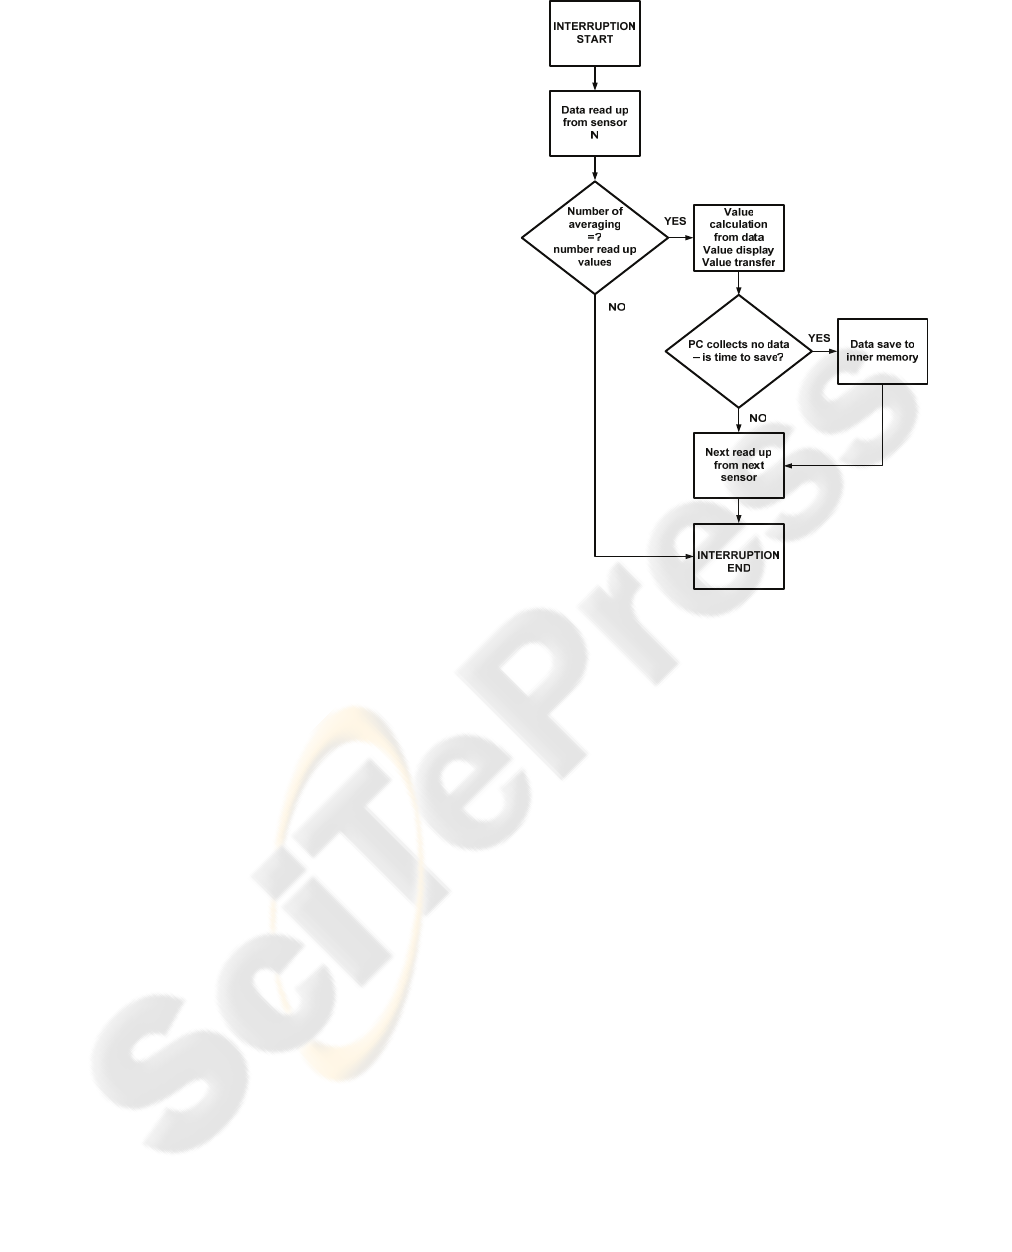
b) Interruption timer service. The interruption
service provides: reading the data, data processing,
data displayed and data transmission to the PC –
Figure 7.
The program uses three counters in that
interruption. The counters are saved in the global
variables. The global variables are saved during
individual calls of the interruptions. The counters
are:
• Counter with number of currently active sensor
• Counter for providing averaging number
• Counter for providing number of measured
characteristics to be saved in the memory
The program decides by the two latter counters to
ramify – Figure 7. Basic functions are displayed in
the flow diagram.
Reading data from sensors. The sensor counter
decides which sensor to use. The program reads data
from that sensor.
Value calculation. Value calculation is performed
after averaging cycle. Value output is periodical
after each calculation.
Value display. Values are displayed and sent to
the PC. The information contains sensor number,
sensor type, measured value and quantity.
Figure 7: Interruption service.
c) Instruction reception. The program reads the
instructions from the PC in the program loop. The
functions are called by these instructions. The
functions execute these instructions. The instructions
are represented only by a single character (for
simplicity).
d) Function callable from computer. The
configuration function is defined for the device
configuration. The function is very simple, it
overwrites fifty configuration bytes by new data.
Automatic processor restart is performed after
reading the new configuration.
4 DATA READING AND
TRANSFER SOFTWARE
The software performs data reading from the
measuring device. Then it performs data transfer via
internet to the web server– Figure 8. The software is
divided into two parts. The first part executes data
reading from the measuring device. That software
part is running always on the PC connected with the
measuring device. The second software part formats
data for the web pages. The software supporting the
SENSOR SYSTEM USING INTERNET COMMUNICATION - Measuring via Internet
307
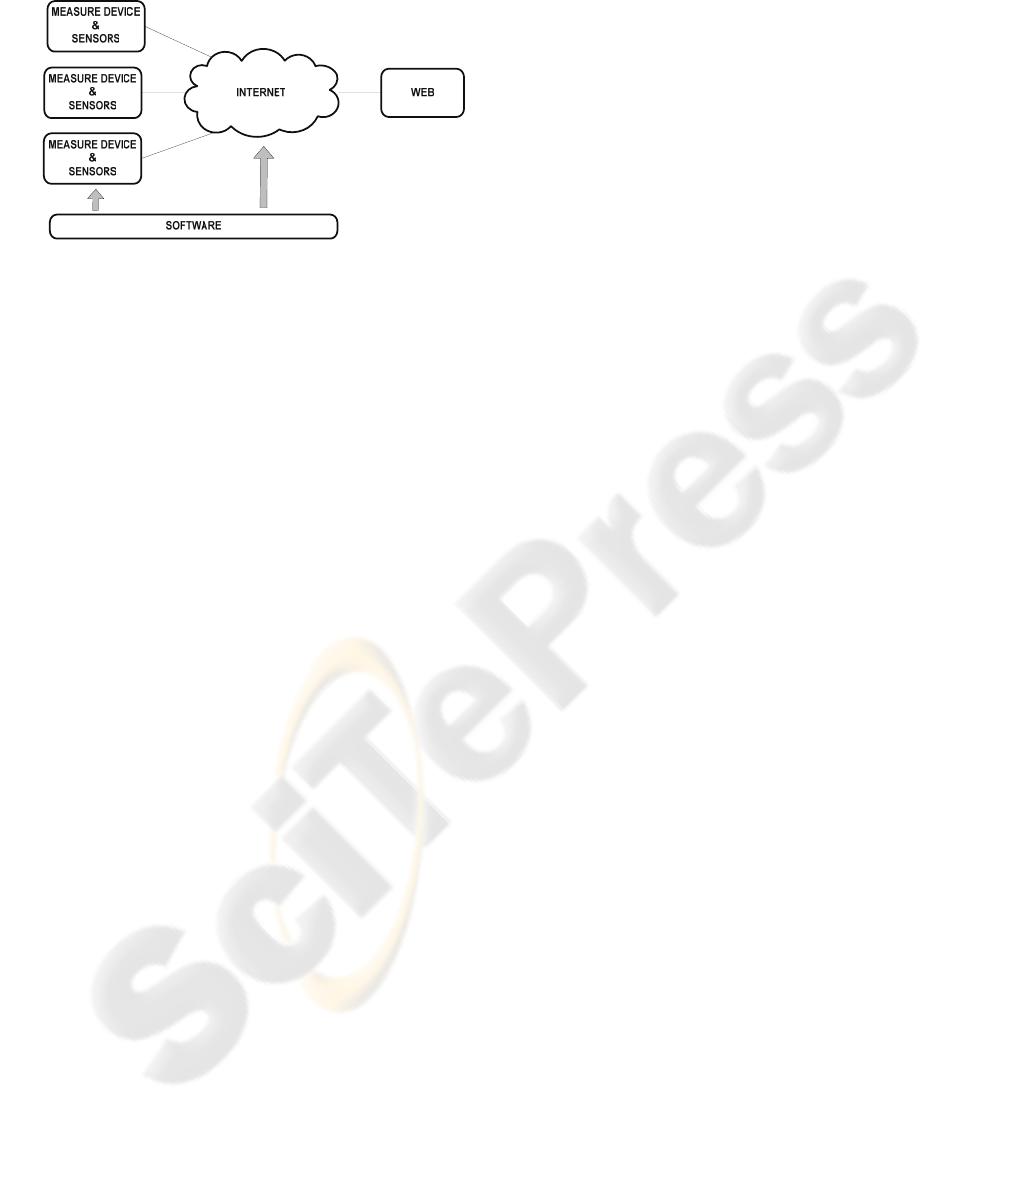
web pages is written in the PHP language (PHP:
Hypertext Preprocessor)..
Figure 8: Read up and transfer via internet software
4.1 Software Support of Measuring
Device Control
a) Configuration File.
The configuration file sets up the PC. It defines
location for saving read values; it contains setup
information for connecting the device. Setup
information contains:
• Setup of serial port number connection
• Measuring frequency of the device
• Interval of data record in device
• Memory size of the device processor
• Setup of individual sensors
Individual sensors have in the setup items:
• Sensor data directory for saving
• Sensor type
• Specific sensor setup (input position)
• Corrective constants
b) Program operation.
Initialization. After start the script performs several
operations (setup of infinite time limit for script
running, setup of start up limit of one script
installation, PHP process identifier is saved to the
file). The next step is reading the configuration file.
Data reading. The script starts reading data from the
measuring device using serial bus.
Data processing and saving. Sensor data are sent
to the PC. Data are processed in the PC (more
precise calculation). The output values are corrected
by setup constants. Final values are checked (a
presence in the defined interval).
Virtual sensor. Special properties can be set up in
the program. It is possible to have a sensor that is
not in the measuring device in reality. The sensor
value is calculated as a mathematic operation.
4.2 Software Support of Data
Transfer via Internet
This part of software performs data saving to a
database. The data are acquired from the measuring
device. The transfer and saving of data is realized
using a PHP script. Since the script uses database
access, it is necessary to install support for the
MySQL database. Another extension is represented
by CURL that provides comfortable access to data
via internet.
Setup. The setup contains „data series“. Data of
individual sensors build up the data series.
Individual series are defined by the configuration
files.
Data copy. The source path, the target path, and
the filename are necessary information for creation
of a data copy. The data are saved in several files.
The interval of copying is set up to three minutes.
Database format. SQL database (Structured
Query Language) is suitable for data saving and
their use on the web pages. Using SQL queries
allows very simple reading of data according to the
requested parameters.
The database structure is very simple. Data series
corresponds to the measured sensor value with
assigned time value (the first column contains time,
the second column contains measured value). The
measured data are changing very slowly. The data
are saved to the database only in the case of change
(the result is acceleration of data operation). That
limits the calculation of various statistic
characteristics (data absence in time). Therefore
additional column is inserted to the structure. The
duration of a certain value is saved in this column.
The format „Unix Timestamp“ is used for saving
time information. Time values are represented by
32-bit number. PHP script converts that format.
Other two matrices have been designed (they save
time and space for data processing). The matrices
contain partially preprocessed data, namely average
values, minima, and maxima. The matrices serve for
using data from a longer time interval.
Data saving. Data are read from data series in the
files. Data are transformed to correct format and
saved to the database. Data are not saved as a single
series. One single SQL query is created. All new
data are saved in batch mode. Operation speed is
higher in that case.
WINSYS 2006 - INTERNATIONAL CONFERENCE ON WIRELESS INFORMATION NETWORKS AND SYSTEMS
308
5 WEB PAGES AND RESULTS
The basic requirements have been defined for the
design of the web pages: Simple layout and well-
arranged design, text display of current measure
values, current measured characteristics within day,
measured characteristics and text outputs for
arbitrary data interval.
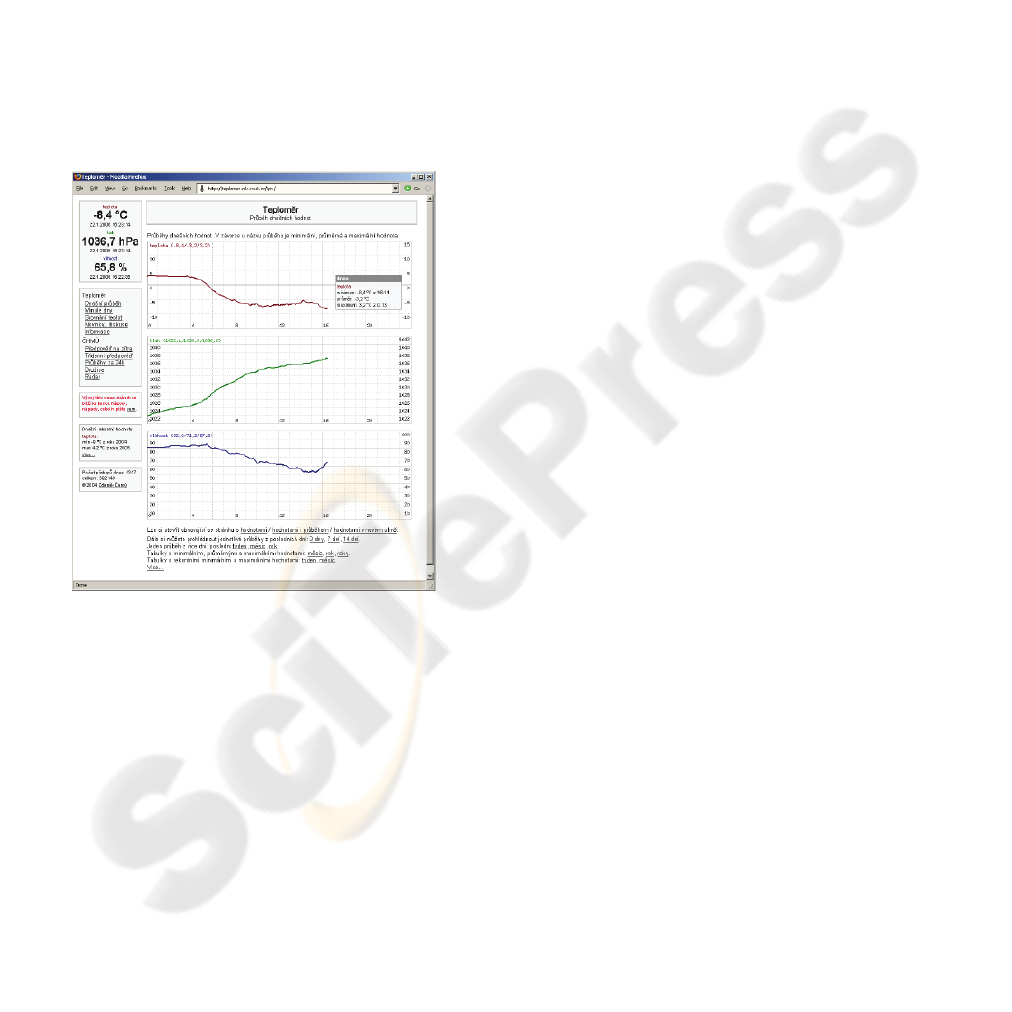
The page layout is shown in Figure 9. Very large
number of operation is necessary for display of one
web page. Individual files control different attributes
of the web page, for example: web page layout, data
preparation from database, access interface to
database records, conversion of common call
database function to concrete instruction, reading
concrete database record, reading web page setup,
probing extreme values.
Figure 9: Web page layout.
The main file controls a skeleton of the page.
Current values are displayed in current day.
Additional information of extreme values is added
to the pictures.
Page “history” allows to visualize the information
in different way, for example: One picture with
characteristics in the concrete time interval, table
with minimum, average, maximum values for
concrete days, months, years, table with minimum,
average, maximum value through current day.
Another file performs generation of all pictures.
Pictures can be saved to the database. Different
parameters of pictures can be set up: File name,
Displayed time interval, Picture dimensions, Picture
captions, Axis ranges.
6 CONCLUSIONS
Hardware and software of measuring device have
been realized. The basic system measures eight
physical quantities. In the paper, the system for
measurement of air temperature, pressure and
humidity is described. Measured data are transfered
via internet.
Measuring device. The system consists of 16
configurable inputs/outputs for sensor connection.
Five sensor types have been designed for the system.
Eight measuring devices can be used in the system.
Additional sensors can be used – the extension is
software supported. The RS-232 interface has been
used due to simplicity of connection. Ethernet
interface can be used for the converter.
Software equipment. Control software of the whole
system has been designed. Many program functions
constitute the whole software. Individual functions
perform individual operations of the system. The
design has been verified by a realized system
sample. All functions can be displayed on the web
pages. Common software equipment can be used for
viewing the web pages (PDA or mobile phone).
ACKNOWLEDGEMENTS
This research has been supported by the Czech
Science Foundation project No. 102/06/1624 “Micro
and Nano Sensor Structures and Systems with
Embedded Intelligence” and partially by the
research program No. MSM6840770015 "Research
of Methods and Systems for Measurement of
Physical Quantities and Measured Data Processing "
of the CTU in Prague.
REFERENCES
ON Semiconductor. MC34063A, MC33063A,
NCV33063A: 1.5 A, Step-Up/Down/ Inverting
Switching Regulators December, 2005.
www.onsemi.com
SMARTEC. SMT16030 DIGITAL TEMPERATURE
SENSOR, 2005.www.smartec.nl.
Sensirion. SHT1x / SHT7x Humidity & Temperature
Sensor 2005. www.sensirion.com.
Freescale Semiconductor. MPX4115A, MPXA4115A,
2006. www.freescale.com.
PHP: Hypertext Preprocessor. www.php.net.
SENSOR SYSTEM USING INTERNET COMMUNICATION - Measuring via Internet
309
