
DEVELOPMENT OF SUMMARIES OF CERTAIN PATTERNS
IN MULTI-BAND SATELLITE IMAGES
Hema Nair
C.T.R.F., 813, 7
th
Main, 1
st
Cross, HAL 2
nd
Stage, Bangalore 560008, India
Keywords: Data mining, pattern recognition, fuzzy sets, genetic algorithm, linguistic summary, intelligent systems.
Abstract: This paper describes a system that is designed and implemented for interpretation of some patterns in multi-
band (RGB) satellite images. Patterns such as land, island, water body, river, fire, urban area settlements in
remote-sensed images are extracted and summarised in linguistic terms using fuzzy sets. Some elements of
supervised classification are introduced to assist in the development of linguistic summaries. A few
LANDSAT images are analysed by the system and the resulting summaries of the image patterns are
explained.
1 INTRODUCTION
Data mining is a term applied to the set of
techniques and processes that analyse raw data to
discover implicit patterns which are useful for
decision-making. Pattern recognition can be
considered as a form of data mining because both
concentrate on the extraction of information or
relationships from data (Kennedy et al., 1997).
Knowledge discovery and data mining systems
employ methods and techniques from the field of
pattern recognition, as well as related topics in
database systems, machine learning, artificial
intelligence, statistics, and expert systems, where the
unifying goal is to extract knowledge from large
volumes of data (Friedman, Kandel, 1999). Several
pattern classification techniques have been proposed
in literature. These include neural nets, genetic
algorithms (GA), Bayesian methods, statistical
methods, decision tables, decision trees etc. A
multimedia database system (Thuraisingham, 2001)
is an example of a heterogeneous database system
because it manages heterogeneous data types such as
audio, images, video etc. Such data is typically
unstructured in format. Although many techniques
for representing, storing, indexing and retrieving
multimedia data have been proposed, the area of
multimedia mining has seen few results (Zaine et al.,
1998a), (Zaine et al., 1998b). This is mainly due to
the fact that multimedia data is not as structured as
relational data (Zaine et al., 1998b). There is also the
issue of diverse multimedia types such as images,
sound, video etc. A particular data mining technique
may be successful with one type of multimedia such
as images, but the same technique may not be well
suited to many other types of multimedia due to
varying structure and content. In (Zaine et al.,
1998a), (Zaine et al., 1998b), the objective is to mine
internet-based image and video. The results
generated could be a set of characteristic features
based on a topic (keyword), a set of association rules
which associate data items, a set of comparison
characteristics that contrast different sets of data, or
classification of data using keywords. From another
perspective, (Barnard et al., 2003a), (Barnard et al.,
2003b) describe the approach involved in matching
images to text. Their work describes models used for
automatic image annotation, browsing support and
auto-illustration of blocks of text. Such models are
focussed on prediction of words (from an available
pool) that match with specific image regions. This is
a form of labelling and requires assistance from
training data and manually annotated images.
A system that classifies and interprets patterns such
as land, island, water body, river, fire, urban area
settlements in satellite images is described in this
paper. It utilises fuzzy logic to describe these
patterns (Nair, 2003), (Nair, Chai, 2004), (Nair,
2004), (Nair, Chai, 2005). Some feature descriptors
such as area, length, shape ratio etc., of such patterns
are extracted and stored in a relational database.
Data mining techniques that employ clustering and
278
Nair H. (2006).
DEVELOPMENT OF SUMMARIES OF CERTAIN PATTERNS IN MULTI-BAND SATELLITE IMAGES.
In Proceedings of the Eighth International Conference on Enterprise Information Systems - AIDSS, pages 278-284
DOI: 10.5220/0002439202780284
Copyright
c
SciTePress

genetic algorithms are then used to develop the most
suitable linguistic summary of each pattern/object
stored in the database. This paper is organised as
follows. Section 2 describes the system architecture,
section 3 describes the approach, section 4 discusses
the implementation issues, and section 5 discusses
the conclusions and future work.
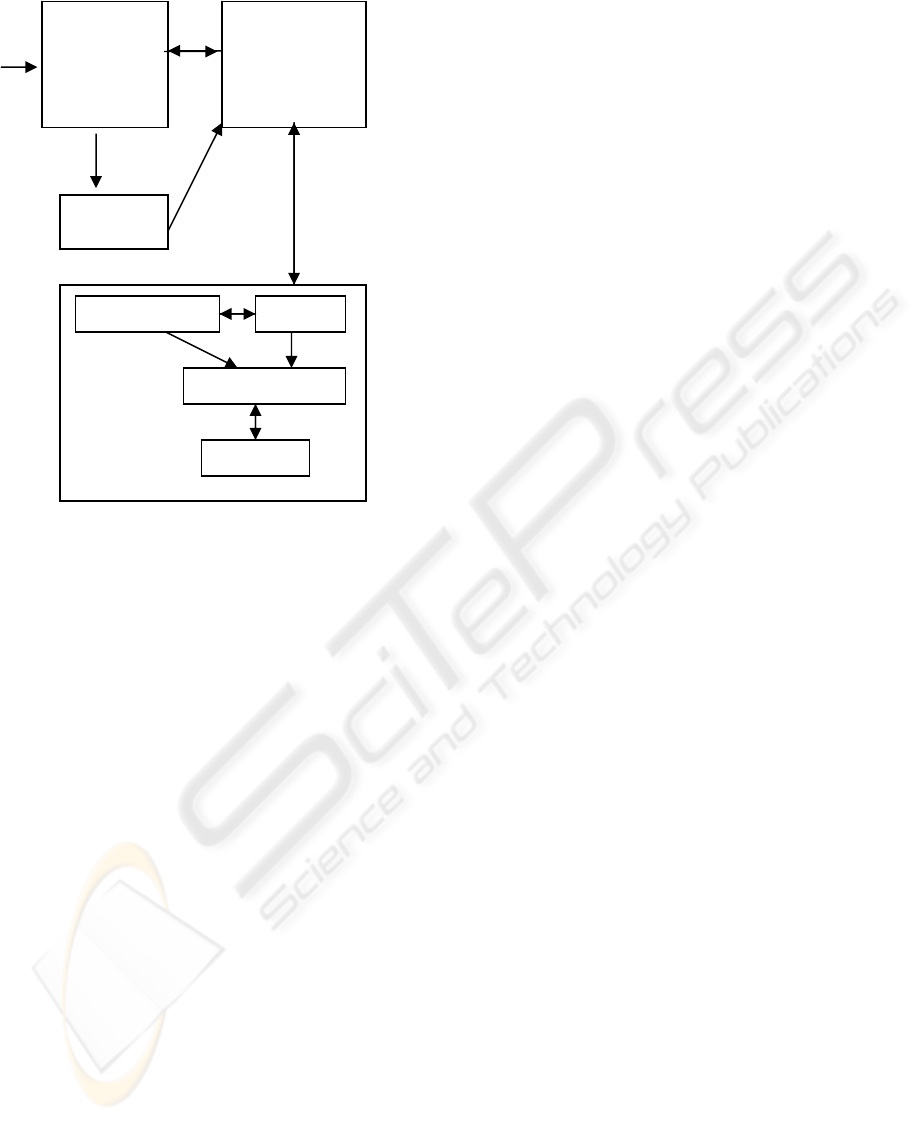
2 SYSTEM ARCHITECTURE
The system architecture is shown in Figure 1. The
input image is analysed and some feature descriptors
extracted. These descriptors are stored thereafter in a
relational table in the database. The blackboard
holds the current state in the process of developing
summaries. The key difference with (Nair, Chai,
2005) is that presently the user has the choice of
suggesting concepts such as descriptions of area,
length, location of patterns etc. Also, human
interaction could be of assistance when complicated
summaries that involve a combination of attributes
need to be developed (Kacprzyk, Yager, 2001). It
would be possible for the user to assign importance
to each of the attributes. The knowledge base uses
geographic facts to define feature descriptors using
fuzzy sets. It interacts with a built-in library of
linguistic labels, which also interacts with the
summariser as it supplies the necessary labels to it.
The summariser receives input from these
components and performs a comparison between
actual feature descriptors of the image patterns
stored in the database, the concepts suggested by the
user, and the feature definitions stored in the
knowledge base. After this comparison, the
summariser uses the linguistic labels supplied by the
library to formulate some possible summaries for
each pattern/object in the database. These summaries
are stored in the blackboard. From among these
summaries, the most suitable one describing each
pattern is selected by interaction with the engine
(genetic algorithm). As the GA evolves through
several generations, it generates better summaries
(indicated by higher fitness, as defined in Section 4)
which are then stored and indicated on the
blackboard. Thus, the system has been improved and
enhanced to include some elements of supervised
classification and summarisation.
This research focuses on analysing multi-band
(RGB) satellite images. The following set of rules is
developed to perform pattern classification in multi-
band satellite images.
1. If a pattern/object is to be classified as an
island, it should have a water envelope
surrounding it such that it has a uniform
band ratio at at least eight points on this
envelope (corresponding to directions E,
W, N, S, NE, NW, SE, SW). Also grey
level values on the envelope could be lower
than the grey level values on the object.
2. If an object does not have an envelope in all
directions as described in rule (1) above,
then it is classified as land.
3. If an object is to be classified as water body
(expanse of water, river), it is necessary
that it should have a uniform band ratio.
4. Fire is classified as a separate pattern. It is
identified by applying colour density
slicing to the image and by viewing the
histogram of the affected area. The
histogram would show a majority of pixels
at lower intensity for the burnt scar area
near the fire.
5. A new rule is proposed for the
classification and identification of urban
area settlements in an image. At this stage,
only simple, geometrically regular
settlements can be identified. The grey
level intensity (indicated as white colour
for settlements) and shape are used as
attributes to aid the identification and
classification process. Settlements are
identified by sharp edges and corners.
Shape ratio can be used to verify the
preciseness of the shape. This classification
will have a percentage of accuracy
associated with it.
3 APPROACH
Area, length, location (X, Y pixel co-ordinates of
centroid of pattern in image), Additional Information
or Pattern Id, grey level intensity, and shape ratio are
the attributes of the patterns/objects that are used to
develop their linguistic summaries. Area, length,
location, grey level intensity, shape ratio are
calculated/extracted automatically by the GUI tool.
Additional information contains the pattern’s id,
which is obtained by using the classification rules
described in the earlier section. The linguistic
summary of patterns/objects is evaluated as follows.
DEVELOPMENT OF SUMMARIES OF CERTAIN PATTERNS IN MULTI-BAND SATELLITE IMAGES
279
Image
Figure 1: System architecture.
If
p21
y,...y,yY = (1)
then
truth(y
i
isF)=μ
F
(y
i
):i=1,2,...,p, (2)
where μ
F
(y
i
) is the degree of membership of y
i
in
the fuzzy set F and 0 ≤ μ
F
(y
i
) ≤ 1. The linguistic
proposition y
i
is F could be instantiated as for
example, River is long. Thus referring to equations
(1) and (2), y
i
could be island or area of land or
expanse of water or river. For each object y
i
, the
degree of membership of its feature descriptor such
as area or length in corresponding fuzzy sets is
calculated. An example of a typical linguistic
summary for land generated by the system in this
paper would be:
A moderately large area of land at the centre of the
image.
In order to generate such summaries, it is necessary
to formulate fuzzy sets that quantify area/length
attributes of the object/pattern. Some of the
trapezoidal fuzzy sets formulated for area are large,
fairly large, moderately large, and small and fuzzy
sets for length are long, relatively long, fairly long
and short. Triangular fuzzy sets have also been
formulated for area and length. The linguistic
description is calculated as follows:
njj2j1j
m...mmT ∧∧=
, (3)
where m
ij
is the matching degree (Kacprzyk,
Ziolkowski, 1986) of the ith attribute in the jth tuple.
m
ij
∈[0,1] is a measure of degree of membership of
the ith attribute value in a fuzzy set denoted by a
fuzzy label. The logical AND (∧) of matching
degrees is calculated as the minimum of the
matching degrees (Kacprzyk, Ziolkowski, 1986).
0
1
≠∀=
∑
=
ij
k
j
j
mTT
(4)
T in equation (4) is a numeric value that represents
the truth of a possible set of summaries of the k
objects in the database. The next section discusses
how the GA evolves the most suitable linguistic
summary for all the objects by maximising T.
4 IMPLEMENTATION ISSUES
This section explains the genetic algorithm approach
and then discusses the results from applying this
approach to analyse images.
4.1 GA Approach
The genetic algorithm emulates biological
evolutionary theories as it attempts to solve
optimisation problems (Filho et al., 1994),
(Goodman, 1996), (Smith et al., 1994). Each binary
chromosome string in a population represents a
possible linguistic summary for a pattern. Such a
population of strings is manipulated by selection,
cross-over and mutation operators in the GA (Filho
et al., 1994) such that as the GA evolves through
several generations, only those strings with highest
fitness survive. The evaluation or fitness function for
the linguistic summaries or descriptions of all
objects in the table is
f=max(T), (5)
Database
Image
Analysis &
Feature
Extraction
GUI
Tool
Blackboard
Architecture
Knowledge base Library
Summariser
Engine
ICEIS 2006 - ARTIFICIAL INTELLIGENCE AND DECISION SUPPORT SYSTEMS
280

where T is evaluated as shown in the previous
section and f is the maximum fitness value of a
particular set of linguistic summaries that has
evolved over several generations of the GA.
4.2 Results and Discussion
In general, image objects/patterns are classified at
the highest level into land, water or fire. Land is
further classified into island and other land. Urban
area settlement is a pattern that can be identified on
land or island. Water is further classified into river
and other water body. The fuzzy sets that quantify
area or length are defined with reference to
geographic facts such as:
• Largest continent is Asia with area of
44579000 km
2
• Largest freshwater lake is Lake Superior
with area of 82103 km
2
• Smallest continent is Australia/Oceania
with area of 7687000 km
2
• Largest island is Greenland with area
2175000 km
2
A total of 29 fuzzy sets have been formulated in this
research. Formulation of these fuzzy sets is based on
the universal geographic facts given earlier. Only
some of the trapezoidal fuzzy sets and triangular
fuzzy sets formulated are shown here due to space
limitation. The trapezoidal fuzzy sets for large
expanse of water, fairly large expanse of water and
small expanse of water are formulated as shown in
equations (6), (7), and (8). In (9), the triangular
fuzzy set for considerably large expanse of water is
shown.
seofwaterlargeexpan
μ
(x)=1, for 82103≤ x
=x/2203 – 36.27, for 79900≤x≤ 82103
=0,x<79900 (6)
watereexpanseoffairlylarg
μ
(x)=1, for 100≤ x≤900
=1-(100-x)/91, for 9≤ x≤ 100
=1-(x-900)/100, for 900≤ x≤ 1000
=0, x< 9
=0,x>1000 (7)
waterof expanse small
μ
(x) = 1, 0≤x≤ 100
=-x/900 +1.11, for 100≤x≤1000
=0,otherwise (8)
waterof expanse largely considerab
μ
(x)=1-(55068.66-
x)/27034.33, for 28034.33≤ x≤55068.66
=1-(x-55068.66)/27034.33, for 55068.66≤ x≤ 82103
=0, x< 28034.33
=0, x> 82103 (9)
In (Nair, Chai, 2005), SPOT Multi-spectral images
were analysed and their resulting summaries
discussed. A few LANDSAT images are analysed
in this paper. An example LANDSAT satellite
image to be analysed is shown in Figure 2. Table 1
shows the data collected from the image to perform
k-means clustering (Mather, 1999) in order to cluster
the pixels in the image. The feature vector used
consists of X, Y, R, G, B values. Table 2 shows a
small sample data set of feature descriptors
calculated/collected from the patterns in the image
using the graphical tool. The R band grey level at
centroid location of pattern is shown in the table, as
this band shows all patterns clearly. Area of each
pattern is in sq km. Length is in km. Pattern id
attribute denotes numbers as follows: 0=River,
1=Water Body, 2=Island, 3=Land, 4=Fire, 5=Urban
area settlement. Location is indicated by X, Y pixel
co-ordinates of centroid of pattern/object. The
additional information or pattern id attribute of each
object in Table 2 is calculated automatically using
the classification rules in Section 2, which hold for
multi-band images. For land, island, and water body
(expanse of water), area is the most significant
parameter in calculations and therefore their length
is ignored. A river’s length is its most significant
parameter in calculations and therefore its area is
ignored. In order to extract more patterns such as
different types of vegetation, observational ground
data is required for training. Such data could not be
afforded in this research.
The GA is run with following input parameter set.
These parameter values are set after several trial
runs.
Number of bits in a chromosome string of the
population = 10
Generations per cycle = 15
Population size = 200 strings
Probability of cross-over = 0.53
Probability of mutation = 0.001
DEVELOPMENT OF SUMMARIES OF CERTAIN PATTERNS IN MULTI-BAND SATELLITE IMAGES
281
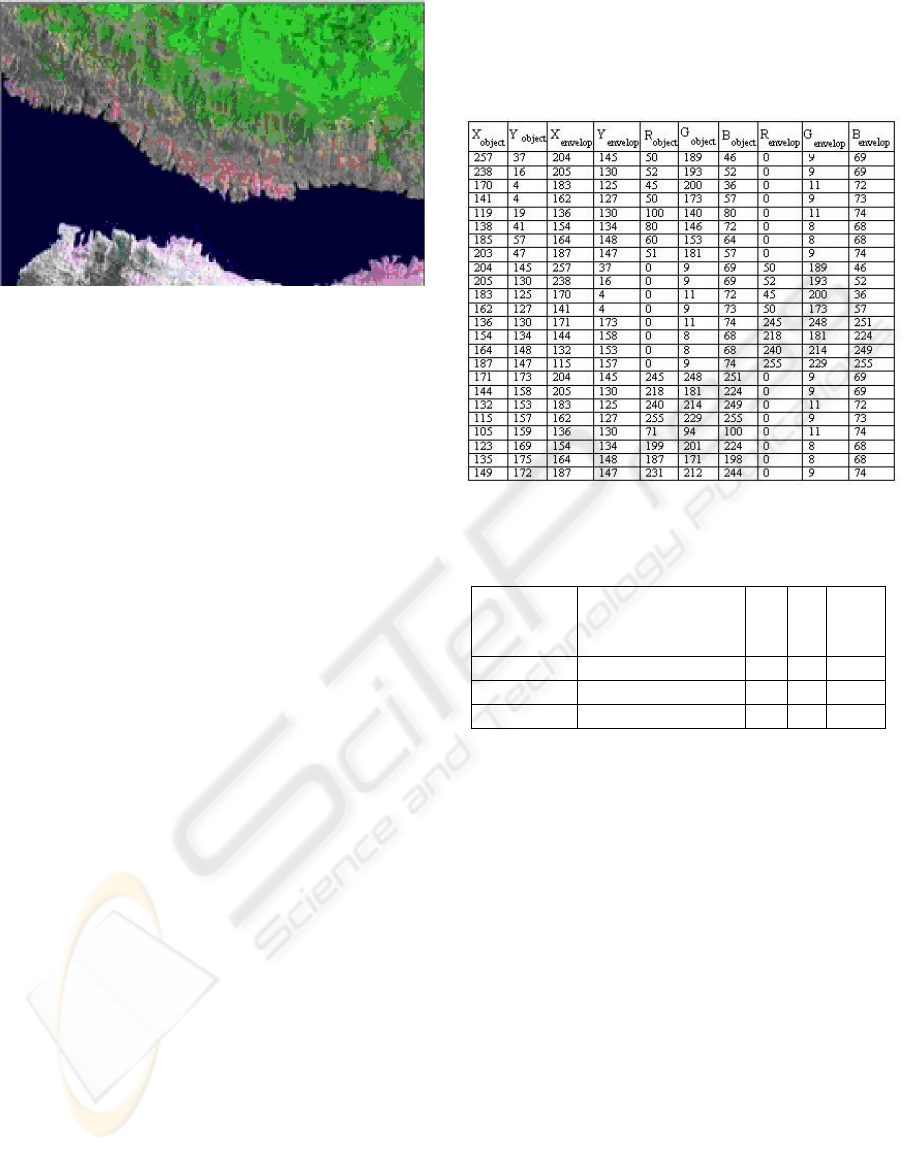
Figure 2: LANDSAT 7 ETM+ image of a section of
Kvarneric islands, Croatia. Approximate scale 1:0.952 sq
km
.
With triangular fuzzy sets in the knowledge base,
after 120 generations of the GA, the linguistic
summaries generated for the data in Table 2 are:
• A small area of land at the top
• A small area of land in the lower part
• A fairly large expanse of water in the lower
part
Figure 3 shows another sample LANDSAT image,
which is analysed by the system. The k-means
clustering table is Table 3 and the data
collected/calculated by the graphical tool is shown
in Table 4. The corresponding output linguistic
summaries from the system are also shown.
For the data in Table 4 corresponding to image in
Figure 3, the GA is run with following input
parameter set. These parameter values are set after
several trial runs.
Number of bits in a chromosome string of the
population = 9
Generations per cycle = 10
Population size = 200 strings
Probability of cross-over = 0.53
Probability of mutation = 0.001
Table 1: Data collected from image in Figure 2 for
clustering. The header of the table denotes data from left
to right as follows:
X
object,
Y
object,
X
envelope,
Y
envelope,
R
object,
G
object,
B
object,
R
envelope,
G
envelope,
B
envelope.
Table 2: Data calculated and collected from image in
Figure 2
.
With trapezoidal fuzzy sets in the knowledge base,
after 80 generations of the GA, the linguistic
summaries generated are:
• A fairly large island at the top left
• A fairly large island at the right
• A moderately large expanse of water in the
remainder of image
The summaries produced by this system have been
verified to be correct using topographic maps of the
areas in the images. In general, as the graphical tool
is a user-interactive tool, it is limited by the accuracy
of the user’s point and click action.
R-band
grey level
Approximate
Area
in sq km
X
Y
Pattern
id
45 28624.29 174 95 3
0 11528.145 158 135 1
188 8093.116 155 184 3
ICEIS 2006 - ARTIFICIAL INTELLIGENCE AND DECISION SUPPORT SYSTEMS
282
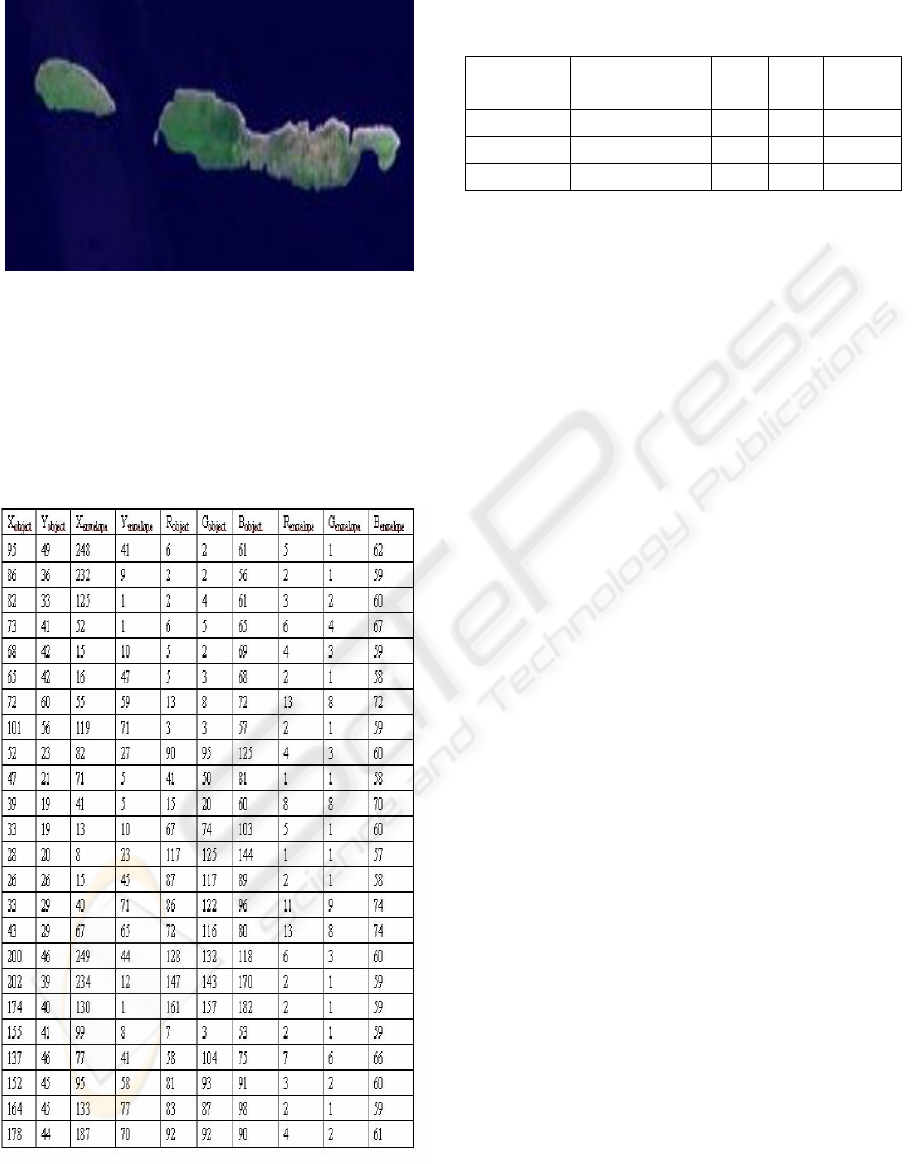
Figure 3: LANDSAT 7 ETM+ image of a part of
Kvarneric islands, Croatia. Approximate scale 1: 0.952 sq
km
.
Table 3: Data collected from image in Figure 3 for
clustering. The header of the table denotes data from left
to right as follows
: X
object,
Y
object,
X
envelope,
Y
envelope,
R
object,
G
object,
B
object,
R
envelope,
G
envelope,
B
envelope.
Table 4: Data calculated and collected from image in
Figure 3
.
R-band
grey level
Approximate
Area in sq km
X Y Pattern
Id
86 447.71 41 27 2
113 2225.22 158 48 2
10 11073.696 128 40 1
5 CONCLUSIONS AND FUTURE
WORK
This paper has presented a system for interpretation
of multi-band remote-sensed images by extracting
and classifying some patterns such as land, island,
water body, river, fire and describing these patterns
using linguistic summaries. A new rule has been
proposed for the identification of urban area
settlements. A genetic algorithm technique has been
employed to evolve the most suitable linguistic
summary that describes each object/pattern in the
database. This method can be extended to an array
of images of the same geographic area, taken over a
period of several years, to describe many interesting
and unusual patterns that emerge over time. In this
paper, only two images have been analysed by the
system. More images with patterns such as urban
area settlements will be available for analysis and
summarisation in future. Some directions for future
work include:
1. Adding the provision to upload ground data
in order to help classify more patterns such
as vegetation using supervised
classification techniques.
2. Adding enhancements to image analysis
functions.
3. As a future application, it would be
possible to construct an index for an image
database using the linguistic summaries
developed here.
4. Adding more fuzzy sets and corresponding
labels in knowledge base and library
respectively to have a system that is richer
and can generate a wider variety of
linguistic summaries.
5. Expanding the system to test application
domains other than remote-sensing.
DEVELOPMENT OF SUMMARIES OF CERTAIN PATTERNS IN MULTI-BAND SATELLITE IMAGES
283

REFERENCES
Barnard, K., Duygulu, P., Forsyth, D., De Freitas, N., Blei,
D.M., Jordan, M.I., 2003a. Matching words and
pictures. Journal of Machine Learning Research, Vol
3, pp. 1107-1135.
Barnard, K., Duygulu, P., Forsyth, D., 2003b. Recognition
as translating images into text. Internet Imaging IX,
Electronic Imaging.
Filho, J.L.R., Treleaven, P.C., and Alipi, C., 1994. Genetic
Algorithm programming environments. In IEEE
Computer, pp. 28-43
Friedman, M., Kandel, A., 1999. Introduction to pattern
recognition – Statistical, structural, neural and fuzzy
logic approaches, World Scientific.
Goodman E.D., 1996. An Introduction to Galopps-the
Genetic ALgorithm Optimized for Portability and
Parallelism System(Release 3.2). Technical Report
No. 96-07-01, Genetic Algorithms Research and
Applications Group, Michigan State University.
Kacprzyk, J., Ziolkowski, A., 1986. Database queries with
fuzzy linguistic quantifers. In IEEE Transactions on
Systems, Man and Cybernetics, pp. 474-479.
Kacprzyk, J., Yager, R.R., 2001. Linguistic summaries of
data using fuzzy logic. In International Journal of
General Systems, 30(2), pp. 133-154.
Kennedy, R.L., Roy, B.V., Reed, C.D., Lippman, R.P.,
1997. Solving Data Mining problems through Pattern
Recognition, Prentice Hall.
Mather, P. M., 1999. Computer Processing of Remotely-
Sensed Images, Wiley.
Nair, H., 2003. Developing linguistic summaries of
patterns from mined images. In Proceedings of
International Conference on Advances in Pattern
Recognition, pp. 261-267.
Nair, H., Chai, I., 2004. Linguistic description of patterns
from mined images. In Proceedings of 6
th
International Conference on Enterprise Information
Systems, Vol 2, pp. 77-83.
Nair, H., 2004. Linguistic summaries of image patterns.
Ruan D., D’hondt P., De Cock M., Nachtegael M.,
Kerre E.E., eds, Applied Computational Intelligence,
pp. 246-249, World Scientific.
Nair, H., Chai, I., 2005. A system to interpret and
summarise some patterns in images. In Proceedings of
7
th
International Conference on Enterprise
Information Systems, Vol 2, pp. 283-290.
Shapiro, G.P., Fayyad, U., Smith, P., 1996. From data
mining to knowledge discovery: An overview. Fayyad
U. M., Shapiro G.P, Smith P, Uthurusamy R, eds,
Advances in Knowledge Discovery and Data Mining,
pp. 1-35, AAAI/MIT Press.
Smith, R.E., Goldberg, D.E., Earickson, J.A., 1994. SGA-
C:A C-language implementation of a Simple Genetic
Algorithm. TCGA Report No.91002.
Thuraisingham, B., 2001. Managing and Mining
Multimedia Databases, CRC Press.
Zaine, O.R, Han, J., Ze-Nian, L., Hou, J., 1998a. Mining
Multimedia Data. CASCON’98 : Meeting of Minds,
pp. 83-96
Zaine, O.R., Han, J., Ze-Nian, L., Chee, S.H., Chiang,
J.Y., 1998b. MultimediaMiner : A System Prototype
for Multimedia Data Mining. In Proceedings of ACM-
SIGMOD International Conference on Management of
Data (SIGMOD ’98).
ICEIS 2006 - ARTIFICIAL INTELLIGENCE AND DECISION SUPPORT SYSTEMS
284
