
DECISION SUPPORT ON THE MOVE
Mobile Decision Making for Triage Management
Julie Cowie, Paul Godley
Department of Computing, University of Stirling, Stirling, UK, FK9 4LA
Keywords: Mobile Decision Support, Multicriteria Decision Analysis.
Abstract: This paper describes research investigating ways in which a mobile decision support system might be
implemented. Our view is that the mobile decision maker will be better supported if he/she is aware of the
Quality of the Data (QoD) used in deriving a decision, and how QoD improves or deteriorates while he/she
is on the move. We propose a QoD model that takes into account static and dynamic properties of the
mobile decision making environment, uses multicriteria decision analysis to represent the user’s decision
model and to derive a single QoD parameter, and investigates the use of powerful graphics to relay
information to the user.
1 INTRODUCTION
In this paper, we address the concept of mobile
decision support. The aim of developing a mobile
decision support system is to provide on the spot
assistance to a mobile decision maker who is forced
to make decisions on the move. Potentially, the
decision maker is away from his desktop PC / office
environment where information might usually reside
which would help in the decision making. The
prototype developed uses multicriteria decision
analysis (MCDA) to model the decision problem,
scenario reasoning to evaluate the alternative
options, and calculation of Quality of Data (QoD) to
indicate the reliability of a recommended solution.
Although the use of mobile computing is not new,
we believe the use of MCDA and mobile decision
support has been little researched. Further details of
comparative studies are provided in Cowie and
Burstein (2006).
Although applicable to many domains (San
Pedro et al., 2004; Hodgkin et al., 2004), we have
chosen to focus the use of the tool on triage
management to illustrate its potential use and
benefits. In this environment, quick and accurate
decisions are imperative. It is hoped that this mobile
decision support tool can aid in achieving this aim.
We begin by providing a brief overview of
multicriteria decision making, explaining the method
and its potential use. In Section 3 we discuss some
of the main features of mobile decision making, in
particular the concept of static and dynamic
decisions. The measure by which we measure the
quality of the data relayed to the mobile decision
maker is discussed in Section 4. In Section 5 we
detail the prototype developed, discussing use of the
tool in a triage setting. The paper concludes by
examining potential avenues for future work.
2 MULTICRITERIA DECISION
ANALYSIS
Multicriteria Decision Analysis (MCDA) solves a
decision problem by evaluating and comparing a
number of alternatives against several, possibly
conflicting, criteria and proposes the best
alternatives based on some aggregation of these
evaluations and comparisons. In a mobile decision
making context, this MCDA model can assist a
triage worker to understand the best course of action
to take in an emergency situation. By facilitating
real-time connectivity to live data, the decision
maker will be able to access crucial information to
aid, for example, in deciding which Accident and
Emergency (A&E) department a casualty should be
sent to, the best mode of transport to use in transiting
patients, or estimating travel time.
296
Cowie J. and Godley P. (2006).
DECISION SUPPORT ON THE MOVE - Mobile Decision Making for Triage Management.
In Proceedings of the Eighth International Conference on Enterprise Information Systems - AIDSS, pages 296-299
DOI: 10.5220/0002441902960299
Copyright
c
SciTePress
Technology-
related contex
t
User-related
contex
t
Security
Connectivity
Synergy
User’s Decision
Model
Historical
context
Completeness
Currency
D
Accuracy
3 STATIC AND DYNAMIC
DECISION MAKING
Much of our previous work using MCDA has
adopted the approach in static decision making. In
static decision making, we can assume that the
evaluation of alternatives with respect to criteria is
constant (over a given period of time), and
evaluations will not fluctuate according to some
external factor. For example, in assessing a suitable
location to conduct a conference, criteria such as
size of rooms, facilities available, and
accommodation costs will have scores that are
unlikely to change from one minute to the next, one
day to the next, or even one week to the next.
There are however some genres of problems
which encompass dynamic as well as static criteria.
For example, suppose we are considering the best
mode of transport to our work place. Travel time is
a very dynamic attribute in that it can change
frequently. We may have an idea of approximate
travel times for different modes of transport (e.g.
train, bus, car), however, this information may
change after listening to travel reports on the radio
prior to setting off for work, causing us to re-rank
which mode of transport will get us to work in the
shortest time. This scenario is still not static, as 5
minutes into our journey the travel situation may
change again, such that perhaps a different mode of
transport would have been preferable. In such
situations, it is important to have some indication of
how static or dynamic our decision is, and some
estimation of the time period over which the stability
of the data is likely to be maintained. So for
example, if we choose to travel by train as it is
currently the best option, is it likely that this will
remain the optimum option for a given time period,
say 30 minutes. It is here we see the need to not
only provide decision support in the more traditional
sense as seen with static decisions, but also to give
some indication of the quality of the decision or
quality of data being received.
4 QUALITY OF DATA
Our measure of quality is not reflective of the
standard of the information received, but of the
robustness, recency, and stability of the data. Recent
research defines QoD as a score that allows the user
to appreciate the uncertainties inherent to a mobile
computing environment (Mihaila et al, 2000). By
using QoD, appropriate sensitivity analysis can be
performed and results used to better inform the user
as to the suitability of choices. This additional
information allows the decision maker to make their
decision with confidence as not only are they
presented with the pertinent data, they are also aware
of changes in the environment and the potential
impact this could have on the decisions made.
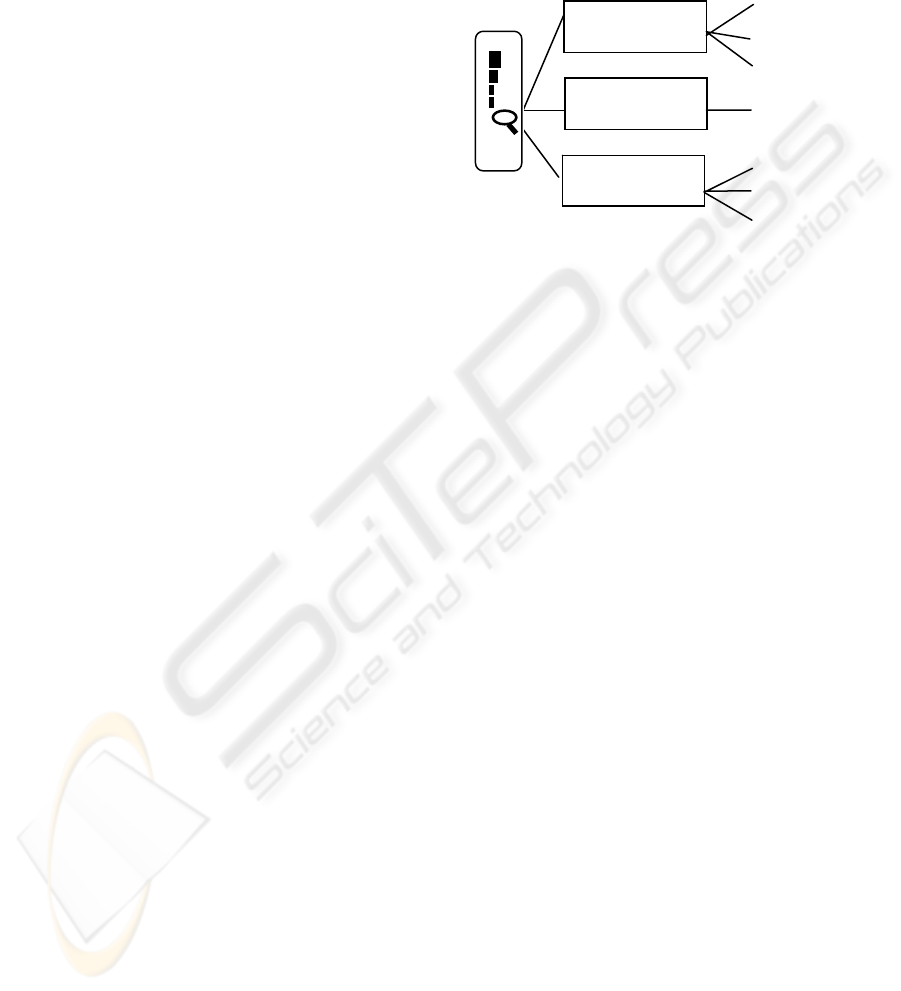
Figure 1: Quality of Data Model.
In Figure 1 we illustrate how QoD can be
represented as an aggregate measure of technology-
related parameters (e.g., synergy, security and
connectivity), user-related parameters (e.g., stability
of scores in user’s decision model), and data quality
parameters that are related to historical context (e.g.,
completeness, currency and accuracy of historical
data). This aggregate measure can be represented as
a weighted sum, to allow the decision maker to
choose the importance associated with the various
quality measures. Further details of the QoD
measure can be found in Cowie and Burstein (2006).
5 THE PROTOTYPE
5.1 Setting Up the Model
The prototype was developed using an Object
Oriented (OO) methodology, where unified
modelling language (UML) was used to assist in
conceptualising the design of the prototype.
Although the Decision Support System (DSS)
proposed is designed to operate on a number of
mobile devices, this initial design is for use on a
PDA. The technologies used comprised of Java ME,
Java SE, Excel, MySQL and the multicriteria
decision analysis software V•I•S•A.
In order to use the prototype, an appropriate
MCDA model must be created and imported onto
the mobile decision device (such as a PDA).
Through access to the web, the PDA can then keep
the decision maker up-to-date with the latest
information pertinent to the problem domain being
addressed.
DECISION SUPPORT ON THE MOVE - Mobile Decision Making for Triage Management
297
5.2 Use of the Model-Triage
Initial real-time assessment of emergency situations
(triage) has to be accurate and quick. Triage is used
in a variety of different scenarios: on the battlefield,
at disaster sites, and in hospital emergency rooms
when limited medical resources must be allocated.
There is an obvious need to optimise the triage
process and outcomes in order to satisfy the
demands for high quality and responsiveness of
contingency management.
In order to demonstrate the potential of the
mobile decision support system, we use the example
of a triage decision maker who is first on the scene
to an accident. In such a scenario, various criteria
would need to be considered in assessing what the
appropriate course of action would be. For example,
supposing the triage worker has to choose between
the following options: Calling for an ambulance,
calling for an airlift, calling for both ambulance and
airlift, and treating injured parties on-site. Factors
that he/she may consider could include time: both
time taken to administer treatment to an individual,
and how critical this time is; also, number of
casualties: where the triage worker needs to assess
the collective number of casualties and differentiate
between the number of major and minor injured
parties.
Assuming the triage accident model is already in
existence, the decision maker at the scene of the
accident would select the “accident model” on his
mobile decision device to aid them in assessing the
most appropriate course of action. The mobile
support system will have been accessing appropriate
websites for up-to-date information pertaining to
accident scenarios over a given time period. The
information collated is assessed and results relayed
back to the mobile decision maker. A typical screen
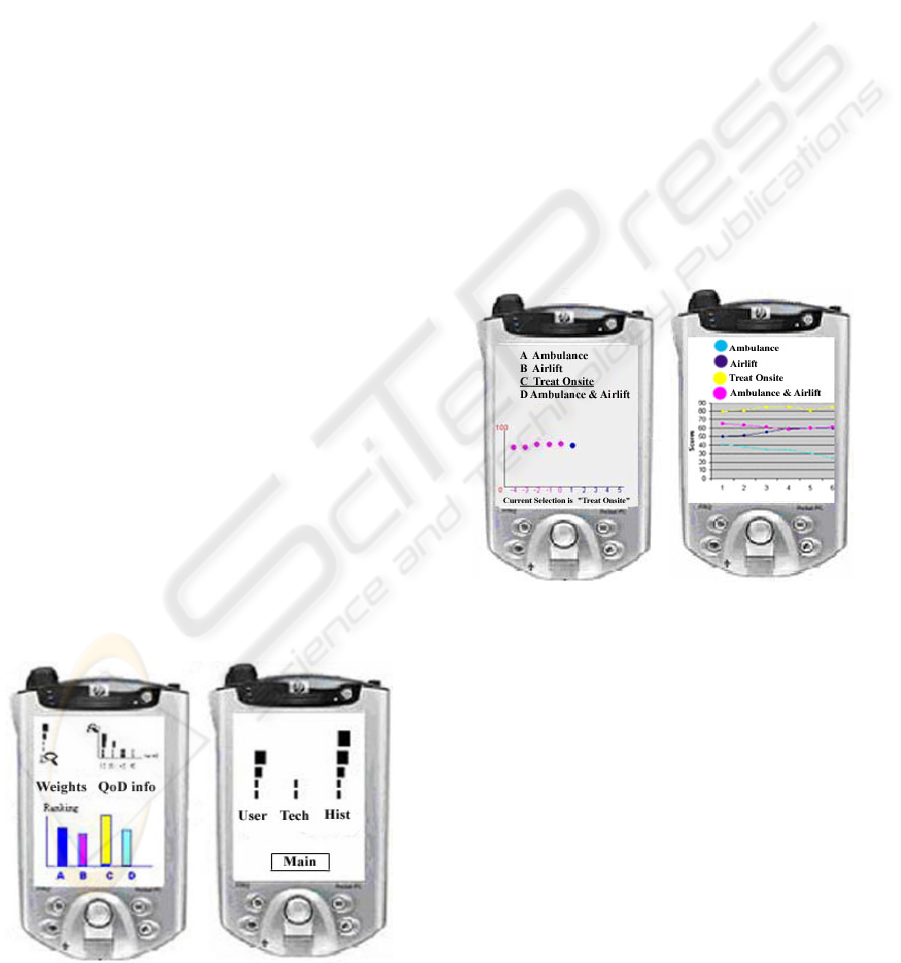
from the model is depicted in Figure 2a.
Figure 2a and 2b: Example of Weights.
It is clear to see from the figure that alternative C
(in our example, “Treat Onsite”) is currently the best
option. However, it is also crucial that the decision
maker (DM) takes into account the QoD score (top
left Figure 2a) and the predicted QoD score over
time (top right Figure 2a). The current QoD
indicates that the quality of the data is quite high.
However the QoD score over time shows that the
quality of the data is likely to deteriorate. Should the
DM wish to find out more about the QoD score, by
clicking on the QoD info button they are taken to the
screen depicted in Figure 2b. This screen allows the
DM to analyse the quality of the data concerning the
main three criteria used in constructing the QoD
score (as shown in Figure 1). From Figure 2b we
can clearly see that it is the technology-related issues
that have poor quality (so for example, perhaps we
are unable to connect to the specified URLs as
frequently as requested due to poor network
connection). The user also has the ability to drill
down further and analyse the factors contributing to
the QoD scores for user-related, technology-related,
and historical contexts.
Figures 3a and 3b: Further Data Analysis.
By clicking on any of the score bars associated
with an alternative (shown in Figure 2a) the decision
maker can view information relating to the stability
of the scores of the alternative. In Figure 3a we see
the stability scores for the “Treat Onsite” option.
Currently, the interface shows the previous scores
(shown in pink) achieved by the option at five
minute intervals. It is evident from Figure 3a that
“Treat Onsite” appears to be a consistently high
scoring option. This may help the decision maker in
deciding whether the option is suitable. Had the
score for “Treat Onsite” been less stable, the
decision maker may feel more cautious about
choosing an option which scores well at the current
time, but may score badly in the next five minutes.
The interface also shows a blue dot which depicts
the predicted score of the alternative in the next five
ICEIS 2006 - ARTIFICIAL INTELLIGENCE AND DECISION SUPPORT SYSTEMS
298

minutes. A simple forecasting technique is used to
achieve this value. This predicted score value
provides additional information to enable the
decision maker to assess the stability of the
alternative by the decision maker.
A further results screen available to the decision
maker is to view comparative scores for each
alternative over a given time period. This is depicted
in Figure 3b. Again the scores are shown at
intervals of 5 minutes. This allows the decision
maker to assess the stability of each option, and how
the ranking of options changes over time. Again, it
is evident that “TreatOnsite” is consistently the best
alternative. Option “Airlifting” the casualties and
“calling for ambulance and airlift” remain fairly
stable options over the displayed time period, ranked
3
rd
and 2
nd
respectively. “Calling the ambulance
only” in this scenario is consistently the lowest
ranked option, and over time the suitability of this
option deteriorates.
6 FUTURE WORK
6.1 Evaluation of System
Current work is focused on evaluating the usefulness
of the tool developed. Initial research has indicated
that mobile decision support is of use to decision
makers on the go (Cowie and Burstein, 2006),
however more rigorous evaluation is due to begin
investigating how such a system is used in different
application areas. In addition, we hope to identify
whether such a mobile device is restricted to only
certain types of decisions, and whether there are
some areas where the quality of a decision made in
this way is degraded. For example, it could be the
case that facilitating mobile decision making
encourages rushed, ill-thought out decisions. Such a
finding would impact greatly on the potential use of
the tool in areas such as triage management, where
the quality of the decision made is paramount.
6.2 Interface Improvements
The current interface, although facilitating mobile
decision support, is undergoing continual
improvement. We hope to run some evaluation
workshops in the near future with potential users of
the system. These workshops will allow us to assess
the usefulness of the tool and the usability of the
interface.
6.3 Prediction Capabilities
One facility that is regarded as highly important
when trying to assess the suitability and stability of
an option is forecasting. Currently, the tool uses a
very simple weighted averages approach to predict
the next score value for an alternative. We hope to
incorporate more sophisticated techniques to enable
a greater amount of prediction ability for future
score values.
REFERENCES
Cowie, J., Burstein, F., 2006. Quality of Data Model for
Supporting Mobile Decision Making. Accepted by
Journal of Decision Support Systems.
Hodgkin, J., San Pedro, J., Burstein, F., 2004. Quality of
Data Model For Supporting Mobile Decision Making.
In Proceedings of Decision Support Systems
Conference, July 1-3, Italy.
Mihaila, G. , Rashid, L. , Vidal, M., 2000. Using Quality
of Data Metadata for Source Selection and Ranking.
In Proceedings of the Third International Workshop
on the Web and Databases, WebDB 2000
San Pedro, J., Burstein, F., Zaslavsky, A., Hodgkin, J.,
2004.
Pay by Cash, Credit or EFTPOS? Supporting the User
with Mobile Accounts Manager. In Proceedings of
the 3
rd
Mobile Business Conference, MBusiness
Conference, New York, USA, 12th - 13th July, 2004.
V•I•S•A. Simul8, Glasgow, UK.
http://www.simul8.com/products/visa.htm
DECISION SUPPORT ON THE MOVE - Mobile Decision Making for Triage Management
299
