
METHOD FOR DRAWING UP A ROAD MAP THAT CONSIDERS
THE SYNERGY EFFECT AND RISK FOR IT INVESTMENT
Tadasuke Nakagawa, Shigeyuki Tani, Masaharu Akatsu
Systems Development Laboratory, Hitachi, Ltd. 292,Yoshida-cho, Totsuka-ku, Yokohama 244-0817, Japan
Norihisa Komoda
Graduate School of Information Science and Technology, Osaka University, 2-1 Yamadaoka, Suita 565-0871, Japan
Keywords: IT investment, Determining priority, Decision-making, Business challenge, Synergy effect, Risk.
Abstract: IT governance lacks a comprehensive vision of investment in two or more projects. It is necessary to decide
the priority levels that maximize the effects under constrained conditions. It is a complex problem, because
while sometimes a greater effect can be obtained by introducing two or more measures at the same time,
other times the effect of two measures introduced at the same time might not be significant. Although there
is a synergy effect when two or more measures are introduced, no method for drawing up an investment-
decision road map has considered that effect. Therefore, we developed one. What a decision-maker must
think about when considering the introduction of two or more measures, can be visualized by drawing up a
comprehensive road map that satisfies constraint conditions, such as the effectiveness of the measure,
budget, time, staff size, order of introduction, and the synergy effect. Road map users can easily reach a
consensus because the map, by taking into account the constraint conditions and the investment decision-
making process, helps them logically explain the order in which the measures should be introduced.
1 INTRODUCTION
Managers must account for all the investments made
in a competitive business environment that rapidly
changes, and it is becoming increasingly important
that they carefully evaluate IT investments before
making them. For instance, in a recent global study
of 659 CEOs conducted by the London School of
Economics, only 25% expressed satisfaction with
the performance of their IT investments. Most IT
projects exceed their budgets and do not perform as
well as expected. For example, a survey of 8000 IT
projects has revealed that only 16.2% of them meet
their goals on time and within budget. In addition,
after considering the risks of development delays
and budget overruns, managers need to think about
assigning IT measures a priority level that
maximizes its effect, while keeping its costs within
the budget. Since IT measures must be considered in
light of the prevailing business challenges, all the
while taking into account the various constraint
conditions, there is a pressing need to develop a
method for determining the priority of measures.
When there are two or more measures to be
introduced, the importance of each must be decided,
the constraint conditions considered, and the most
important measure introduced first. This paper
explains how to make a schedule chart (called a
“road map”) showing the order for introducing each
measure. A manager constructs this road map by
first using the Analytic Hierarchy Process (AHP) to
intuitively determine the importance of each
measure. These determinations are based on
subjective evaluations, and in this paper a measure’s
degree of importance is called its business challenge
level, in the sense of its impact on business
management. The manager then calculates the order
of introduction while taking into account the
constraint conditions. This can be done by using the
Program Evaluation and Review Technique (PERT)
. The portfolio management software, ProSight,
provides a tool that manages the project execution
time and budget by ordering the introduction of
measures according to their importance. However, a
304
Nakagawa T., Tani S., Akatsu M. and Komoda N. (2006).
METHOD FOR DRAWING UP A ROAD MAP THAT CONSIDERS THE SYNERGY EFFECT AND RISK FOR IT INVESTMENT.
In Proceedings of the Eighth International Conference on Enterprise Information Systems - AIDSS, pages 304-307
DOI: 10.5220/0002445703040307
Copyright
c
SciTePress

greater effect might be obtained by introducing two
or more measures at the same time. On the other
hand, the effect of two measures might not be
significant even if they are introduced at the same
time. That is, there is a synergy effect when two or
more measures are introduced. What’s more, while
some measures need to be introduced and others do
not, there has been no method for drawing up a road
map that takes these factors into account.
We propose a method for drawing up a road map
supporting managers. A manager’s investment
priority levels can be visualized by drawing up a
comprehensive road map that satisfies the constraint
conditions. Road map users can reach a consensus
because they can logically explain the order of
introducing measures by considering the constraint
conditions without neglecting the investment
decision–making process.
2 DEFINING THE PROBLEM
When two or more measures are introduced, a
qualitative effect of their introduction is converted
into a quantitative numerical value. After the
constraint conditions are considered, the effects are
maximized by introducing the measure for which
this value is highest first. Each item of constraint
conditions is explained below, and the outline of the
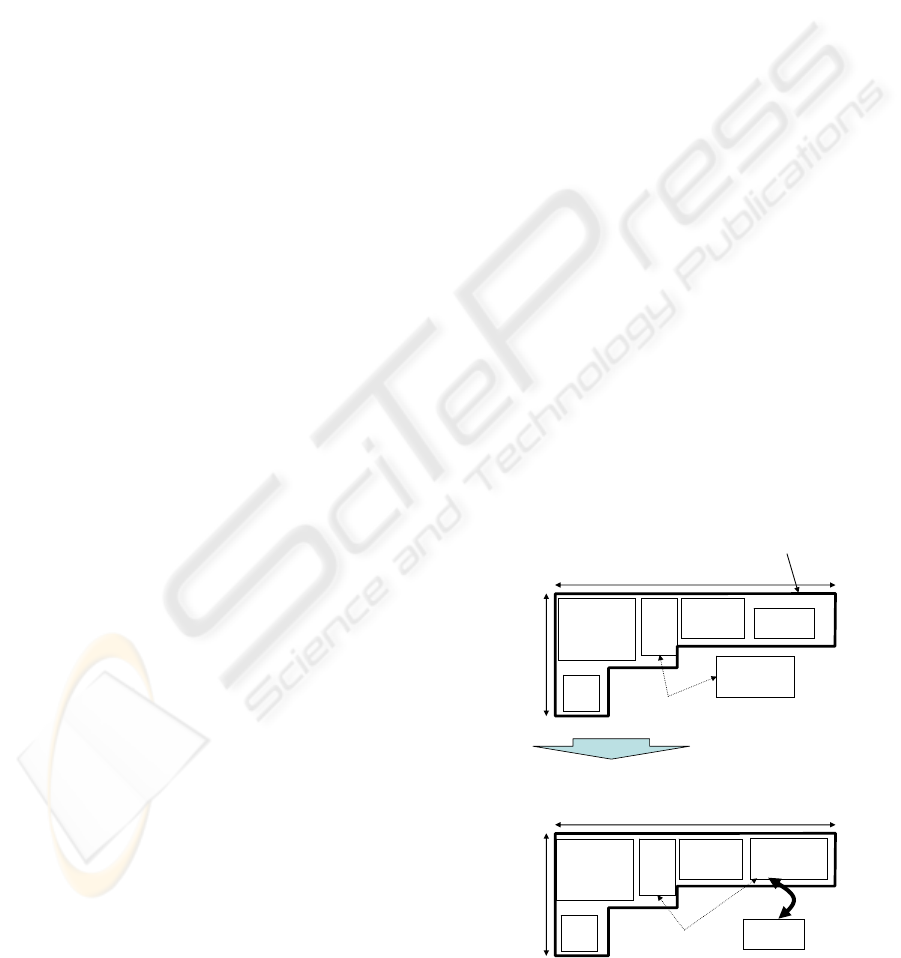
constraint condition is shown in Figures 1 and 2.
(a) Total budget:
This item is the amount of the investment budget
for each fiscal year.
(b) Total staff:
The amount of human resources (number of
people) available for an investment for each fiscal
year.
(c) Planning period:
The period of time that the plan targets.
(d) Business challenge level:
The level of degree to which a measure
contributes to the management of each measure.
(e) Introduction period:
The period of time (specified in months) allotted
for the introduction of each measure.
(f) Time that measure can be introduced:
The length of time (months) during which each
measure can be developed is set.
(g) Introduction necessity:
This item specifies whether or not each measure
must be introduced.
(h) Introduction order:
The order in which the measures are introduced.
(i) Exclusive measure:
This item is set when only one of two or more
measures can be introduced.
(j) Synergy effect:
Either a bigger effect is obtained by introducing
two or more measures at the same time or,
oppositely, the effect of two measures might be
insignificant even if they are introduced at the same
time. This effect is shown by the size of the change
in the business challenge level.
(k) Introduction budget:
The amount of each item’s budget.
(l) Introduction staff:
The amount of human resources (number of
people) for each measure.
In discussing the management strategy, the
accuracy of the estimate in the budget and the
introduction period of measures are rough, and there
is a large uncertainty about the future. When an
uncertainty exists, the risk condition is set.
(m) Risk of introduction period:
This is the fluctuation range of the estimated
introduction period (e).
(n) Risk of introduction budget:
This is the fluctuation range of the estimated
introduction budget (k).
(o) Risk of introduction staff:
This is the fluctuation range of the estimated
introduction staff (l).
Proj 3
Project 1
Project 4
Proj 2
Project 5
Planning period
Total Budget
Or
Total Staff
Project 1
Introduction period
Introduction Budget
Or
Introduction Staff
Road map
Total constraint
condition
Figure 1: Summary of constraint conditions (1).
+5
2 → 3
Project 3
+52 → 3Project 3
1 × 2
Project 2
1 × 2
Project 1
Project 4
Project 2
Project 1
Project 4
+5
2 → 3
Project 3
+52 → 3Project 3
1 × 2
Project 2
1 × 2
Project 1
Project 4
Project 2
Project 1
Project 4
→ : introduction order constraint condition
× : Exclusive measure constraint condition
+:Up Impact
- : Down Impact
Figure 2: Summary of constraint conditions (2).
METHOD FOR DRAWING UP A ROAD MAP THAT CONSIDERS THE SYNERGY EFFECT AND RISK FOR IT
INVESTMENT
305
3 METHOD OF DRAWING UP A
ROAD MAP
.
3.1 Flow of Drawing Up a Road
Map
The procedure we propose for drawing up a road
map is shown as follows:
(1) Setting of the business challenge level and
constraint conditions:
The business challenge level is set to each of two
or more measures. Moreover, a variety of constraint
conditions are set.
(2) Drawing up a road map:
A road map that takes into consideration the set
constraint conditions is drawn up.
(3) Showing the road map:
The drawn up road map is presented to the
decision maker. When the decision maker feels odd
about the road map, or there are contradictions or
incompleteness with the conditions set forth in step
(1), it returns to step (1) and a variety of constraint
conditions are set again.
A consensus building of the parties concerned is
possible by the repetition correction of the road map.
3.2 Drawing up a Road Map that
Considers the Synergy Effect
The way in which the road map is drawn up is based
on how the business challenge level and constraint
conditions specified in Section 2 are set. Concretely,
under the constraint conditions of the entire road
map frame in Figure 1 (budget limits, number of
staff, and the time), the frame of each measure is
arranged in the order of the business challenge
levels, with an eye on the introduction order and the
synergy effect. The solution is calculated in such a
way that maximizes the evaluation value of the road
map as a whole. When we consider the frame of
each measure to be composed of two axes, like those
shown in Figure 1, we have the following two kinds
of frames:
(1) Two-axes frame (time and budget axes).
(2) Two-axes frame (time and staff axes).
When drawing up the road map, we need to build
the constraint conditions of the entire road map into
each of these two kinds of frames, for each measure.
It is impossible to calculate the evaluation value
of the whole road map for all cases because the
computational complexity is expected to be O(n!)
when the number of measures is n. Therefore, we
propose a method for drawing up a road map by
dividing its calculation into two steps, one
calculating the initial solution and the other
calculating an optimisation solution. To maximize
the overall effect of the road map, the initial solution
of the road map is calculated as one in which the
measures are sequentially introduced in descending
order of business challenge level and then
rearranged to satisfy the conditions of the
constraining introduction order.
Now that the introduction priority of the
measures has been determined, the introduction time
of the measure is determined in a way satisfying the
order of the introduction priority. The earliest time is
the introduction time of the measure that satisfies the
conditions constraining the total investment (total
budget, total staff, and planning period) and the time
that the measure can be introduced. The total budget
at a pertinent period is decreased by the amount of
the introduction budget, and the entire staff at a
pertinent period is decreased by the amount of
introduction staff. A measure is not introduced when
there is no introduction time that satisfies the
constraint conditions. The introduction time for each
measure can be determined by repeating the above
steps for all measures. When the introduction time of
a certain measure is decided, however, the exclusive
measure of it is not introduced. The procedure
described above provides an initial road map.
Next, the road map is corrected to consider the
synergy effect. An example of this correction
procedure is shown in Figure 3.
Figure 3: Correction of road map considering synergy
effect.
Proj 3
(10)
Project 1
(15)
Project 4
(8)
Proj 2
(12)
Project 5
(6)
Project 6
(4)
* ( ): Business challenge level
* Project 3 + Project 6
= 10 + 4 + 8 (Synergy Effect)
= 22
Synergy Effect +8
Exchange
<Initial Solution> Business challenge level: 51
- Not execute
Planning Period
Total Budget
Or
Total Staff
Total Budget
Or
Total Staff
Planning Period
<Optimum Solution> Business challenge level: 57
Proj 3
(10)
Project 1
(15)
Project 4
(8)
Proj 2
(12)
Project 5
(6)
Project 6
(4)
- Not execute
Road map
entire constraint
condition
Synergy Effect +8
ICEIS 2006 - ARTIFICIAL INTELLIGENCE AND DECISION SUPPORT SYSTEMS
306

A measure with a high business challenge level is
selected from among the measures that have a
positive synergy effect and are not on the road map,
and that measure is inserted. At the same time,
measures are pulled out in increasing order of their
business challenge levels until all the constraint
conditions are satisfied. Conversely, when the road
map contains measures with a mutually negative
synergy effect in the road map, one measure is
excluded in the road map and in its space a measure
that is not on the map and has a high business
challenge level is inserted. When the synergy effect
is considered, those measures are actually replaced
when the business challenge level of the entire road
map is high before the measure is replaced.
3.3 Risk
It is necessary to take into consideration
uncertainties (risk) in the future with resources
and/or time constraint conditions. For instance, a
development delay or an over-budget of a measure
can happen. To take such risks into consideration,
the expected value and fluctuation range are set for
items that have uncertainties. Road maps with room
according to an uncertain size of each measure are
drawn up, because it is preferable not to influence
the entire road map, even if the development of the
measure is delayed. The value in which the expected
value is added to the fluctuation range is set as the
value of the constraint condition, and the road map
is drawn up.
4 VERIFICATION
This section explains how simpler fictitious
constraint condition data than actual problem data
was used to evaluate the proposed method. The
result of applying the proposed method to the data
described in the preceding paragraph is shown in Fig.
4, and the road map drawn up without considering
the synergy effect is shown in Fig. 5.
Figure 4 shows that the road map without
contradictions and taking into consideration a
variety of constraint conditions, such as the
introduction order, can be drawn up. On the other
hand, both measures G and H are introduced in
Figure 5, where the synergy effect is not considered,
but the synergy effect is set to a minus, and the
introduction is not significant. On the other hand,
measure G is not introduced in Fig. 4, where the
synergy effect is considered, and a road map that is
actually suitable can be drawn up. In addition, the
business challenge level in Figure 4 is 87.7, while
that of Fig. 5 is 82.0. This shows that a road map
with a large effect can be drawn up.
5 CONCLUSION
In this paper we proposed a method for drawing up a
road map supporting the investment decision-
making required when the introduction of two or
more measures after taking into account the
constraint conditions. We also confirmed the
effectiveness of the proposed method. In addition,
the tool that executed the proposal method was made,
and was applied to actual user data.
REFERENCES
Compass Group., 1999. International IT Survey Census.
Rotterdam, The Netherlands. Compass Publishing BV.
The Standish Group., 1995. Chaos Report.
Saaty, T. L., 1980. The Analytic Hierarchy Process.
McGraw-Hill.
Washington, D.C., 1961. PERT: Program Evaluation and
Review Technique, Handbook, NPC-101.
ProSight, http://www.prosight.com
Figure 5: Road map (not considering synergy effect).
Project A
(10)
Project H
(12.5)
Project F
(15)
Project B
(12.5)
Proj J (1.5)
Project C
(8)
Proj D
(6)
Proj L
(3.5)
Project M (3)
Project G
(10)
Staff
Year 1 Year 2 Year 3
Business challenge level: 82.0
Figure 4: Road map.
Staff
Business challenge level: 87.7
Project A
(10)
Project H
(12.5)
Project F
(15)
Project B
(12.5)
Proj J (1.5)
Project C
(8)
Year 1 Year 2 Year 3
Project
D (6)
Proj L
(3.5)
Project M (3)
Project O
(0.7)
METHOD FOR DRAWING UP A ROAD MAP THAT CONSIDERS THE SYNERGY EFFECT AND RISK FOR IT
INVESTMENT
307
