
EVALUATION OF USER INTERFACES FOR
GEOGRAPHIC INFORMATION SYSTEMS: A CASE STUDY
Lucia Peixe Maziero, Cl
´
audia Robbi Slutter
Graduate Program on Geodetic Science, Federal University of Paran
´
a
Curitiba, Brazil
Laura Sanch
´
ez Garc
´
ıa, C
´
assio da Pieva Ehlers
Graduate Program on Computing Science, Federal University of Paran
´
a
Curitiba, Brazil
Keywords:
Geographic Information Systems, Usability, Cognitive Engineering.
Abstract:
This paper presents an evaluation of user interfaces of two Geographic Information Systems (GIS) tools, Ar-
cView and Spring. This work is related to a specific characteristic of those interfaces, which is to allow the user
to view a map. User interfaces were evaluated based on the main cognitive difficulties related to the execution
and evaluation bridges employing a cognitive engineering approach and, complementarily, in accordance with
the semiotics engineering parameter called “system communicability”. Both evaluated systems are generally
considered to be quite complex, not only in terms of understanding the interaction elements present in the
interface, but also the knowledge embedded in the tasks that can be accomplished by these systems. Although
the study described in this work was focused on a single task it confirmed the general opinion about these
kinds of applications: a novice user cannot explore them without some assistance from an expert user or by
studying books and manuals. Even an expert user usually faces significant difficulties using those GIS tools.
1 INTRODUCTION
This paper presents the results of an evaluation of
the user interfaces in Geographic Information Sys-
tems tools, ArcView and Spring. ArcView is com-
mercial software developed by ESRI - Environment
Systems Research Institute (www.esri.com). Spring
is free software developed by INPE - National Insti-
tute for Space Research, Brazil (www.inpe.br). The
main research goal was either to prove or to reject the
popular idea about the impossibility of overcoming
the difficulties of using either of these tools. The rel-
evance of this study is based on the assumption that
a poor and difficult interface is not a consequence of
the system complexity but a result of an inadequate
interface design.
Due to the inherent large number of interaction pos-
sibilities of these tools, this work was limited to those
interfaces designed to allow the user to view maps
from stored data. Even if we consider that this kind of
tool is designed for specialized users, the option for a
simple task evaluation is justified because of the di-
rect relation between the complexity of the task and
the difficulties of the interface design process. So, if a
simple task proves to be difficult to be accomplished
a more complex task will certainly be also difficult.
The user interface evaluation was based on the main
cognitive difficulties related to execution and eval-
uation bridges, based on the Cognitive Engineering
(Norman, 1986) approach. The quality of the inter-
face environment was complementarily evaluated in
accordance with the Semiotics Engineering parame-
ter called “system communicability” (Souza, 2005).
According to (Burrough, 1986), GIS is “a power-
ful set of tools for collecting, storing, retrieving at
will, transforming, and displaying spatial data from
the real world for a particular set of purposes”. These
GIS characteristics make them powerful tools for
decision-making and are widely employed in areas
such as environmental and urban and regional plan-
ning. In order to evaluate GIS interfaces, it is useful
to understand one difference between these types of
tools and map viewer tools. Map viewer tools allow
their users only to view maps from a database. The
user cannot change the stored data. On the other hand,
GIS has tools that can be used for manipulating, and
thus changing, the data.
1.1 ArcView and Spring
ArcView is a tool that allows the user to explore, an-
alyze and depict geographic data. Any users, even
79
Peixe Maziero L., Robbi Slutter C., Sanchéz García L. and da Pieva Ehlers C. (2006).
EVALUATION OF USER INTERFACES FOR GEOGRAPHIC INFORMATION SYSTEMS: A CASE STUDY.
In Proceedings of the Eighth International Conference on Enterprise Information Systems - HCI, pages 79-86
DOI: 10.5220/0002455600790086
Copyright
c
SciTePress

those who do not have a solid background in cartog-
raphy, can generate maps and manage spatial data.
Users with knowledge on GIS and cartographic the-
ory can easily integrate spatial data from different
sources and with different characteristics in order
to develop spatial analysis. ArcView software is
compatible with several different operational systems
such as Microsoft Windows, Apple Macintosh and
Unix variants. ESRI has also developed a program-
ming language, Avenue, for customizing ArcView ap-
plications (ESRI, 1996). Spring is also a GIS ap-
plication that allows its user to explore, analyze and
present geographic data. It is possible to install and
run Spring software on different platforms, from mi-
crocomputers to high performance RISC worksta-
tions, at the same level of efficiency. It also runs on
different operational systems, such as Microsoft Win-
dows or UNIX. Spring has a number of different tools
for manipulating spatial data, for example spatial in-
dexes, image segmentation and classification, or digi-
tal surface model generation. One of its most impor-
tant characteristics is that it is free and can be down-
loaded from the INPE Internet site (INPE, 2005).
Both ArcView and Spring have a great number of
computer capabilities, which makes possible the ac-
complishment of multiple user tasks. We describe
some of those capabilities below as an example of
their potential (ESRI, 1996; INPE, 2005):
• Map generation: to view or to edit maps, and to add
data to them from a database;
• Generating new information: to generate new in-
formation from graphic (vector and raster data)
and alphanumeric databases by using spatial analy-
sis tools. These data can be stored in software
(ArcView or Spring) file extensions, can be im-
ported from other softwares or even from Internet
sites. Data integration is based on geographic posi-
tion data (geographic coordinates);
• Spatial trend evaluation: to manipulate geographic
data and to allow the user to generate spatial
phenomenon process models. Spatial phenom-
enon models can reveal unknown process trends
which can provide important information to deci-
sion makers;
• Map presentation: to prepare map layouts in order
to print them or view them on a computer screen
along with graphics, tables, pictures, etc.
2 STATE OF THE ART
2.1 Related Work
A research described in (Prado et al., 2000) was based
on viewing and interpreting maps as comunication ac-
tivities about natural facts of the real world. The main
research goal was to evaluate the expressive power
(and the expressive limitations) of GIS tools. The
analysis of ArcView 3.0, Idrisi 2.01 and Spring 3.2
leads to the specification of the discrete common el-
ements (i.e. icons) present on a GIS interface. Other
studies, from which we can quote (Schimiguel and
Baranauskas, 2002) are also oriented to the semiotic
analysis of the interface signs, in order to figure out
which of the interpretation aspects are presented on
the interface and their implications in the system com-
municability.
The work (Seixas and Souza, 2004) proposes an
evaluation method for interfaces in which maps are
involved. This method (ISIM - Interfaces Semiotic
Inspection of Maps) also adopts the Semiotic Engi-
neering approach. It evaluates the interaction qual-
ity based on the task of locating or defining roots in
maps by identifying the presence of descontinuities
in the interaction that affect the user compreension
of the system. ISIM uses analytical techniques for
the application context definition and empirical tech-
niques for testing the tool by real users. This work
shows a class of common problems related to the in-
teraction process with maps tools, more precisely the
zoom funcionality and the sign changes. Our work
complements these results, showing critical problems
in a very simple task.
In general, global interfaces evaluation methods de-
mand for the consideration of the user knowledge
background, that is, experts or common users (Prates
and Barbosa, 2003). This was done in the present
work, in the sense that the selected task (viewing a
map) was well-defined and established as a poten-
tially first task to be developed within any possible
context of real use.
2.2 Theoretical Bases
We developed this work based on cognitive and semi-
otics engineering approaches. The Cognitive Engi-
neering has provided the main theoretical support to
the Computer-Human Interaction research area for
the last three decades; the Semiotic Engineering has
been recently consolidated as a sound theory which
complements the cognitive approach, by granting a
rather complete view through an integrated evaluation
process.
According to Cognitive Engineering (Norman,
1986), when the user interacts with the software
he/she crosses the “execution gulf” and the “evalu-
ation gulf” (Figure 1). In order to cross those gulf
bridges the user has to: a) Define his/her aim: which
goal he/she wants to achieve; b) Formulate an inten-
tion: take a decision about what to do in order to
achieve this aim; c) Translate his/her intention into
system routine tools; d) Execute the action in the sys-
ICEIS 2006 - HUMAN-COMPUTER INTERACTION
80
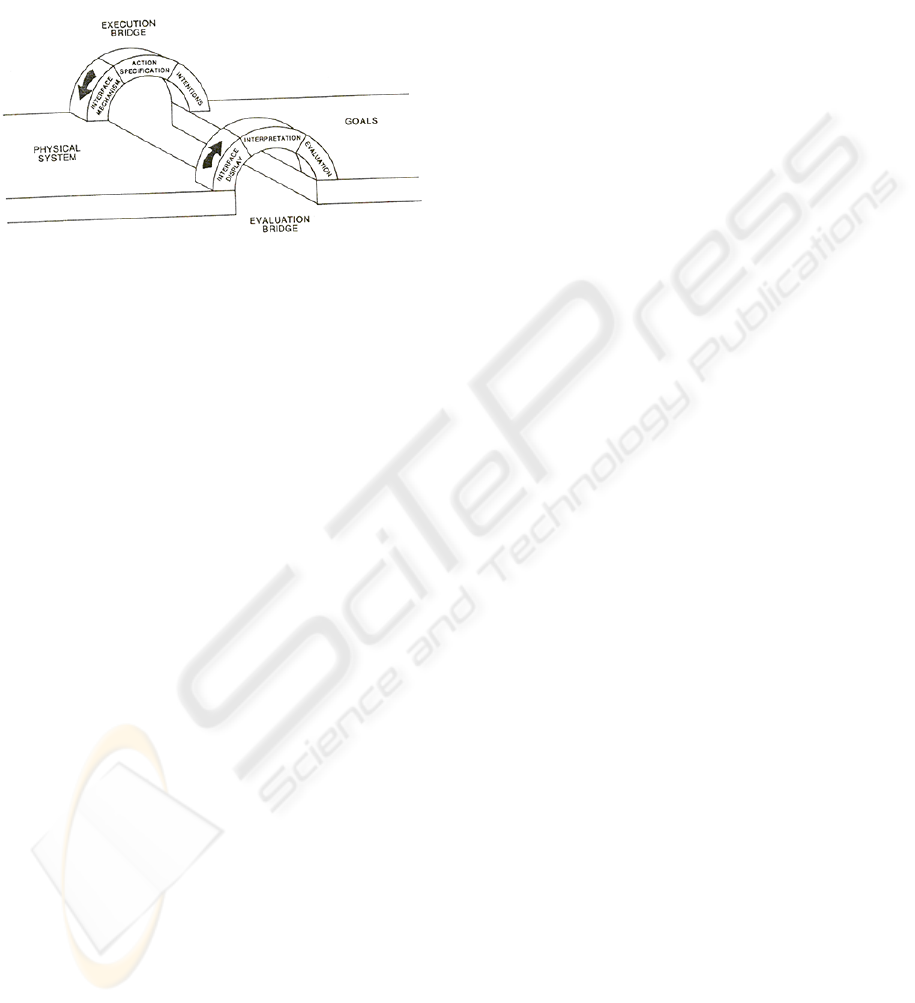
tem; e) Understand the system state; f) Interpret sys-
tem behavior; g) Evaluate results in relation to his/her
initial aim. User tasks, from (a) to (g), are parts of a
process that are designed to cross the “execution gulf”
and the “evaluation gulf” (Figure 1).
Figure 1: Execution and evaluation gulfs (Norman, 1986).
Semiotics Engineering (Souza, 2005), which is
based on these Cognitive Engineering concepts, con-
siders the user-interface as a message (or a set of mes-
sages) that is sent from the interface designer to the
user in an asynchronous and unilateral way. Accord-
ing to this approach, the challenge for the interactive
environment designer is to answer, by an interface
language, two fundamental questions:
• What is the designer’s interpretation of the user
problem?
• How the user has to use the system in order to
achieve his/her goals?
According to Semiotics Engineering, the term “us-
ability” is enhanced by the term “communicability”,
which is related to the system’s capability to provide
the user with answers to these two basic questions
above. Communicability is related to the user’s abil-
ity to understand the interface design as the designer
planned it (Souza, 2005). The more the user under-
stands the designer’s reasoning embedded in the ap-
plication, the more the user can use the application
in a creative, efficient and productive way. The de-
sign should allow the user to understand how he/she
should interact with the application and to under-
stand the designer’s interpretation of the problem to
be solved at every step along the interaction way. Bad
communicability causes breakdowns in the communi-
cation process between the designer and the user and
negatively impacts the efficiency in the user-system
interaction.
The paper (Silveira, 2002) identified interaction
breakdown situations (Winograd, 1996) based on sys-
tem user tests, and proposed a set of statements re-
lated to each problematic situations. According to
(Souza, 2005), there are 13 basic communicability ut-
terances that characterize breakdowns in user-system
communication:
What is this? – Why does not it? – Help! –
Where is it? – What now? – What happened? –
Oops! – Where am I? – I cannot do it this way
– Thanks, but no, thanks – I can do otherwise –
Looks fine to me – I give up.
This set of utterances emerged from an empirical
study involving real world users. The designer can
use these statements as a core set in order to select
those which could in fact occur during the interaction
with a certain tool. The selected statements can be
used to prevent and/or deal with eventual communi-
cation breakdowns.
The “scenarios” technique was used in order to
specify a number of possibilities for user -system in-
teraction states based on the knowledge about the
users profile and the expected system tasks. In other
words, each “scenario” was built from the authors’
previous substantial observation of communication
breakdowns during these tools use, together with the
authors’ systematic analysis of the whole process
needed to perform the selected task, which deter-
mined the suitable utterances (Carrol, 1995). “Scenar-
ios” are textual or pictorial descriptions of organiza-
tional uses of the application. “Scenarios” can be built
for computer systems (interface evaluation) or for hu-
man organizational procedures (interface design). For
systems’ evaluation, “scenarios” can be useful tools
for identifying, analyzing and evaluating system uses.
They allow the designer to use opinions, critiques and
suggestions about the system in order to improve the
system interface.
2.3 Methodological Steps
In order to define the steps of this work, we made
two assumptions. First, the level of difficulty of the
task developed by the user would be similar for both
ArcView and Spring. Second, the user would not be
an expert in cartography or GIS, and would never
have been exposed to this tool. Therefore, the first
step was to define the task to be carried on, consid-
ering that the user would not use any kind of help or
tutorial.
The next step was to identify the possible difficul-
ties the user would face when he/she is required to
accomplish any task. These difficulties are related to
execution and evaluation gulfs. In order to identify
user difficulties, we designed “scenarios” that repre-
sent every predictable step the user would try in order
to accomplish the required task. Because of the cog-
nitive difficulties inherent in the tool it is possible that
the user is not able to cross the execution and evalua-
tion gulfs at his/her first try. The user then would need
EVALUATION OF USER INTERFACES FOR GEOGRAPHIC INFORMATION SYSTEMS: A CASE STUDY
81

to make multiple attempts to cross those gulfs us-
ing different tasks/actions. This process would occur
as many times as necessary in order to achieve user
goals. This situation can be represented by “abduc-
tive reasoning” (Souza, 2005), where several possible
future actions can be imaged by the user. Every time
the user is not well succeeded in achieving his/her
current goal, he/she changes his/her goal and tries to
cross those gulfs again. This process ends when the
user’s goals are accomplished and the gulf bridges are
crossed.
The book (Souza, 2005) defined two main levels
of designer messages to the user: strategic level and
operational level. The strategic level is character-
ized by a meta-communication, which helps the user
to decide about choosing tasks to efficiently achieve
his/her goals. Operational level messages must be
able to maximize the communicative capabilities of
the interface elements in every moment of user in-
teraction. We propose here an intermediate level
in which system tools communicability is evaluated.
This intermediate level is understood as the level of
system support for specifying and evaluating user ac-
tions.
In this work, system communicability was ana-
lyzed according to the level of cognitive difficulty.
For every user interaction, we verified the kind of
messages available on the system interface in order
to analyze the interface communicability. Then, we
registered the information acquired from this analysis
in evaluation tables.
3 EVALUATING THE USER
DIFFICULTIES
The user task selected for evaluating the ArcView and
Spring systems was simply to view a map on a com-
puter screen. The map was generated from a set of
data that was stored in a CAD (Computer Aided De-
signer) format file. In order to show the methodolog-
ical steps in all their deepness, we describe the whole
process carried on with ArcView system. A similar
procedure was developed with Spring. To achieve
his/her goal to view a map on a computer screen, the
user needs to take the following steps:
1. When the user begins the interaction process to
view a map, the first question is “what can I do
to view the map on the screen?” At this mo-
ment the user faces the first difficulty related to
the execution gulf, which is “which action to take”.
The user needs to identify the available interface
tasks/actions and find out which one will allow
him/her to achieve his/her goal. He/she makes
the assumption that he/she is able to identify the
right tasks/actions to use by looking at the inter-
face. This scenario is described in Table 1.
The interaction breakdown is probably caused by
a system communication fault. The main problem
is regarded to the execution gulf at this interaction
moment and consists of a lack of interface com-
munication at the strategic level which would indi-
cate to the user what to do to achieve the intended
goal (i.e., to draw the map on screen). A message
describing the sequence of actions would help the
user in identifying the whole procedure to be fol-
lowed in order to draw the map.
2. The user returns to the initial goal and redefines
his/her aim in order to “find the button on the in-
terface that draws the map”. The user crosses the
execution and evaluation gulfs of the new aim, but
does not achieve the goal. Because the user tries
some different actions (buttons), he/she acquires
some knowledge about the interface. Among those
available buttons he/she tries the add theme one,
which can be the one to use in order to achieve the
goal. This scenario is described in Table 2.
The problem here is most likely caused by a lack
of communication related to the level of supporting
user actions (intermediate level). There is no infor-
mation on the interface that tells the user what each
button does, which makes the task execution diffi-
cult. Nevertheless, there is some system support for
crossing the execution gulf related to highlighting
some buttons, the only ones available to start any
task on ArcView (action supporting level).
3. The user accomplishes a new gulf crossing and re-
defines his/her aim, which is now “to add a theme”,
one of the available buttons. The user crosses the
execution gulf but the map is not drawn on screen,
which corresponds to an evaluation gulf. Instead,
a dialogbox appears on the screen that displays a
message to the user. However, the message is not
clear enough to allow the user to understand the re-
sult of his/her action (pushing the add theme but-
ton). The user has some difficulties in knowing if
the action will accomplish the task that makes it
possible to achieve the goal, and to know if he/she
must do something else at that moment, like per-
forming some action in the dialogbox. This sce-
nario is described in Table 3.
At this time, after the user has tried some actions,
an operational fault occurs due to misleading but-
ton labels. The label for the right button should
be something like “select the map data file”. Once
more the system fails at the action support level, as
it does not display some advising message to the
user related to the actions he/she should take.
4. The user accomplishes a new gulf crossing and re-
defines his/her aim, which is now “to look for the
ICEIS 2006 - HUMAN-COMPUTER INTERACTION
82
Table 1: Scenario 1.
Goal View the map on the screen
Execution Intention Draw the map on the screen.
Actions specifications Find the appropriate action on the interface.
Execution Check the available interface actions and select one (Where is it?). At this
moment there is a cognitive difficulty which results in an interaction break-
down because the user could not identify the appropriate tool for accom-
plishing the intended goal.
Evaluation Perception Some buttons are highlighted.
Interpretation The highlighted buttons must indicate the available actions.
Evaluation It is not possible to evaluate the result because none of those actions are
suitable to accomplish the task.
Table 2: Scenario 2.
Goal View the map on the screen
Execution Intention Find the one button on the interface “to draw the map on the screen”
Actions specifications Read the labels of the highlighted buttons
Execution Point the mouse on the buttons in order to read their labels (What now?,
Where is it?). At this moment there is a cognitive disconnection disconnect
which results in a interaction breakdown because the user could not identify
the appropriate tool for accomplishing the intended goal.
Evaluation Perception The user notices that there are 5 available buttons on the interface: save
project, add theme, help, text and draw point.
Interpretation The add theme button must be the one to draw the map on screen.
Evaluation The evaluation is not efficient because the user is not sure about the meaning
of the result.
file that must be used to draw the map”. The user
crosses the execution gulf but he/she faces an un-
expected result during the evaluation gulf, that is,
no file is shown. The user does not know if he/she
made some mistake because the system does not in-
form him/her about executing (running) some soft-
ware routine. The novice user will need some help
because he/she will not know what to do. This sce-
nario is described in Table 4.
The need for help characterizes a communication
breakdown. The system should advise the user that
it is necessary to take some action related to the
kind of external file extension (CAD reader, Data-
base Access, and so on) when the file extension is
not a “shapefile” (the ArcView file extension). This
lack of communication results in a failure at the ac-
tion support level that interferes with an evaluation
of the preview result and fails to assist the user in
defining the next user decision.
5. After asking for some help from outside the system,
the user redefines his/her aim. The user crosses the
execution gulf but at the evaluation gulf moment an
unexpected result occurs, that is, nothing is shown
on the screen. The difficulty is to know if the file
extension is indeed activated since no confirmation
message is displayed. Because nothing happened,
the user may believe the file extension is selected
only by clicking over the file name. But the system
requires the user to click on the checkbox related
to the file extension although the user does not yet
know it. This scenario is described in Table 5.
Again, the system fails because of the absence of
some message that could help the user to evaluate
the result of some action taken and what should be
done next.
6. The user assumes that the system activates the file
extensions and again has the intention of using the
“add theme” action. The user crosses the execution
gulf however a new element of the process appears
in the evaluation gulf and the user tries to identify
it. The user does not know how to proceed. This
scenario is described in Table 6.
If the system interface environment is not familiar
to the user, that is, if he/she is not aware of the pur-
pose of every interface widget he/she is not aware
of checkbox functionality. In this situation there is
a communicability fault in the system because of
the lack of a message that could support the user in
deciding what action has to be taken.
7. Considering that the user decides to activate the
checkbox, the novice user can finally cross the ex-
ecution and evaluate gulfs to achieve his/her aim.
This situation is described in Table 7.
EVALUATION OF USER INTERFACES FOR GEOGRAPHIC INFORMATION SYSTEMS: A CASE STUDY
83
Table 3: Scenario 3.
Goal View the map on the screen
Execution Intention Add one theme
Actions specifications Select the add theme button
Execution Click the add theme button on the tool bar
Evaluation Perception A dialogbox is shown on screen (Oops!)
Interpretation What to do in the dialogbox? (What now?) At this moment a cognitive
disconnection causes a breakdown.
Evaluation Evaluation is hampered by the ambiguity of the application’s response sys-
tem.
Table 4: Scenario 4.
Goal View the map on the screen
Execution Intention Look in the dialogbox for the file that will show the map
Actions specifications Select the file in the computer’s directories that will show the map
Execution Look in the dialogbox for the file in which the map data are stored and select
it
Evaluation Perception No file appears (Oops!)
Interpretation (What happened?) If the action to be taken was correctly selected, why was
the map not drawn on screen? (Why didn’t it work?)
Evaluation It will be necessary to ask for some help.
4 ACHIEVED RESULTS
For a novice user, the evaluation of the user interface
of both systems, ArcView and Spring, resulted in the
same kinds of difficulties. The main difficulties are
related to the evaluation gulf. A significantly greater
number of repeated problems were found in Spring
than in ArcView user interface use. Spring also pre-
sented a greater number of execution gulfs, mainly re-
lated to the necessity of more help for the user, with-
out which the system fails. Table 8 shows a synthesis
of the problems identified.
Altough Table 8 shows different numbers for each
evaluated tool, its intention is not to stablish quan-
titative differences between them, but to summarize
all problems found in both of them, well-known and
widely used GIS tools, one of them commercial and
the other free. It is worth to note that the qualita-
tive information determined by the scenarios evalu-
ation from the semiotic approach is potentially richer
as a system communicability design insume than the
quantitative results shown in Table 8.
The same example of interface analysis based on
scenarios built for an experienced user, who knows
which commands he/she has to run on the interface,
does not solve all of the interface problems. The ex-
perienced user can cross the execution gulfs but, like
the novice user, cannot successfully cross the evalua-
tion gulfs because most of the time the user does not
know the system state. Then the user experiences the
following types of problems:
• Did the chosen command really run? The user does
not know if the selected command is being run by
the system or even if it was already run, because
in many situations there is no interface change or
confirmation message.
• Was the command correctly selected? It is impos-
sible for the user to notice when he/she has chosen
a wrong command because there is no confirmation
of a command result.
• Is the sequence of chosen commands correct? The
user only notices mistakes in the command se-
quence when he/she finishes the task and does not
achieve his/her goal.
ArcView and Spring communicability related to in-
terface quality for those tasks described in this paper
are characterized as follows:
Strategic messages were not found. Strategic mes-
sages are those messages that help the user to under-
stand the strategic aspects of tool use, that is, mes-
sages that show the user a sequence of tasks that can
make the system use viable and efficient.
At the level of action specification and evaluation
supporting messages, both systems fail repetitively
due to the lack of beforehand advise (which occurs
more frequently with Spring than ArcView) and for
the lack of explicit information about the system’s
state after an user action. Sometimes communicabil-
ity breakdowns occur because there are no changes
visible on the screen. This situation characterizes an
extreme lack of communication in the interface, mak-
ing it difficult to evaluate the result of any user action.
Both ArcView and Spring present the same kind
of operational messages in response to user actions:
dialog boxes and checkboxes. The quality of these re-
ICEIS 2006 - HUMAN-COMPUTER INTERACTION
84

Table 5: Scenario 5.
Goal View the map on the screen
Execution Intention Activate the ArcView file extensions related to the CAD data file
Actions specifications Select the option extensions and the option CAD Reader in the File menu.
Execution Select the option extensions in the File menu and activate the ArcView ex-
tension related to the CAD reader file in the dialogbox, clicking in its check-
box.
Evaluation Perception There is no visible change.
Interpretation Is the file extension activated? (Oops!, What happened?)
Evaluation The resulting evaluation is degraded by the system inability to communicate
with the user.
Table 6: Scenario 6.
Goal View the map on the screen
Execution Intention Add a theme to the CAD data file.
Actions specifications Select the add theme command and select the map data file.
Execution Click on the add theme command button in the toll bar in order to add a
theme; look for the map data file in the dialogbox and select it.
Evaluation Perception The map related theme is added to the table of contents in the view panel,
next to a checkbox, and nothing is drawn on the screen (What is this?)
Interpretation Do I have to select the checkbox? (What now?)
Evaluation If the interface tools are familiar to the user, he/she realizes that it is neces-
sary to select the checkbox.
sponses depends on the level of user knowledge about
the interface widgets. User knowledge about the sys-
tem becomes an essential factor in understanding op-
erational messages. Then, a more precise evaluation
of system communicability is related to user back-
ground. In this work, user system scenarios were built
assuming a novice user who could not understand
the operational messages. Therefore, dialog box and
checkbox messages were not efficient because they
were the only messages from the system to the users
in response to his/her actions and consequently some
cues to future actions.
The operational level of interface communicability
also includes interface element labels. Labels proved
not to be appropriate for every user interaction situa-
tion. The action “add theme” in ArcView is available
from the moment a session is opened, but it is only re-
lated to the first step of the process of drawing a map
and not to the whole process. In Spring, the same ac-
tion (draw) is also available as soon as the session is
opened even though there is no information level se-
lected. An appropriate approach to interface design
would be to label this action button with some more
specific name for the first step of drawing a map. Af-
ter this first step, the button would be available only
when the software is enabled to draw a map.
5 CONCLUSIONS
Both of the systems evaluated are well known for their
complexity. The complexity is related not only to the
interaction elements present on the interface, but also
to the large range of tasks that can be accomplished
by these systems. This study focused on a single task
and confirmed the general opinion of these applica-
tions. A novice user cannot explore them without sig-
nificant assistance from a more experienced user or
by studying books and manuals, while even an expe-
rienced user often faces some difficulties.
The problems discovered in those scenarios out-
lined above for a novice user show us the existence
of general systems interaction faults related to the re-
quest (execution gulf) and task evaluation (evaluation
gulf) processes. This conclusion is based on the re-
peated breakdowns that occur during a wide range of
tool interaction. The regularity of breakdown occur-
rences allows us to conclude that these interface prob-
lems can occur during any system tasks.
The problems we observed related to the evaluated
task, that is, to draw a map on the screen, suggest
some important problems with system communicabil-
ity. The information faults at the level of actions re-
quest and evaluation occurred more frequently when
the user tried a different action to accomplish the
same task because the preview action did not work.
Most of the time, there is no change on the system
screen or any kind of message that could indicate to
the user the system state. Consequently he/she can-
EVALUATION OF USER INTERFACES FOR GEOGRAPHIC INFORMATION SYSTEMS: A CASE STUDY
85
Table 7: Scenario 7.
Goal View the map on the screen
Execution Intention “Drawn the map on the screen”
Actions specifications Select the checkbox
Execution Activate the checkbox related to the theme of the table of contents that has
been just added.
Evaluation Perception The theme is shown on screen.
Interpretation The drawing on the screen corresponds to the map.
Evaluation The task is successfully completed. The search for information is over.
Table 8: Scenario 8.
Cognitive difficulties Gulf Kind of breakdown
utterances
Breakdowns
(ArcView)
Breakdowns
(Spring)
Which command to run? execution What now? 1 8
Which commands are available? execution What is this? 1 1
Which is the command sequence? execution Where is it? 1 1
Do I need some help? execution Help 0 9
Is the command correctly chosen in order to
achieve my goal?
evaluation Oops! 3 3
What do I do now? Which is the next step?
evaluation What now? 2 3 What happened?
evaluation What happened? 2 4
Has the command really executed? evaluation Why didn’t it? 1 1
Do I need some help? evaluation Help 1 1
What is it? evaluation What is it? 1 0
not evaluate the results of his/her action. Although
experienced users can overcome some of these sys-
tem faults, they still face some unnecessary difficul-
ties caused by the lack of messages that would con-
firm the results of action taken.
However, both systems fail more fundamentally at
strategic level. They do not possess any kind of ad-
visement to the user about the complexity of the tasks
and the best procedures to be carried out in order to
complete the tasks. All these problems besides the
lack of procedures to make the buttons available and
not available in a dynamic way, and the inappropri-
ate button labels, make the use of these systems very
difficult for the user under consideration.
As for future research recommendations, we sug-
gest to repeat this study for a larger range of tasks and
user system tests in order to validate the current re-
sults and complement the scenarios technique.
REFERENCES
Burrough, P. (1986). Principles of Geographical Informa-
tion Systems for Land Resources Assessment. Oxford
University Press.
Carrol, J. (1995). Scenario-Based Design: Envisioning
Work and Technology in System Development. Wiley.
ESRI (1996). Using ArcView GIS – The Geographic Infor-
mation Systems for Everyone. Environmental Systems
Research Institute.
INPE (2005). Spring Tutorial Class. Brazilian National
Institute for Space Research.
Norman, D. (1986). User Centered System Design.
New Perspectives on Human-Computer Interaction.
Lawrence Erlbaum Associates.
Prado, A., Baranauskas, M., and Medeiros, C. (2000).
Cartography and geographic information systems as
semiotic systems: a comparative analysis. In 8th ACM
Symposium on Advances in Geographic Information
Systems, pages 161–166.
Prates, R. and Barbosa, S. (2003). Avaliac¸
˜
ao de interfaces
de usu
´
ario: conceitos e m
´
etodos. In XXIII Congress
of the Brazilian Computer Society.
Schimiguel, J. and Baranauskas, M. (2002). Evaluating
signs in interfaces for geographic information sys-
tems. In Confer
ˆ
encia Ibero-Americana em Sistemas,
Cibern
´
etica e Inform
´
atica.
Seixas, M. and Souza, C. (2004). Um m
´
etodo de avaliac¸
˜
ao
para interfaces baseadas em mapas. In VI Brazilian
Symposium in Computing Systems, pages 159–170.
Silveira, M. (2002). Metacomunicac¸
˜
ao Designer-Usu
´
ario
na Interac¸
˜
ao Humano-Computador. PhD thesis,
Graduate Program in Computer Science, PUC-Rio,
Rio de Janeiro, Brazil.
Souza, C. (2005). The Semiotic Engineering of Human-
Computer Interaction. The MIT Press.
Winograd, T. (1996). Bringing Design to Software.ACM
Press.
ICEIS 2006 - HUMAN-COMPUTER INTERACTION
86
