
AN OPEN ARCHITECTURE FOR COLLABORATIVE
VISUALIZATION IN RICH MEDIA ENVIRONMENTS
Bernd Eßmann and Thorsten Hampel
Heinz Nixdorf Institute, University of Paderborn, Germany
F
¨
urstenallee 11, 33102 Paderborn
Frank Goetz
University of Paderborn
F
¨
urstenallee 11, 33102 Paderborn, Germany
Keywords:
Collaborative visualization, remote visualization, computer supported cooperative work, video streaming.
Abstract:
In this paper we present our approach of combining open and sophisticated technologies in order to establish an
integrated rich media environment for collaborative visualization processes. Aiming to support comprehensive
visualization settings of spatially separated domain specialists, we deploy remote render farms for producing
the visualization of complex datasets as video streams, separately for every collaboration partner. This makes
our system capable also for low-end mobile devices, which only have to be able to render MEPG-4 compliant
video streams. The cooperation support is provided by a full-featured CSCW system including a shared
whiteboard based on the platform independent Eclipse framework. The visualization objects are embedded in
the CSCW system’s persistent object space and presented by the rich media view of the shared whiteboard.
Starting with a basic scenario of collaborative visualization we will present the architecture of the combined
visualization and CSCW systems and the design of the plug-in based shared whiteboard.
1 INTRODUCTION
Today’s scientific communities are often distributed
over several continents, which is emphasized by glob-
alization. In cooperative research over long distances
the coordination of research processes becomes a ma-
jor challenge. This is especially true for research
communities of domain specialists exploring complex
datasets with the support of visualization techniques.
To identify the original incentive for the develop-
ment of a cooperative visualization system we have
to look at the past years. A few years ago the prin-
cipal purposes of visualization systems were only the
processing and the visual representation of complex
datasets, which were generated from simulations or
measurements. Analysis of the visualization and the
underlying data happened at the same graphics work-
station and at a distinguished spatial location.
Nowadays, groups of domain specialists (often sci-
entists) want to discuss and understand new geologi-
cal phenomena cooperatively while being situated all
over the globe. They want to access huge datasets
(e.g. measurements of a geographical phenomenon)
in real-time, independent from their actual where-
abouts. A local computer has to process the dataset
into a meaningful three-dimensional graphical rep-
resentation. This allows domain specialists to get
an overall understanding of the data. Additionally,
for a cooperative exploration of the data, the domain
specialists should be able to cooperatively navigate
through the three-dimensional scene, annotate points
of interest, or create snapshots of significant areas.
A common problem is that scientists have no ac-
cess to graphic-workstations for generating and ex-
ploring the data locally. Furthermore, the necessary
hardware is expensive and does not support the mobil-
ity of users. In contrast to these technical restraints,
the trend of globally available network connectivity
poses new potentials for solving this dilemma.
This paper presents our approach for real-time co-
operation based on synchronous remote visualizations
in a shared whiteboard application. Based on a sce-
nario of a cooperation of spatially separated scientists
(section 2), we present our conjunction of a Computer
Supported Cooperative Work (CSCW) system and a
remote visualization system by utilizing their open ar-
chitectures. We introduce a shared whiteboard client
based on the Eclipse framework embedding the vi-
sualization in an object-oriented manner (section 3).
The paper closes with a presentation of related work
and an outlook on future prospects.
27
Eßmann B., Hampel T. and Goetz F. (2006).
AN OPEN ARCHITECTURE FOR COLLABORATIVE VISUALIZATION IN RICH MEDIA ENVIRONMENTS.
In Proceedings of the Eighth International Conference on Enterprise Information Systems - SAIC, pages 27-34
DOI: 10.5220/0002458500270034
Copyright
c
SciTePress
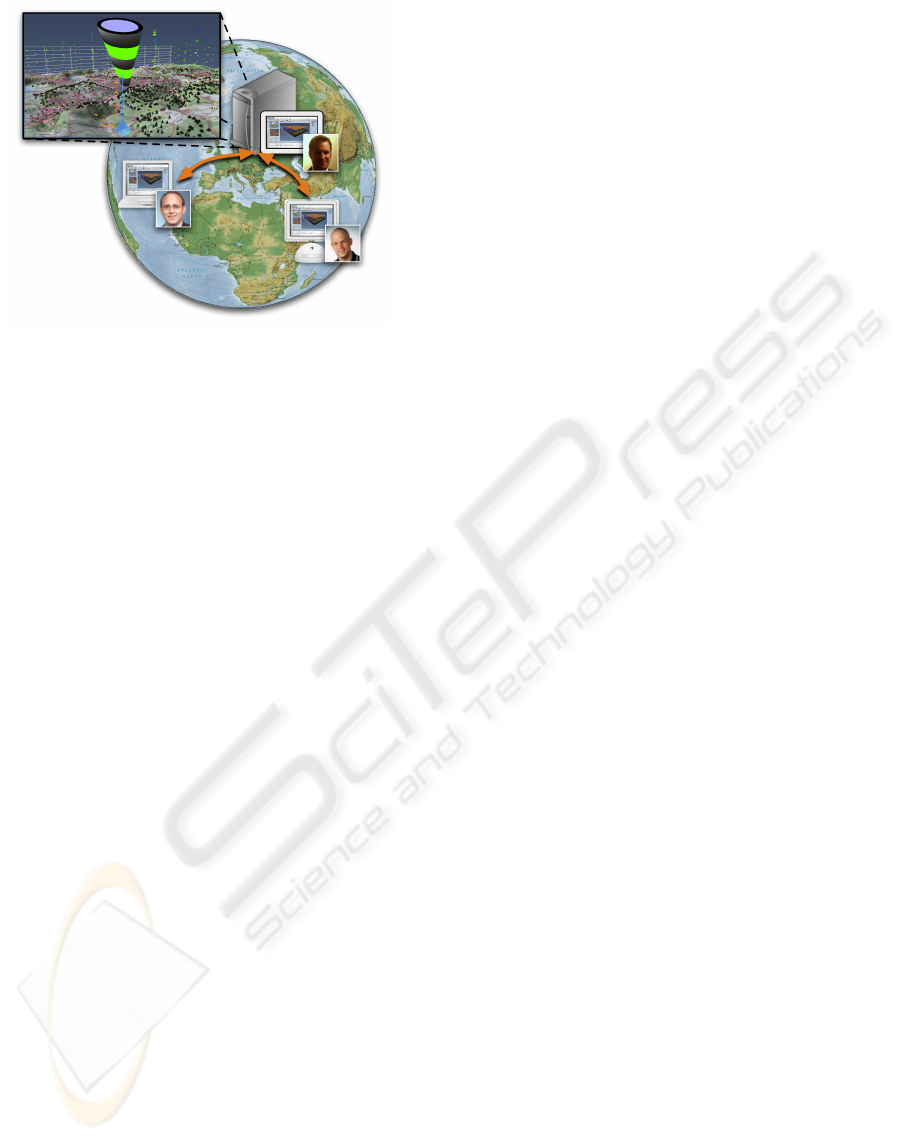
Figure 1: Domain specialists distributed over the globe
working on a shared visualization.
2 SCENARIO OF USE
Two spatial separated domain specialists (in our case
geologists) try to understand the same climate phe-
nomenon. Following the old fashioned way, the sci-
entists would have to communicate sequentially, ac-
cording to workflow specified earlier. This can be
realized e.g. by email. In the beginning, a visual-
ization expert processes the dataset into a meaningful
representation. Then, the resulting representation will
be delivered to the two geologists. Now, the repre-
sentation is analyzed and discussed by the geologists.
Additional enhancements will be made by a visual-
ization expert. Again, the geologists will discuss the
phenomena asynchronously via email. This proce-
dure will be repeated until the geologists are satisfied
with the results. Finally, the results have to be stored
and distributed to other scientists. As a final step the
scientists publish their results. They would have to
manually create a web page including the pictures, an-
notations and any meta-data. Overall this suspended
process is a very time consuming cooperation task.
Using our system the domain specialists and the
visualization expert work in one shared workspace
(see Figure 1). The workspace is presented within
a whiteboard, allowing graphical editing and anno-
tating of the embedded objects. All objects are per-
sistently stored on a CSCW server. Thus the repre-
sentation in the shared whiteboard is persistent. The
CSCW system is based on the metaphor of virtual
knowledge spaces allowing the scientists to cooper-
ate within a virtual room. A remote visualization sys-
tem renders a three-dimensional representation of the
dataset into an interactive object, created within the
room and therefore shown in the shared whiteboard.
This visualization object shows an interactive video
stream delivered by a visualization cluster. The vi-
sualization object is visible as an interactive picture
embedded in the shared workspace, which can be ma-
nipulated as any other object. Additionally, the visu-
alization object may be attached with control panels
for manipulating the visualization. These include a
navigation pane, a moderation pane, and a preference
pane.
It is possible to create snapshots from the actual
scene and store them in the shared workspace. Mea-
surements of single data entities within the dataset can
be selected and stored as a cooperation object. These
features help the domain specialists to exchange their
ideas while working with the representation. The ex-
change itself can be realized by storing interesting vi-
sual bookmarks to the scene and annotating them.
An embedded chat facility derived from the CSCW
system allows communication while cooperatively
exploring the visualization. Additionally, to coor-
dinate the exploration of the shared visualization,
users may use the moderation function, which al-
lows reserving timeslots for exclusive navigation in
the scene. The results of the visualization process
may be published on the fly in the form of a website at
any time of the process. For this purpose the CSCW
server generates a website containing the objects in
the shared workspace, e.g. the annotated screenshots.
On a reload, the website changes dynamically as a re-
sult of the changes in the whiteboard.
Because, the clients receive a video-stream instead
of the raw data, the security of the dataset against theft
and spying is enhanced. Furthermore, cooperation
based on confidential data can take place without the
need of sending raw data to the cooperation partner.
3 ARCHITECTURAL DESIGN
In our approach the collaborative functionality (user
and rights management, off-visualization annotation,
and structuring) is provided by the CSCW system
sTeam, while openVisaar provides the visualization
(for examples of visualization techniques refer to Fig-
ure 2). We now outline our concepts for the coopera-
tion in so-called virtual knowledge spaces and present
the symbiosis of both systems.
3.1 Embedding openVisaar in sTeam
Collaboration in Virtual Knowledge Spaces
sTeam is an open-source CSCW system developed
at the University of Paderborn (Hampel and Keil-
Slawik, 2002). It provides a variety of flexible mech-
anisms to foster communication and cooperation in
learning and work processes. sTeam’s concept of
virtual knowledge spaces combines synchronous and
ICEIS 2006 - SOFTWARE AGENTS AND INTERNET COMPUTING
28
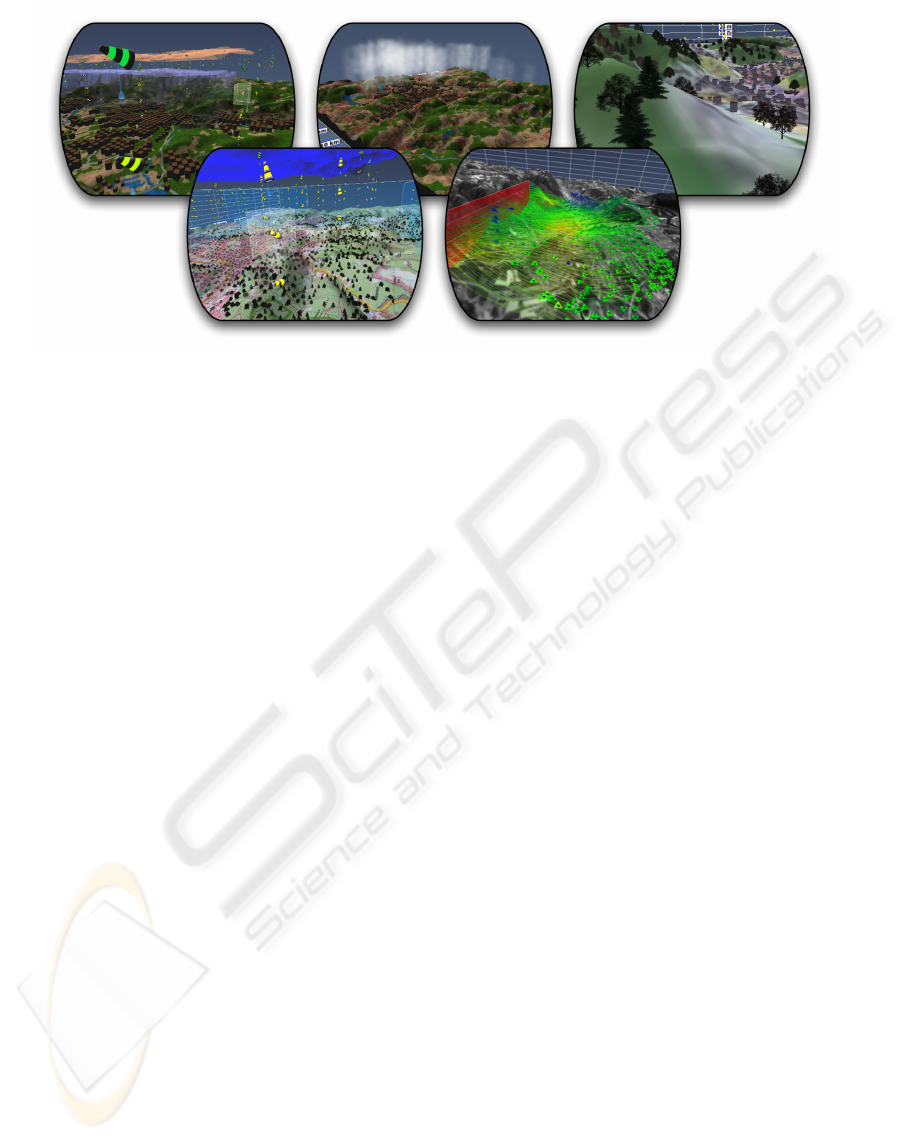
Figure 2: Some visualization techniques provided by openVisaar.
asynchronous forms of cooperation with hypermedia
document management in flexible ways.
A sTeam server consists of a persistent object
repository, which is stored in a relational database and
a core that manages the access of the cooperation ob-
jects. In case of a change clients will be notified by an
event system. This allows them to react to changes of
any object in the cooperation system directly. Rights
management for accessing contained objects is pro-
vided via Access Control Lists (ACLs), which allow
for flexible access right structures.
So far, sTeam provides no facilities for cooperative
visualizations. Because of its extendibility and flex-
ibility it was chosen as the CSCW basis for the ap-
proach presented in this paper.
Distributed Visualization with openVisaar
The novel visualization objects are embedded as a
video stream within the sTeam whiteboard client. The
remote rendering and video streaming is realized with
the openVisaar system (Goetz and Domik, 2003b).
openVisaar is an OpenSG based visualization frame-
work. Whereas, OpenSG is a portable scene graph
system for creating real-time graphics programs us-
ing OpenGL (Reiners et al., 2002). openVisaar can
multicast in real-time rendered three-dimensional vi-
sualizations as MPEG-4 video streams using the Real
Time Streaming Protocol (RTSP) (Goetz and Domik,
2003a). The whole visualization process is coordi-
nated by the openVisaar server.
openVisaar is divided into a server and a
client (Goetz and Domik, 2004). The server part con-
sists of a cluster, composed of powerful computers
equipped with up-to-date graphics accelerator boards,
and appropriate main memory. Whereas, the client
part is hosted on the users’ devices. These can be
standard PCs, laptops, or handhelds. The visualiza-
tion of the data itself is rendered in the same way
on all rendering nodes, but it is possible to choose
between different views or synchronized views. The
only requirements for the client computer are the abil-
ity to decode ISO-compliant MPEG-4 video streams
in real-time and Java support.
An openVisaar server consists of different services
that are executed on a cluster:
• SceneServer (openVisaar Server): Both, the Sce-
neServer and SceneRenderer use OpenSG for their
scene graph management and rendering. The
OpenSG data structures are set up in a way that
allows multiple independent threads to manipulate
the scene graph independently without interfering
with each other. This feature allows for synchro-
nizing the manipulations of each user with the ma-
nipulations of other users. Finally, every user of
the collaborative working community gets the same
view on the current dataset.
• SceneRenderer (Render Node): Every SceneRen-
derer contains a replicated scene graph that will be
regularly harmonized with the scene graph of the
SceneServer. Every modification by other users is
displayed immediately. One SceneRenderer exists
for every remote client. The SceneRenderer gener-
ates an individual view of the shared visualization
scene and sends a video stream using RTSP (Real
Time Streaming Protocol) to the remote client.
Symbiosis of sTeam and openVisaar
In sTeam’s virtual knowledge space the visualization
objects are treated as any other cooperation object.
With the appropriate view component the web in-
terface as well as the synchronous whiteboard client
are able to present the visualization object as a video
AN OPEN ARCHITECTURE FOR COLLABORATIVE VISUALIZATION IN RICH MEDIA ENVIRONMENTS
29
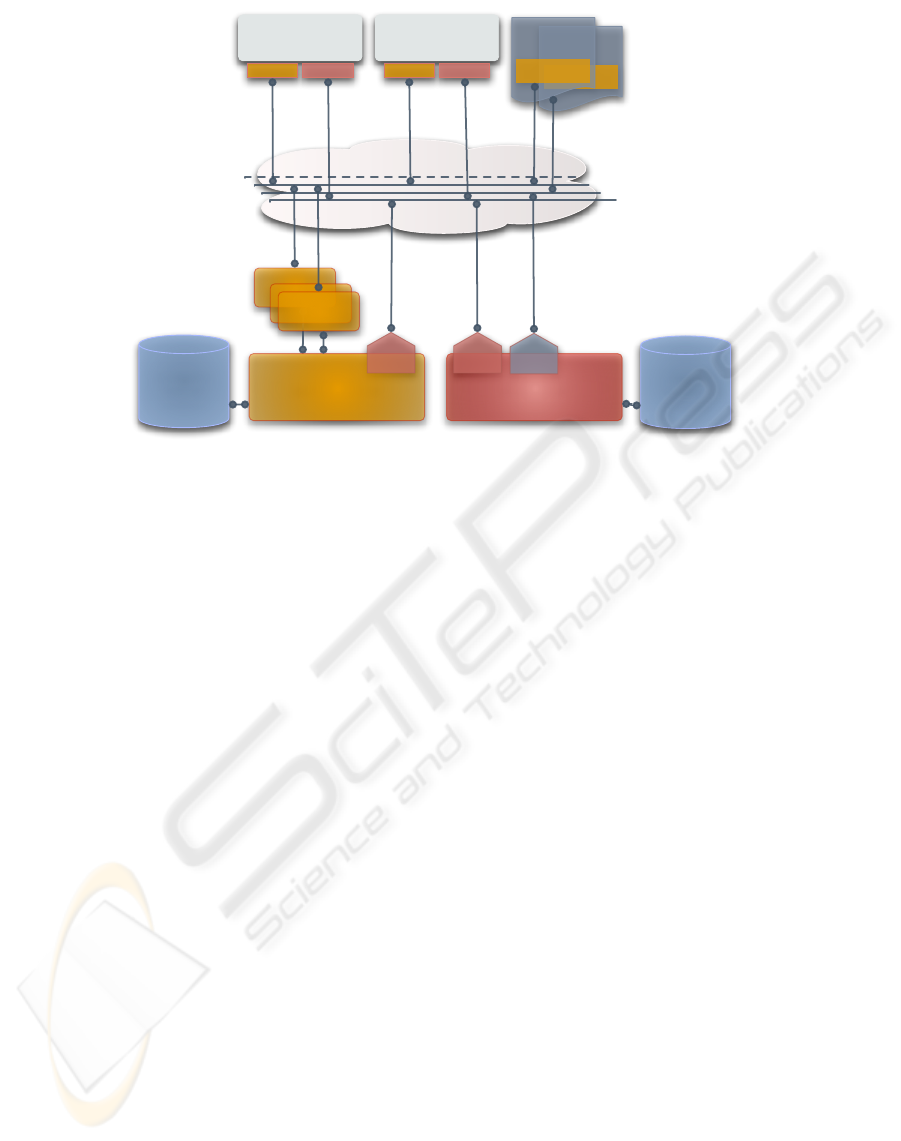
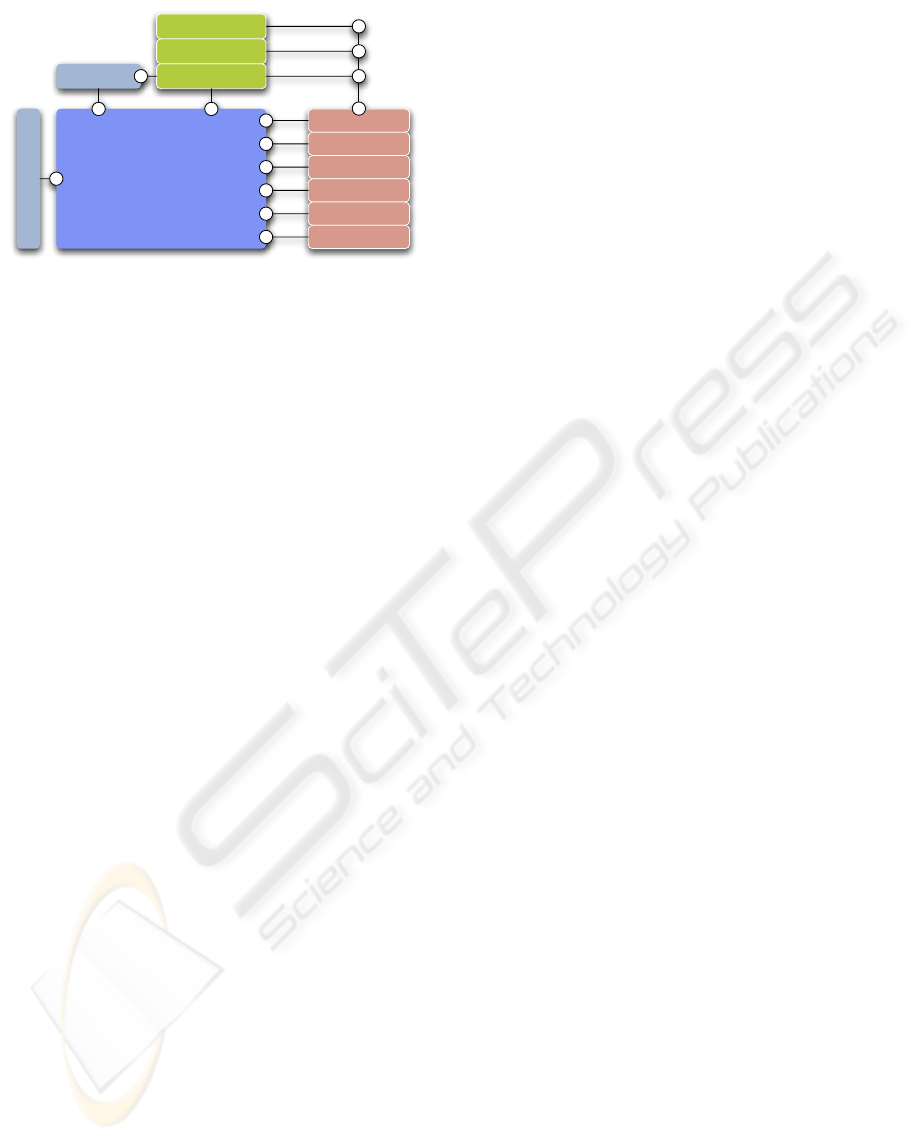
WhiteboardNG
COALMPEG4
sTeam Server
object
repository
database
WhiteboardNG
COALMPEG4
...
Render Node
openVisaar Server
COAL
visualization
data set
database
Internet
COAL
HTTP
MPEG4
Plugin
Web Browser
Figure 3: Architecture of the integrative cooperative visualization system.
stream. The controls for manipulating the visual-
ization scene on the openVisaar server are provided
as plug-ins additionally. Every running visualization
video plug-in in combination with its controls is reg-
istered as one conventional client by the openVisaar
server.
To coordinate both systems, the openVisaar server
connects to the sTeam server as a common synchro-
nous CSCW client using sTeam’s proprietary COAL
protocol. Only one connection is established for all
visualization clients. This helps to save bandwidth
and communication overhead. The openVisaar server
organizes the distribution of the visualization repre-
sentations by managing render nodes. These send the
resulting video streams to the client objects embedded
in the sTeam system. Figure 3 shows an overview of
the complete architecture of the combined systems.
3.2 Next Generation Whiteboard
with Visualization Capabilities
WhiteboardNG is a standalone application for access-
ing the cooperative groupware and learning platform
sTeam. As a native application the whiteboard al-
lows forms of synchronous teaching (Hampel and
Keil-Slawik, 2002) and offers improved interaction
possibilities compared to pure HTML-based applica-
tions (Hampel and Eßmann, 2003). The main goal
of the whiteboard is supplying an interactive and
graphical view on the content of (areas in the) vir-
tual knowledge spaces hosted on the sTeam server.
Figure 4 shows the WhiteboardNG with its most im-
portant components. In the whiteboard area, objects
like documents, collections, references, a trashcan
etc. are displayed. Users can place and manipu-
late these objects individually within this area by us-
ing their mouse following the well-known workspace
metaphor. Furthermore, objects can be annotated and
spatially grouped by using graphical primitives such
as rectangles, circles, arrows, lines etc.
New documents can be generated with the toolbar
or they can be moved directly using the local file sys-
tem (drag & drop in the workspace). In this way doc-
uments are persistently stored on the sTeam server.
Other parts of the User Interface (UI) are an out-
line view of available objects, a miniature view of the
workspace, and a user list for mutual awareness of
other users in the current area.
While a former implementation of the whiteboard
application based on SUN’s Swing framework, the
novel WhiteboardNG is based on Eclipse and uses
parts of the Eclipse Rich Client Platform (RCP). The
sTeam clients functionality is realized by different
plug-ins, which together form the entire application.
Additionally to the different components of the
Eclipse platform the WhiteboardNG uses functional-
ity of the Graphical Editor Framework (GEF) and the
Eclipse Modeling Framework (EMF) (Moore et al.,
2004). GEF provides methods and interfaces for de-
veloping graphical editors and EMF is a framework
for modelling and managing complex data structures.
Here, EMF is used for handling a proxy model of the
sTeam server’s data within the whiteboard. In addi-
ICEIS 2006 - SOFTWARE AGENTS AND INTERNET COMPUTING
30
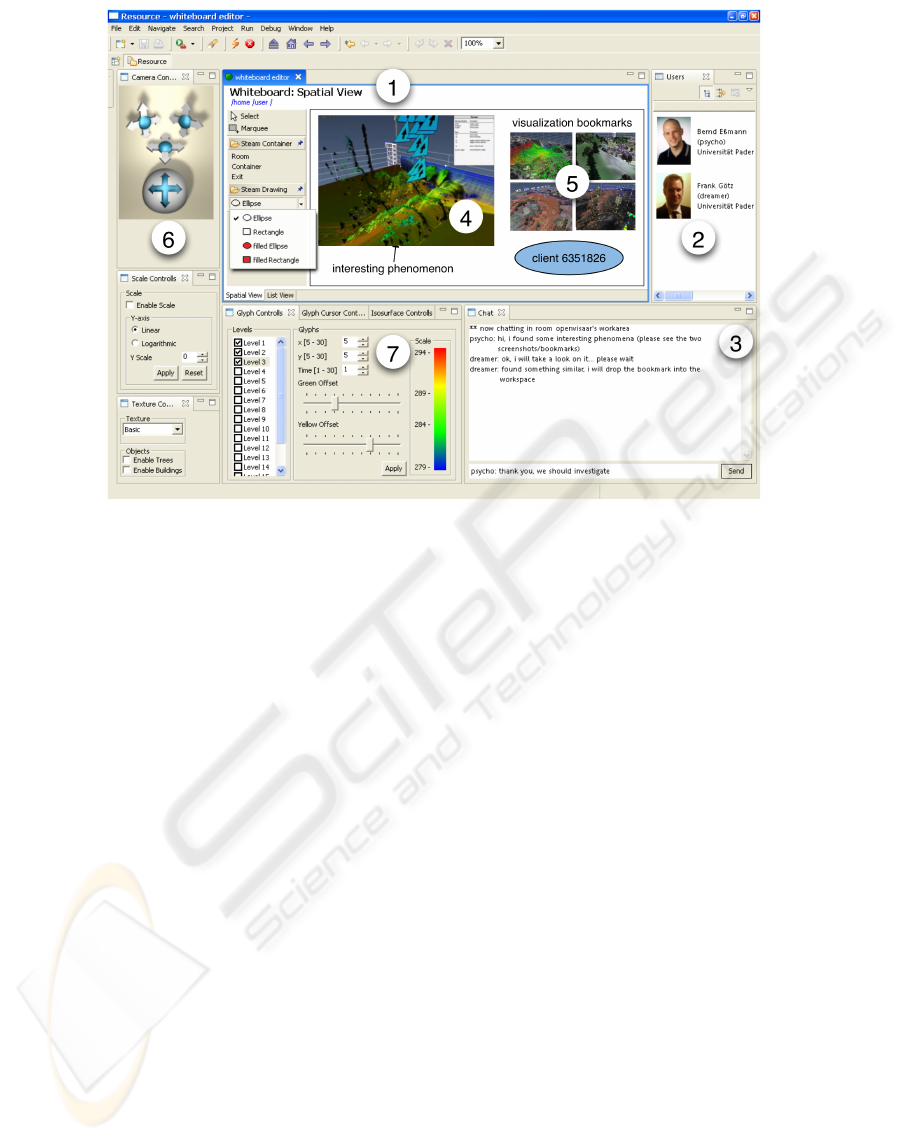
Figure 4: The WhiteboardNG with its standard components whiteboard view (1), user view (2), and chat (3), extended with the
new visualization plugins (visualization object (4), visualization bookmark objects (5), navigation control (6) and visualization
preferences (7)).
tion to these two components, WhiteboardNG con-
sists of several plug-ins, which make sTeam’s specific
features available. Three specific components are of
special importance in extending the WhiteboardNG
with new functionality:
• Whiteboard.RCP: This plug-in extends basis com-
ponents of the Eclipse RCP, in order to build a
WhiteboardNG executable as an independent ap-
plication. Therefore, in addition to the actual de-
finition, product configuration, compilation of all
plug-ins (used by the application), optical adjust-
ments of icons, pictures and texts in information
boxes are necessary. In the Eclipse jargon this
process is called Branding. We use this component
to generate a modified visualization edition of the
whiteboard.
• Whiteboard.Core: This plug-in provides all non-
visual kernel functions of the whiteboard. Among
other things, the central classes ModelManager and
ConnectionManager are part of this plug-in. For
the integration of the visualization, specific core
plug-ins provide access to both server systems.
• Whiteboard.UI.Editor: This plug-in implements
(utilizing the GEF plug-in) the graphical editor
with which a user can access and work interactively
in a sTeam area. This plug-in has a special role
within the whiteboard; it offers its own extension-
point. With this extension-point third party devel-
opers have the possibility to implement own ex-
tensions for the editor of the whiteboard. These
extensions are called edit-parts. An edit-part is
the graphical representation of an object within a
sTeam area.
The visualization object is implemented as such an
edit-part displaying the video stream provided by
the openVisaar render nodes and providing a direct
interaction with the visualization scene. Similar
handlers exists for pictures, text documents, fold-
ers, lines, rectangles, arrows, etc.
The novel visualization component extends the ex-
isting whiteboard component of the WhiteboardNG
(see Figure 5) with the functionality to display and
control the visualization scene provided by the open-
Visaar server. At the same time, it enables the white-
board to handle visualization objects like any other
sTeam object in the knowledge space. This approach
allows a seamless integration of cooperative visual-
ization objects in the existing cooperation environ-
ment.
Platform Independent MPEG-4 Video Integration
For video streaming enabling visualization on the
whiteboard, we chose the MPEG-4 standard (Koe-
nen, 2002) which is also used by the conventional
AN OPEN ARCHITECTURE FOR COLLABORATIVE VISUALIZATION IN RICH MEDIA ENVIRONMENTS
31
Eclipse Plattform
MPEG-4 Plugin
Whiteboard.UI.Editor
Whiteboard.UI
Whiteboard.Model
Whiteboard.Core
sTeam.API
Whiteboard.RCP
EMF
GEF
openVisaarControl
openVisaarNavigation
Figure 5: The architecture of the Eclipse-based White-
boardNG extended with the novel visualization plug-in.
openVisaar client. MPEG-4 (an extension of the
MPEG-2 technology) is an ISO standard combin-
ing high-quality video streaming with minimal data
rates. We use H.264 encoding, also known as MPEG-
4 part 10, because it contains a number of new fea-
tures that enable much more effective video compres-
sion and provides more flexibility for applications in
a wide variety of network environments (Neve et al.,
2004). As an open industry standard, anyone can
create an MPEG-4 player or encoder. openVisaar
uses the open source codec XviD for the encoding of
video stream and the open source MPEG4IP stream-
ing server called MP4Live (Mackie, 2002) for stream-
ing to the clients. On the client side, the video is
seamlessly integrated in the sTeam whiteboard as a
Java and GEF component avoiding media discontinu-
ities in the cooperation process and allowing direct
interaction with the visualization scene.
The standalone version of the openVisaar client
uses Apple Quick Time SDK (Apple Computer, 2005)
for integrating video streaming into the client’s user
interface. Apple’s Quick Time SDK provides good
support for high quality MPEG-4 decoding with low
CPU usage, but it is based on platform dependent run-
time libraries. It was chosen, because Sun’s Java
Media Framework platform for independent video
streaming lacks support for efficient streaming pro-
tocols like MPEG-4.
In our new approach the IBM Toolkit for MPEG-
4 (IBM alphaworks, 2005) fills this gap. It is based on
pure Java code and is therefore platform independent.
Plus, it provides decoding facilities fast enough for
our purposes. The drawback is the missing support of
off-screen rendering, which is necessary to nest video
streaming into GEF components. This leads to the
problem that in addition to the video, rendered into
GEF components, there is always a source window
providing the decoded picture. While no other solu-
tion is available at the moment, this window is moved
to the background or minimized after creation. Addi-
tionally, Quick Time stays integrated as an alternative
rendering technique.
The Multimedia Content Description Interface
Our approach stores the metadata in two separate
places: The visualization storage contains the data the
visualization is based on (the scene graph managed by
the openVisaar SceneServer); the cooperation stor-
age contains all data that is related to the collabora-
tion process. The distinction is based on the premise
that the first one stores object data, provided by mea-
surement and monitoring; the second one stores an-
notations in the form of analysis, additional an related
data, partly subjective and cross media, which can be
attributed to specific subjects,ma and persons.
The cooperation storage must therefor be capable
to keep the annotation data that is created during the
collaborative process. On a sTeam based system, this
data will be stored as a sTeam object. To increase in-
terchangeability with other systems and to provide an
easy export of sequences as video in conjunction with
all relevant annotation data we chose MPEG-7 (Mar-
tinez, 2002) for storing the annotations. The Multi-
media Content Description Interface MPEG-7 is an
XML based standard for describing multimedia con-
tent developed by the Moving Pictures Experts Group
(MPEG). It consists of a set of description schemes
and descriptors to define metadata elements and their
relationships. Because MPEG-7 descriptions do not
depend on the way the described content is encoded
or stored, it provides a universal annotation approach
for all types of media to facilitate searching, indexing,
filtering, and access. For our purpose, MPEG-7 fea-
tures will be used for storing the metadata generated
by annotations of snapshots or sequences that where
previously created from the visualization scene.
Adaptations to the openVisaar Client
The openVisaar client was originally implemented as
a standalone client, using Sun’s Swing components
to provide the user interface. First, the user inter-
face had to be adapted to the Eclipse Standard Widget
Toolkit (SWT). Here, the separation of the user inter-
face code and the functional code in the openVisaar
client application proved useful. A redesign of some
parts containing the code for managing connections to
the openVisaar server and handling remote events was
necessary, too. These parts supported one-to-one con-
nections only, as the client operated in a Single Docu-
ment Interface (SDI) like manner. In conjunction with
sTeam, one workspace may contain multiple open-
Visaar objects. Therefore multiple connections based
on the same environment must be supported. Finally,
we used the extension-point mechanism of the White-
board.UI.Editor to extend the WhiteboardNG with a
new edit-part for displaying the visualization. A new
ICEIS 2006 - SOFTWARE AGENTS AND INTERNET COMPUTING
32

edit-part handles the graphical representation of our
openVisaar based visualization object within a sTeam
area.
4 RELATED WORK
Existing annotation systems for video annotation pro-
vide capabilities only for persistent media and within
environments where annotations are shared asynchro-
nously. These tools concentrate on functionalities and
features aiding the semantic labeling of video data-
bases to organize authoring processes and assist in
searches or analyses of specific snapshots.
The E-Chalk Tool (Friedland et al., 2004), al-
lows users to perform collaborative work on a vir-
tual blackboard. In a typical setting, a lecture or
meeting room is equipped with a projection system,
a touch sensitive whiteboard or a digitizer tablet, and
a computer with an internet connection. The E-Chalk
server transmits all written data to the virtual black-
board. Audio comments and video of the lecture
room are sent via internet connection to remote par-
ticipants. Only a Java compatible browser is needed
to receive the audio, video, and the board image pre-
viously recorded. However, E-Chalk does not allow
clients manipulating or presenting own content during
a session. It also does not support even basic collab-
orative functions as found in environments like Mi-
crosoft’s NetMeeting, where users can communicate
by chat or voice, while working on the same media
content in real time.
Like E-Chalk, IMC’s Lecturnity tool (Mueller and
Ottmann, 2000) offers the possibility of present-
ing multimedia content for meetings, e-learning, e-
manuals, and software training. Therefore it supports
synchronous recording of audio and video in combi-
nation with screen-grabbing and annotation features.
Based on PowerPoint presentations or running ap-
plications as a showcase, all mouse movements and
clicks are recorded. Once the recording is finished,
the author can edit and optimize the content. After
a presentation is arranged in structured learning mod-
ules, it can be published on a CD-ROM or in the world
wide web. The architecture of Lecturnity focuses on
the fast creation and easy publishing of presentations,
but like the E-Chalk tool lacks any functionality for
collaborative work.
Despite their missing features for cooperation pur-
poses, the presented annotating systems allow record-
ing of freehand drawings and replaying them. The
way they link annotations to video material is always
based on time stamps and overlay positions in the
video stream, because the source for the video ma-
terial is no longer editable once recorded. This is
different in remote visualization systems, where the
source data is computed on the visualization servers
on the fly. This method allows linking annotations di-
rectly to primitives of the scene that is rendered into
the video stream. Finally, we want to look at some
cooperative visualization systems.
OpenGL Vizserver from SGI (Silicon Graphics,
2005) is a commercial client-server system. It is de-
signed to deliver visualization and collaboration func-
tionality to any client, whether on a desktop work-
station or a wireless handheld computer. OpenGL
Vizserver allows users to remotely view and interact
with large datasets from any other system at any loca-
tion within an organization in a cooperative manner.
The CoVis (learning through collaborative visual-
ization) project was finished 1998 at the Northwest-
ern University. A principal purpose of the project is
the use of new technologies for the extension and im-
provement of the learning process. The visualization
tools can be started from the network, but deliver no
direct mechanisms for collaborative work. Regarding
the paradigms of virtual knowledge spaces it lacks
flexible and expandable structures for the coopera-
tion process. Since CoVis consists of a collection of
individual tools, media discontinuities evolve by the
missing integration of individual applications (Rama-
murthy et al., 1995).
Habanero, which was developed at the Software
Development Division at the National Center for Su-
percomputing Applications (NCSA), offers a Java-
based framework(-architecture) for the production of
cooperative environments. Habanero is session and
tool oriented and offers tools like a whiteboard, tel-
net, or an audio chat. Because of a missing concept
for integrating the tools into a common cooperation
environment, data exchanges between them are not
possible out of the box. This is a major disadvantage
for flexible cooperation settings (Chabert et al., 1998).
Generally speaking, the presented cooperative
visualization systems deliver interesting solutions
for some aspects of the collaborative visualization
process. In our opinion, however with regards to
a flexible concept of cooperation support, virtual
knowledge spaces are the most promising concept for
the desired cooperative visualization environment.
5 OUTLOOK
By combining the visualization system openVisaar
with the CSCW system sTeam, new ways of analyz-
ing and discussing complex visualizations in teams
evolve. While openVisaar provides sophisticated vi-
sualization techniques presenting all relevant data to
the participants adequately, sTeam serves as a plat-
form supporting the overall collaboration process.
One key element of sTeam is the shared whiteboard,
AN OPEN ARCHITECTURE FOR COLLABORATIVE VISUALIZATION IN RICH MEDIA ENVIRONMENTS
33
allowing synchronous cooperative work in a graph-
ical manner. Different media types are represented
by graphical objects generated, grouped, or generally
structured during the collaborative process.
The seamless integration of openVisaar into sTeam
enables users to collaboratively browse, discuss, an-
notate, and publish results, even when working at dif-
ferent locations over long distances. Contrary to other
media types (e.g. text documents, pictures, or pre-
rendered videos), openVisaar generates volatile con-
tent by delivering real-time generated and streamed
ISO-compliant MPEG-4 video. Although, sTeam
supports tools for collaborative work on the above-
mentioned immutable media types. These are inap-
plicable in several cases: when the lifetime of me-
dia is limited to the actual session, where its creation
and representation is based on specific parameters,
and where knowledge is gained from the media by
comparison of content changes, rather than concrete
states.
The communication between the openVisaar server
and sTeam is based on a simple, but proprietary pro-
tocol. Future switching to a protocol like SOAP might
open the involved systems even more to other sys-
tems.
Concluding, the solution presented in this paper
surely outlines the benefits and synergy effects gained
by combining open systems in order to create novel
and highly integrated forms of collaboration in rich
media environments.
ACKNOWLEDGEMENTS
Bernd Eßmann is a participant in the Heinz Nixdorf
Institute’s postgraduate program ”Automatic Config-
uration in Open Systems” funded by the German Re-
search Foundation (DFG).
REFERENCES
Apple Computer, I. (2005). Quick Time for Java,
http://developer.apple.com/. Apple Computer, Inc.
Chabert, A., Grossman, E., Jackson, K., and Pietrovicz, S.
(1998). Ncsa habanero - synchronous collaborative
framework and environment. In White Paper, Software
Development Division at the National Center for Su-
percomputing Applications.
Friedland, G., Knipping, L., Schulte, J., and Tapia, E.
(2004). E-chalk: A lecture recording system using
the chalkboard metaphor. Journal of Interactive Tech-
nology and Smart Education, 1(1):9–20.
Goetz, F. and Domik, G. (2003a). A framework for
video-based and hardware-accelerated remote 3d-
visualization. In Proceedings of the Eurographics
2003 Short Presentations, pages 263–269.
Goetz, F. and Domik, G. (2003b). Remote and collabora-
tive visualization with openvisaar. In Proceedings of
the 3rd IASTED International Conference on Visual-
ization, Imaging, and Image Processing, pages 902–
907.
Goetz, F. and Domik, G. (2004). openvisaar - enriching co-
operative visualization by combining open technolo-
gies. In Proceedings of the 1st International Confer-
ence on Cooperative Design, Visualization, and Engi-
neering, pages 38–46.
Hampel, T. and Eßmann, B. (2003). Self-administered co-
operative knowledge areas - evaluation of the www in-
terface in terms of software ergonomics. In Proceed-
ings of the HCI International 2003, pages 729–733.
Hampel, T. and Keil-Slawik, R. (2002). steam: Struc-
turing information in a team - distributed knowledge
management in cooperative learning environments.
ACM Journal of Educational Resources in Comput-
ing, 1(2):1–27.
IBM alphaworks, G. (2005). IBM Toolkit for MPEG-4,
http://www.alphaworks.ibm.com/. IBM alphaworks.
Koenen, R. (2002). Mpeg-4 overview. In ISO/IEC
JTC1/SC29/WG11 N4668.
Mackie, D. (2002). Streaming video and mpeg4ip. In
Presentation of MPEG4IP at the Silicon Valley Linux
User’s Group, Cisco Technology Center, Silicon Val-
ley, USA.
Martinez, J. M. (2002). Mpeg-7 overview. In ISO/IEC
JTC1/SC29/WG11 N4980.
Moore, W., Dean, D., Gerber, A., Wagenknecht, G., and
Vanderheyden, P. (2004). Eclipse Development us-
ing the Graphical Editing Framework and the Eclipse
Modeling Framework. IBM Press.
Mueller, R. and Ottmann, T. (2000). The authoring on
the fly system for automated recording and replay of
(tele)presentations. Multimedia Systems, 3(8):158–
176.
Neve, W. D., Lambert, P., Sam Lerouge, S., and de Walle,
R. V. (2004). Assessment of the compression effi-
ciency of the mpeg-4 avc specification. In Proceed-
ings of SPIE/Electronic Imaging 2004, volume 5308,
pages 1082–1093.
Ramamurthy, R. K. B., Wilhelmson, R., Pea, R., Gomez,
L. M., and Edelson, D. C. (1995). Covis: A national
science education collaboratory. In Proceedings of the
American Meteorological Society 4th Conference on
Education joint with the 11th Conference on Interac-
tive Information and Processing Systems for Meteo-
rology, Oceanography, and Hydrology, pages 15–20.
Reiners, D., Voss, G., and Behr, J. (2002). Opensg - basic
concepts. In Proceedings of the 1st OpenSG Sympo-
sium.
Silicon Graphics , I. (2005). OpenGL Vizserver 3.1:
Application-Transparent R emote Interactive Visual-
ization and Collaboration, Technical White Paper,
http://www.sgi.com. Silicon Graphics Inc.
ICEIS 2006 - SOFTWARE AGENTS AND INTERNET COMPUTING
34
