
RELIABLE PERFORMANCE DATA COLLECTION FOR
STREAMING MEDIA SERVICES
Beomjoo Seo
University of Southern California
Los Angeles, CA
Michelle Covell, Mirjana Spasojevic, Sumit Roy
Hewlett–Packard Laboratories
Palo Alto, CA
Roger Zimmermann
University of Southern California
Los Angeles, CA
Leonidas Kontothanassis, Nina Bhatti
Hewlett–Packard Laboratories
Palo Alto, CA
Keywords:
Media servers, workload modeling, performance characterization.
Abstract:
The recent proliferation of streaming media systems in both wired and wireless networks challenges the net-
work operators to provide cost-effective streaming solutions that maximize the usage of their infrastructure
while maintaining adequate service quality. Some of these goals conflict and motivate the development of pre-
cise and accurate models that predict the system states under extremely diverse workloads on-the-fly. However,
many earlier studies have derived models and subsequent simulations that are well-suited only for a controlled
environment, and hence explain a limited sets of behavioral singularities observed from software component
profiles. In this study, we describe a systematic performance evaluation methodology for streaming media
systems that starts with the reliable collection of performance data, presents a mechanism to calibrate the data
for later use during the modeling phase, and finally examines the prediction power and the limitations of the
calibrated data itself. We validate our method with two widely used streaming media systems and the results
indicate an excellent match of the modelled data with the actual system measurements.
1 INTRODUCTION
The recent developments in media compression tech-
nologies such as MPEG-4 and the tremendous growth
in available end-user network bandwidth in combina-
tion with infrastructure-level services such as Content
Delivery Networks (CDN) has made streaming me-
dia an ubiquitous web application. As streaming me-
dia becomes an increasingly important part of the data
traffic, there is a growing need to characterize server
behavior and to understand the end-user experience in
order to minimize costs and make the best use of the
server infrastructure.
Traditionally, server performance has been ob-
served by examining simple metrics such as CPU,
disk, and network utilization. However, such singu-
lar metrics do not capture the complex interdepen-
dence of resources and may result in either under- or
over-provisioning of the infrastructure. In this study,
we propose a systematic and exhaustive methodology
for evaluating the performance of streaming media
servers, utilizing both server and client-side measure-
ments under a wide range of workloads. Figure 1 il-
lustrates our multi-stage streaming server characteri-
zation process that aims to predict the current server
load on-the-fly.
The characterization process consists of three main
phases with a total of seven sub-steps. The goal of the
data collection (Fig. 1 A.) phase is to collect mean-
ingful, usable performance data. It consists of three
procedural steps: 1. identifying a set of disjoint work-
loads (we call these pure workloads), 2. measuring the
server capacity for each pure workload, and 3. cal-
ibrating the performance statistics. The first step –
the workload selection (Fig. 1 A.1.) – is a design
process to define a set of disjoint workloads with pre-
cise properties aimed at providing a significant sam-
pling of the workload space. The proper choice of
124
Timmerman M. (2006).
BUSINESS PROCESS EMBEDDED INFORMATION SYSTEMS - For Flexibility and Adaptability.
In Proceedings of the Eighth International Conference on Enterprise Information Systems - DISI, pages 124-129
DOI: 10.5220/0002462601240129
Copyright
c
SciTePress

1. Workload Selection
2. Server Capacity Decision
3. Data Calibration
4. Calibration Data Analysis
6. Model Validation
7. Capacity Planning
5. Resource Usage Modeling
A. Data Collection
B. Modeling
C. Admission Control
PHASES
STEPS
Figure 1: Procedural methodology to characterize stream-
ing media servers.
non-overlapping workloads provides relevant result
information while reducing the scope of the extensive
experiments and their evaluations during the second
step. The second step, the server capacity decision
(Fig. 1 A.2.), is crucial in that it defines the maxi-
mum number of concurrent streaming sessions that
can be admitted to the system with acceptable service
quality. We term this maximum the server capacity
or saturation point. The complex interactions of the
components and resources in a large streaming me-
dia system introduce statistical variations that result in
non-deterministic service failures near the saturation
point. Hence, we adopt a rigorous saturation decision
model that iterates until the experimental results pro-
vide a reproducible decision for each pure workload.
Given the server capacity decisions, the last step, the
data calibration (Fig. 1 A.3.), collects resource us-
age profiles, associating the measurement data and the
different loads.
After the data collection phase, a careful analysis of
the calibrated data identifies which client and server
resources are the dominating factors that contribute to
the measured system saturation (Fig. 1 B.). In a final
phase, the resource usage model may provide the ba-
sis for off–line capacity planning or even for online
admission control (Fig. 1 C.). Although we do not
present the modeling aspects of our work here due to
space limitations, our mathematical model that com-
bines a large number of measurements predicts the
server saturation state very accurately, thus being ca-
pable of playing an important role as a server capacity
planning tool in server-clustered networks where mul-
tiple streaming servers cooperate to support a massive
number of concurrent users. A more detailed descrip-
tion of this model is contained in (Covell et al., 2005).
In this paper, we focus on the evaluation method-
ology of the first phase and its two steps: workload
selection and server capacity decision. The rest of
Table 1: Pure workload matrix and its naming convention.
Popular Unpopular
High Rate Low Rate High Rate Low Rate
VoD VPH VPL VUH VUL
Live LPH LPL LUH LUL
this paper is organized as follows. Section 2 de-
scribes our performance data evaluation methodol-
ogy. In Section 3 we validate our methodology by
extensively measuring the performance of an indus-
try standard server with the proposed comprehensive
workload evaluation matrix. Section 4 presents the
related work. Finally, we conclude and present ideas
for future work in Section 5.
2 METHODOLOGY
This section presents the evaluation methodology
used in our data collection phase. Section 2.1 de-
scribes the types of client workloads on which we cal-
ibrate. In Section 2.2, we define the notion of service
failures and explain the decision criteria for server sat-
uration.
2.1 Workload Selection
Our approach for choosing a set of workloads for our
benchmark experiments and evaluations is to repre-
sent the complex and large streaming workload space
with a number of non-overlapping sets, so-called pure
workloads. To narrow the evaluation scope to a prac-
tical number of experiments and still maintain the
rich expressiveness of a general workload, we clas-
sify the pure workloads along three dimensions: (1)
the source location of requested content, (2) the ac-
cess popularity, and (3) the content encoding rate. De-
tails of each dimension are described in (Spasojevic
et al., 2005). The two selections along each of the
three workload dimension produces a total of 2
3
=8
pure workloads. Table 1 summarizes these conven-
tions.
2.2 Server Capacity Decision
When approaching overload, a server might start to
perform erratically. Such failures are, however, apt
to occur even at lower loads before entering the over-
load region due to random operational spikes. Thus,
a consistent and reproducible determination of the
maximum number of concurrent streaming sessions
(the server capacity for short) per pure workload be-
comes very challenging from observing the server sta-
tistics. For the server capacity decision, we examine
the performance data collected from the server and
the clients.
RELIABLE PERFORMANCE DATA COLLECTION FOR STREAMING MEDIA SERVICES
125

2.2.1 Client Logging
We have developed a light–weight client applica-
tion that requests an RTP (Schulzrinne et al., 1996)
stream from a media server, accepts RTP packets,
and records session-level statistics. In addition, it can
record a trace of every RTP/RTCP packet (packet ar-
rival time, size, sequence number, and the media de-
code time).
Every experiment runs two types of client applica-
tions: loading clients and probing clients. A load-
ing client is a long-lived session that exercises the
server at the level of concurrent requests. To sup-
port a large number of simultaneous loading clients,
it only records session-level statistics. The probing
client is a short-lived session that is issued consecu-
tively to collect detailed session statistics after an ex-
periment launches all the loading clients and reaches
steady state. It records both session-level statistics
and a trace of the delivered data packets.
From the trace, we can also derive the number
of rebuffering events, which is the number of late-
arriving packets observed from the probing session.
Late-arriving packets are computed from the packet-
arrival offset, the difference between each packet de-
livery time and its deadline. The detection of rebuffer-
ing events was, however, often problematic due to in-
creasingly bursty packet transmissions as the server
workload increased. The timing of these bursts was
such that, on occasion one or two packets would be
delayed beyond their delivery deadline. This small
amount of over-delayed data resulted in rebuffering
violations on those experiments, even when the server
was otherwise not saturated. We found that, by re-
categorizing these few packets as being lost data (in-
stead of late data), we could avoid a rebuffering vio-
lation without inducing a size violation. This greatly
improved the reliability and reproducibility of our de-
cision surface.
2.2.2 Session Failure and Server Capacity
Decision
If the server system is overloaded, a newly delivered
streaming request may be either rejected or admitted
but experience degraded session quality. Among ses-
sion failures, some can be detected from error log
files easily (hard failure), while others need further
processing (soft failure). Admission rejection and ex-
plicit session termination in the middle are hard fail-
ures.
Soft failure is a general term that describes an unac-
ceptable user streaming experience of a session. Du-
ration violations, size violations, and rebuffering vio-
lations belong to this category. These are defined as
follows:
• Duration Violation: Any session that satisfies the
following inequality condition |
T (s)
T
s
− 1| >ρ
T
is
considered to violate the duration requirement. T
s
is the expected duration of session s, T (s) is its
measured duration, and ρ
T
(0 <ρ
T
< 1) is the
acceptable range of the duration.
• Size Violation: Any session that satisfies that fol-
lowing inequality condition 1 −
B(s)
B
s
>ρ
B
, where
B(s) <B
s
, is considered to violate the session
length requirement. B
s
is the expected amount of
data bytes received at the client side for session s,
B(s) is its measured size, and ρ
B
(0 <ρ
B
< 1) is
the acceptable range of the bitstream length.
• Rebuffering Violation: Any experiment which
has N number of individual probing statis-
tics and satisfies following inequality condition
N
s
{I(s)+P ·R(s)}
N
s
T
s
>ρ
Q
is considered to violate the
desired service quality. I(s) is the start-up delay of
the measured session s, R(s) is the sum of time pe-
riods when the session s was in a rebuffering state,
P is the penalty constant assigned per rebuffering
event, and ρ
Q
(0 <ρ
Q
< 1) is the acceptable range
of the service quality.
Duration and size violations are obtainable from
session-level statistics, while rebuffering violations
are computed from data packet traces available at
client log statistics. Our failure model excludes the
condition B(s) >B
s
where the test session re-
ceives more packets than expected, which is caused
by packet retransmission.
To evaluate the user’s experience, we may directly
measure the quality of voice samples and the qual-
ity of video images received at the client side (P.862,
2001; Wolf, 2001) or indirectly estimate a user’s frus-
tration rate. We prefer the less accurate but real–time
quality evaluation method. Otherwise, the server ca-
pacity decision would take a tremendous amount of
time to finalize due to its stepwise nature. For this
reason, we chose Keynote’s indirect method (Keynote
Inc., 2003). The frustration rate proposed by Keynote
Inc. is a well-established methodology to quantify a
user’s streaming experience. This measure computes
the waiting time spent at startup, the initial buffering,
and rebuffering events of the measured session. To
minimize false negatives caused by statistically gener-
ated spikes during the experiments, our methodology
extends Keynote’s rating system by collecting and an-
alyzing multiple probing sessions.
If any session failures are seen at any time dur-
ing the experimental epoch, the streaming server is
labelled as being saturated for the full experimental
epoch. Each experimental epoch used to determine
the saturation point consists of five 20-minute mea-
surement sets at a possible saturating workload. This
repetition ensures a reproducible, internally consis-
tent categorization of the server.
ICEIS 2006 - DATABASES AND INFORMATION SYSTEMS INTEGRATION
126

3 EVALUATION RESULTS
Throughout this section, we discuss the results that we
observed when calibrating the Apple Darwin Stream-
ing Server (Apple, 2003) and the RealNetworks Helix
Universal servers (RealNetworks, ). While sharing a
similar core architecture, they use very different in-
ternal policies, leading to different performances with
the same hardware.
We use box–and–whiskers plots: the horizontal
line in the middle of the box is the median value; the
lower and upper lines of the box are the 25th and 75th
percentile of the sample data.
3.1 Experimental Setup
Our experiments run on three distinct sets of ma-
chines: the streaming-server machine that is being
calibrated or tested; up to four live-source machines;
and up to six client machines. The server machine
is a dual 1.4GHz Pentium III PC with 1GB memory,
running SuSE 8.2 (kernel version 2.4.20). The other
machines are selected to have sufficient computation
and I/O capacity
1
. All the machines were connected
to a switched Gigabit network, isolated to avoid un-
controlled network interference.
To avoid performance variations, we used multiple
distinct copies of the same material for Live and VoD
tests. For our Live tests, the material was stored on
the live-source machines and was relayed through the
streaming server under test using the Darwin Playlist-
Broadcaster (Apple, 2003).
Each experimental period has three distinct phases:
ramping up, steady-state, and termination. During the
first phase, loading clients are added at 500 ms in-
tervals, which avoids start-up failures purely due to
transient effects. The loading clients are used to in-
duce a particular type of workload on the server. After
reaching the steady-state period, we collect measure-
ments from the streaming server machine. We also
sequentially launch 20 probing clients, which run for
non-overlapping 1 minute periods.
3.2 Maximum Server Capacity
Tables 2 shows the results of the final server capac-
ities measured with three different experimental se-
tups. The first set (1) Darwin was performed in the
Darwin environment without any systematic decision
model. The server saturation is determined by an ex-
pert’s intuition. This approach detects some failures
1
In our test-bed, the live–source and client machines
have 1.0 - 2.4 GHz Pentium III processors with 256 MB
- 1GB memory.
that we later refined in our failure model: hard fail-
ures, duration violations, and size violations. The sec-
ond and the third sets were executed with the Darwin
and the Helix experimental setup, respectively, using
our proposed methodology. In our decision model,
we use 0.03 for ρ
T
,ρ
B
,ρ
Q
,or3% allowances.
With the (2)Darwin experiments, several pure
workloads exhibited a different failure reason for the
server to saturate. For example, the failure type of
the VPH workload that was determined due to hard
failure on the (1)Darwin set later turned out to be a
rebuffering violation. This inconsistency is caused
by the existence of a rebuffering violation which oc-
curred before the system experienced a hard failure.
The dramatic server capacity change on the Darwin
server sets (52% difference for the VUL experiments)
is largely due to improper handling of temporary per-
formance spikes.
When comparing different servers, we found that
the Helix server achieved higher system throughput
than the Darwin server for the CPU–intensive work-
loads such as VPx and LPx. For I/O intensive work-
loads, the Darwin server reported a slightly improved
throughput for VUL and LUH.
3.3 Server-side Observations
Server side performance metrics are by far the easiest
to identify and understand. CPU, disk, network, and
memory identify the critical resources of any modern
computer system. Each of those metrics can reach
the saturation region independently. CPU utilization
indicates whether the server processor can keep up
with the tasks associated with serving the streams.
Disk and network utilization indicate how much of the
available bandwidth from these two subcomponents is
being used by a particular workload. Memory exhaus-
tion in streaming workloads is an unlikely problem
in modern systems. However, if the main memory
of the server is exhausted, and the system starts pag-
ing, performance deteriorates rapidly and CPU uti-
lization spikes. It is possible to saturate either one of
those resources before CPU utilization reaches 100%,
and thus they must be monitored independently rather
than be proxied by the CPU utilization of the server.
In this section, we focus on discussing the statis-
tics of CPU usages. Figure 2 plots the summary
statistics of CPU usages for the CPU–intensive pure
workloads. They do not show statistically significant
trends over the workload ranges of interest. The lin-
ear trend with increasing load on the Darwin server
is attributable to the initial load offset, which is in-
cremented as an experiment progresses (Figure 3(a)).
Such a sawtoothed temporal dependency of the load
usage makes it hard to estimate the current server state
from the performance data collected during a ran-
domly chosen short time interval if the initial load off-
RELIABLE PERFORMANCE DATA COLLECTION FOR STREAMING MEDIA SERVICES
127
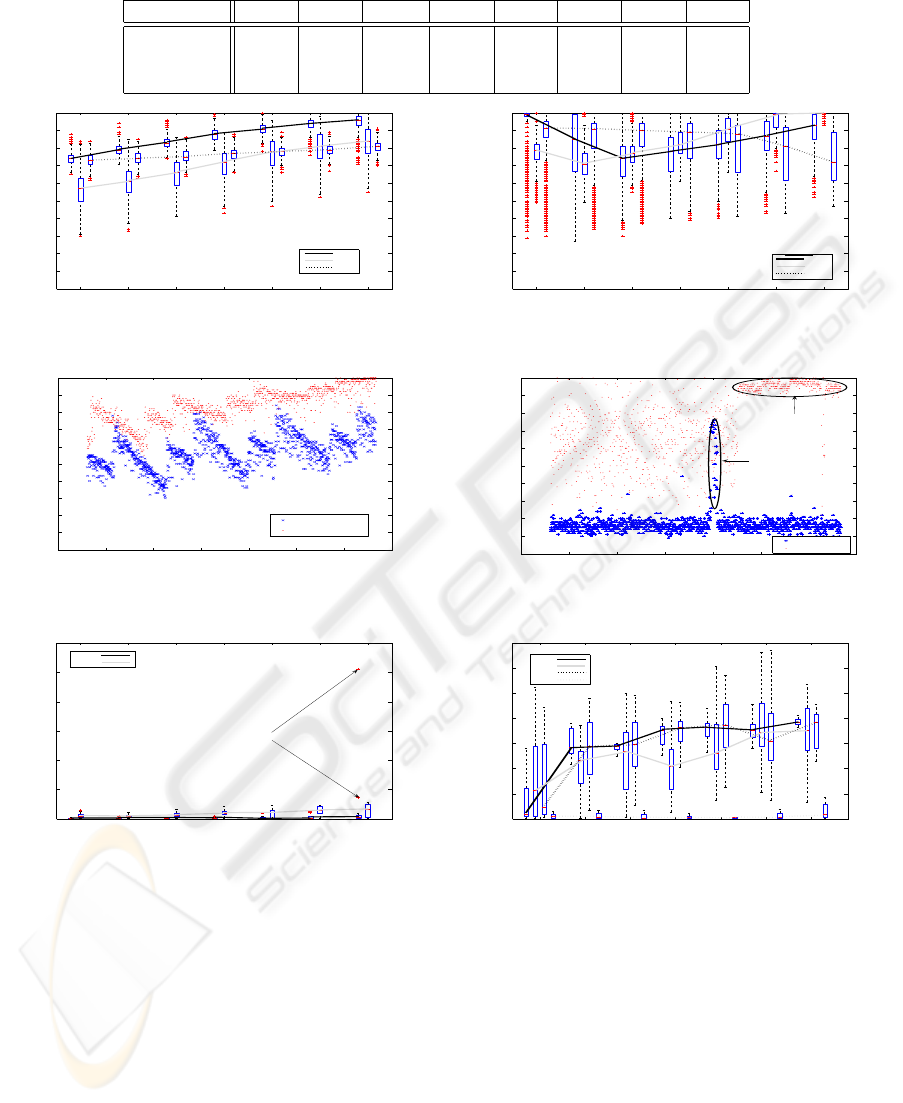
Table 2: Different sets of experimental setups and their server capacity.
VPH VPL VUH VUL LPH LPL LUH LUL
(1)Darwin 438 780 36 170 996 - - 405
(2)Darwin 425 726 33 259 1158 1976 405 405
(3)Helix 590 1220 91 228 1460 2870 396 492
70 75 80 85 90 95 100
0
10
20
30
40
50
60
70
80
90
100
CPU Usage
Degree of Saturation (%)
LPH
VPL
LUL
70 75 80 85 90 95 100
0
10
20
30
40
50
60
70
80
90
100
CPU Usage
Degree of Saturation (%)
LPL
VPH
LUH
(a) Darwin (b) Helix
Figure 2: CPU usage as a function of the degree of saturation.
0 200 400 600 800 1000 1200 1400
0
10
20
30
40
50
60
70
80
90
100
Elapsed Time (Seconds)
CPU Usage
VPL 70 % load
VPL 100% load
0 200 400 600 800 1000 1200 1400
0
10
20
30
40
50
60
70
80
90
100
Elapsed Time (Seconds)
CPU Usage
VUH 95 %
LPH 70 %
Persistent Spike
Temprorary Spike
(a) Darwin: Sawtoothed temporal dependency (b) Helix: Persistent load spike vs. temporary load spike
Figure 3: Abnormal behaviors of CPU utilization.
1 2 3 4 5 6 7
0
1
2
3
4
5
6
Startup Delay (Seconds)
Degree of Saturation (%)
VPH
LPH
VPH Outliers
70 75 80 85 90 95 100
0
0.1
0.2
0.3
0.4
0.5
0.6
0.7
Values
Column Number
VPH
VUL
LPH
LUL
(a) Darwin (b) Helix
Figure 4: Startup Delay.
set is unknown. On the Helix server, the median CPU
measurements for LUx workloads (Figure 2) shows
a slightly negative trend with increasing load. Fur-
thermore, the CPU usage for the popular workloads
(LPx and VPx) is non-monotonic with changing load.
The Helix experiments tend to have more load spikes
(Figure 3(b)) than the Darwin experiments. While
the temporarily imposed load spike (VUH measure-
ments in the Figure) disappears quickly, a persistent
spike lasts for a long time and the system stays heav-
ily loaded, shown as a ‘+’ symbol in Figure 2(b). Of
course, the non-monotonic nature of the Helix server
is a side-effect of such persistent spikes.
3.4 Client-side Observations
We expect that there are good indicators for the server
saturation at the client-side. Depending on the server
policy, an overload may result in increased startup la-
tency or a number of late packets, or both. Specifi-
cally, we present saturation behaviors of the startup
delay. Increased startup latency indicates that the
server is falling behind in processing new requests.
In Figure 4(a), the Darwin server shows a number
of outliers from the startup delays when approaching
the saturated region for VPx workloads. When the
Darwin server is fully loaded with the VPH work-
load, startup delays begin to show extremely large
ICEIS 2006 - DATABASES AND INFORMATION SYSTEMS INTEGRATION
128

outliers (5 seconds and 0.8 seconds in Figure 4(a)),
while their median value is very small. We cannot
observe such large outliers when the server runs in
the unsaturated region. Thus, any occurrence of in-
tolerable startup delay for the VPx workload on the
Darwin server would quickly indicate that the server
system enters the saturated region. Figure 4(b) shows
that the median values of the startup delays over vari-
ous workloads on the Helix server seems to converge
quickly when the load approaches 75% of the satura-
tion level. Thus, any median values (more than 300
milli-seconds) collected for a short-period of time in-
dicates that the server experiences more than 70% of
the saturating load. However, the wide variability and
the negative trends of the Helix startup delay above
the 75% load-percentile inevitably prevent any pre-
dictions.
4 RELATED WORK
Cherkasova et al. (Cherkasova and Staley, 2003;
Cherkasova et al., 2005) provided one of the first com-
prehensive performance analysis of media servers un-
der video-on-demand workloads with both popular
and unpopular content. The authors identified impor-
tant client side performance metrics, namely jitter and
rebuffering. The paper also recognized the need to
measure the basic capacity of the server under differ-
ent workloads. Our work extends both the workload
space by examining live streams in addition to video
on demand (as well as considering their mix), and the
client metrics space by looking into failures, startup
latency, and thinning.
Independent monitoring and verification of perfor-
mance is provided by several commercial services
such as Keynote
2
, Streamcheck
3
and Broadstream
4
.
They also provide a weighted score that summarizes
in a single number the overall the performance de-
rived from low level metrics.
5 CONCLUSIONS
In this paper we have presented a systematic perfor-
mance evaluation methodology to measure the capac-
ity of streaming media systems consistently and reli-
ably. We then validated our methodology with a case
study of two commercial streaming servers.
Compared with our earlier approach that primar-
ily relied on expert’s intuition, our new method cor-
rectly predicts a 52% higher server capacity for the
2
http://www.keynote.com
3
http://www.streamcheck.com
4
http://www.broadstream.com
Darwin VUL workload while confirming the other
workload decisions. We have demonstrated that the
performance metrics at the server-side such as CPU
load and at the client-side such as startup delay are
affected by the system load in different ways, and that
each by itself cannot be a good classifier to differen-
tiate workload types and to estimate the system load
accurately.
The lessons we learnt through the extensive mea-
surements of two commercial streaming servers are
directly applicable to the management of multiple
servers (e.g., in a cluster configuration). We conclude
that better throughput can be achieved by assigning
requests and content so that the popularity of clips
is maximized, by separating requests for on-demand
and live streams to different servers and by converting
on-demand requests to live streams whenever possi-
ble.
REFERENCES
Apple (2003). Darwin Streaming Server 4.1.3.
http://developer.apple.com/darwin/projects/streaming/.
Cherkasova, L. and Staley, L. (2003). Building a perfor-
mance model of streaming media application in util-
ity data center environment. In 3rd IEEE/ACM Inter-
national Symp. on Cluster Computing and the Grid,
Tokoyo, Japan.
Cherkasova, L., Tang, W., and Vahdat, A. (2005). Media-
guard: a model–based framework for building stream-
ing media services. In Proc. of the SPIE Conf. on
Multi–Media Computing and Networking.
Covell, M., Roy, S., and Seo, B. (2005). Predictive mod-
eling of streaming servers. SIGMETRICS Perform.
Eval. Rev., 33(2):33–35.
Keynote Inc. (2003). Measurement and Monitoring:
Streaming Perspective. http://www.keynote.com/-
downloads/datasheets/streaming
0104.pdf.
P.862, I.-T. R. (2001). Perceptual evaluation of speech
quality (PESQ), an objective method for end-to-end
speech quality assessment of narrowband telephone
networks and speech codecs.
RealNetworks. Helix Universal Server. http://www.-
realnetworks.com/products/media
delivery.html.
Schulzrinne, H., Casner, S., Frederick, R., and Jacobson,
V. (1996). RTP: A Transport Protocol for Real-Time
Applications. RFC 1889.
Spasojevic, M., Bhatti, N., Kontothanassis, L., and Roy, S.
(2005). Undestanding the impact of diverse stream-
ing workloads on end–user quality of service. In 10th
International Workshop on Web Caching and Content
Distribution (WCW).
Wolf, S. (2001). Draft technical report for ‘objective video
quality measurement using a peak-signal-to-noise-
ratio (PSNR) full reference technique’. T1A1.1/2001-
026R1.
RELIABLE PERFORMANCE DATA COLLECTION FOR STREAMING MEDIA SERVICES
129
