
AN EVALUATION OF A VISUAL QUERY LANGUAGE FOR
INFORMATION SYSTEMS
Haifa Elsidani Elariss, Souheil Khaddaj
Faculty of Computing, Information Systems and Mathematics, Kingston University London, Kingston upon Thames,UK
Ramzi Haraty
Division of ComputerScience and Mathematics, Lebanese American University, Mme Curie Street, Beirut, Lebanon
Keywords: International visual user interface, Spatio-temporal databases and Mobile phone applications.
Abstract: In recent years, many non-expert user applications have been developed to query Geographic Information
Systems. GIS are used to browse and view data about space and time thus naming them spatio-temporal
databases. The Location Based Services which are considered as part of the spatio-temporal field, concern
the user who asks questions related to his current position by using a mobile phone. Our research aims at
designing and developing an International Visual Query Language (IVQL) that allows users to query
databases based on their location. The databases are installed on a GIS server computer. The queries are sent
to the server from a mobile phone through the Short Messages System (SMS). With the emerging
Globalization of user interfaces, IVQL is meant to have a global and international user interface that could
be understood by all users worldwide. We propose a user interface consisting of smiley icons that are used
to build an international query language. Smiley icons enable the users to access data and build queries
easily and in a user-friendly way. IVQL, its user interface, model and evaluation are explained. The query
formulation is illustrated using a sample GIS system for tourists, to perform network and proximity analysis.
1 INTRODUCTION
During the last decades, computer applications have
been deployed to manage spatial data with
Geographic Information Systems. GIS are able to
store, analyze and visualize a large volume of
geographic information. They play a major role in
many domains such as urban and environmental
planning, transportation and tourism. They can be
applied in different fields such as location based
services, fire and emergency departments, problem
solving and many others (Clementini, 1993). They
deal with spatial data objects and relations that are
often represented by a visual approach. The spatial
objects are stored in the form of maps. To execute
operations that analyze spatial data, structured query
languages (SQL) are used to integrate the analysis
with the GIS. One problem is that SQL query
languages possess complex textual syntax. Another
problem is the need to know the structure of the
database schema before writing a query (Djordjevic-
Kajan, 1996). Most of GIS users are expected to be
non experts in the geographic domain. Since it is
difficult for casual users to learn query languages,
the need emerges to design and develop visual, user-
friendly and ease-of-use query interfaces. A major
challenge nowadays is the visualization of query
languages. The purpose of visual query languages is
to enhance the GIS effectiveness and usability. They
facilitate the process of query formulation.
Moreover, there is an urgent need to deal with the
globalization of visual query languages in order to
meet global and diversified demands. Globalization
refers to the production of products that are used
internationally. The need to develop international
user interfaces becomes a crucial issue in visual
query languages. Marcus, in his paper (Marcus,
1999), defines globalization and demonstrates why
globalization is vital to the success of software.
Thus, with the emerging globalization of user
interfaces, in this work the use of smiley icons is
proposed in order to build an international query
language. A smiley is a graphical representation that
displays a smiley face to express emotions and
convey facial expressions such as, happy, sad or
bored. They can be easily understood by all peoples
worldwide. Smiley icons have a high level of
51
Elsidani Elariss H., Khaddaj S. and Haraty R. (2006).
AN EVALUATION OF A VISUAL QUERY LANGUAGE FOR INFORMATION SYSTEMS.
In Proceedings of the Eighth International Conference on Enterprise Information Systems - HCI, pages 51-58
DOI: 10.5220/0002465400510058
Copyright
c
SciTePress

expressiveness. Pang, in his thesis (Pang, 2002) uses
smiley icons to express the operator’s feelings in a
nonverbal interface for the McDrive system
developed for the McDonald chain. The smiley faces
are displayed on the screen to show the right facial
expression. In our research, smiley icons are used to
represent themes, objects and operators. They are
used to formulate queries in a global language. We
start by a brief overview of a number of visual
languages. Then, a framework for an International
Visual Query Language (IVQL) is proposed. The
approach addresses the visual query formulation
through the use of smiley icons that represent
geographic features, relations and functions such as,
themes, objects and operators. IVQL can be
extended as much as the user needs. It can include as
many icons as needed whether they represent themes
or objects. It is expected to manage dynamic query
processing. The query formulation is hereby
illustrated using a sample GIS system for tourists
who need to query the database based on their
current location from a mobile phone. The databases
are installed on a GIS server computer. The queries
are sent to the server for example using the Short
Messages System (SMS) from mobile devices.
2 VISUAL QUERY LANGUAGES
In this section we briefly describe some of the state
of the art visual query languages showing some of
their advantages as well as limitations.
2.1 The LVIS Language
LVIS (Bonhomme, 1999) is a visual query language
for spatio-temporal databases. Metaphors are used
for Querying Visually Spatio-Temporal Databases
(Bonhomme, 2000). Geographic pictures represent
spatial objects (object types) and Geometric shapes
represent relations among them (operators).
Balloons and Anchors are placed on a temporal axis
to describe spatio-temporal criteria. The user builds
a visual query by selecting a combination of the
icons that represent the pictures, shapes, and
temporal axis (Bonhomme, 2002). The temporal
queries are built inside balloons that may be
minimized in form of anchors for better visualization
of the query under development. The interface
contains a working area to build, validate and
execute the query which is then translated to a pivot
language that is independent from the host query
language of the target GIS platform. The pivot
language is compatible with the standardized
Spatial-SQL (ISO/IEC, 1996) for spatial operators
and with TSQL (Snodgrass, 1995) for temporal
operators and uses the Allen temporal intervals
(Allen, 1983). Then, the visual query is translated
into the GIS target language and the result of the
query is visualized on a map. LVIS is an extension
of the CIGALES (Aufaure, 1995) and (Lbath, 1997)
which is a visual query language for spatial
databases where temporal aspects are not
considered. Psycho-cognitive tests have been
developed to measure the interpretability and
comprehension of the metaphors. The major aim of
the tests is to show that the metaphors of the
language are well recognized by end-users. Two
subject groups were chosen: persons working with
GIS and persons who are non-experts. The results of
the experimentation have shown that the recognition
of metaphors is effective to users especially the ones
without prior experience with GIS systems. The
results showed also that the subjects were able to
recognize the relationship between spatial objects
very easily and that the metaphors are well accepted
by the two populations.
2.2 The PHENOMENA Language
PHENOMENA, described in (Laurini, 2003) and
(Paolino, 2004), is a visual query language for
Continuous Fields developed for GIS. It manages
both continuous fields and discrete objects in a
uniform manner. Continuous fields represent real-
world events such as temperature and pressure.
Discrete objects represent points, lines or areas. The
user is provided with the capability to capture some
features of a scenario by selecting an area of interest
and handling the events involved. Continuous fields
and spatial conditions are visualized using
metaphors called geometaphors. To build a query,
the user chooses a continuous field that is
represented as geographic data then a function that
describes its behavior. Combining continuous fields
with spatial conditions provides the user with the
capability of querying those phenomena that vary in
space, such as the temperature on a region or the
density of population in a city. Thus, it is intended to
be used by domain experts such as geologists and
meteorologist. The user interface is made up of two
areas. The area on the left contains the icons that
represent continuous fields such as temperature and
the icons that represent spatial objects such as river.
The area on the right contains the icons that
represent the aggregate functions such as minimum.
The user drags and drops the icons into the central
tabbed panel in order to formulate the SQL-like
query that can be either executed or saved.
ICEIS 2006 - HUMAN-COMPUTER INTERACTION
52

2.3 The GeoQA Language
GeoQA (Stojanovic, 2000) is a visual query and
analysis tool that has been proposed as an integral
component of the GinisNT which is an Object-
Oriented GIS framework used for GIS applications
development. GeoQA has an interactive visual
interface used for formulating and processing
spatial, non-spatial and combined queries. GeoQA
may be applied in GIS applications that are used for
urban planning and prevention of pollution, etc. It
has been applied on the GIS application GeoTT
which is developed for managing the Telegraph-
Telephone cable network in the Republic of Serbia,
Yugoslavia as described in (Djordjevic, 1996) and
(Stojanovic, 1998). The visual graphical user
interface of GeoQA is a WYSIWYG interface made
up of icons, toolbars and a panel in which maps are
displayed each in a separate window. The GUI has
dialog boxes and pop-up menus. Two sets of Icons
are displayed in toolbars based on their function and
representation. The first set contains icons
representing all spatial entities. The second set
contains icons representing spatial relations
(topological, geometric and direction) and spatial
operators (point, region, window). The user uses the
mouse and the icons to manipulate directly and
interactively the maps. Dialog boxes and text input
are used in formulating queries including spatial
relations. Queries can be saved for later loading. The
output result of a query is displayed in a window in
the panel with or without the background map based
on the user’s choice. GeoQA uses the Mediator
(Stoimenov, 1999) which is for an OO front-end to
RDBMSs. No evaluation of the language was made.
2.4 Other Visual Languages
There are also a number of other approaches to
Visual Query Languages that are hereby described.
Kaleidoquery (Murrey, 1998) is a visual query
language for object databases that depicts the query
as a filter flow. A comparative evaluation was
undertaken to compare the design of Kaleidoquery
to another textual query language, Object Query
Language (OQL). A paper and pencil test
experiment was conducted to obtain quantitative
data on user performance and questionnaires to
obtain qualitative data on ease of use, user
satisfaction and resolution of query language
problems. Two subject groups were selected from
students who hold university degrees and were
classified as programmers and non-programmers.
Programmers correctly defined significantly more
relationship queries in Kaleidoquery. They showed
higher preference for attribute comparison in OQL
and for data flows over and and or in OQL. Non-
programmers answered significantly more correct
queries in Kaleidoquery than OQL. They defined
more correct queries with results selection and
showed a higher performance for the structuring
aspects of Kaleidoquery. In general, programmers
performed better than non-programmers.
The Filter-flow (Morris, 2004) and (Morris,
2002) is a visual query language and interface for
large spatial databases. The various types of queries
are expressed by Basic Filters that are represented
by icons in order to construct query diagrams
between data input and data output elements. The
comparison between the Filter-flow visual language
and the ArcView GIS was used to evaluate the query
building process. Evaluation tests for both the
language and the interface have been designed. Two
subject groups of users were selected and classified
as users with some experience of using GIS systems
and users with no prior knowledge of GIS. The
results of the evaluation showed that the Filter-flow
visual query language simplified the learning
process of the user, made the query expression
process easier and proved to make the query
expression more readable.
The Exploratory Database View Constructor
(EDVC) (Smith, 2004) and (Smith, 2005) is a visual
query interface especially experimented to support
Link Analysis (LA) that is used to understand data
collected in criminal or terrorist threat analysis. It
uses rectangular icons to visualize objects such as
people and locations. It uses directional lines to
represent the connections and links between the
objects. To evaluate the query language, subjects
were chosen at random from different educational
background. All the subjects had experience with
graphical user interface but had no previous
knowledge on using a query language. The aspects
evaluated are: query writing, reading, interpretation,
comprehension, memory and problem solving.
These methods measure the ease of use of the query
language. The results of the user evaluation
indicated that the user interface is well suited to
supporting users with no experience. The subjects
were able to form a useful class of queries and this
was facilitated by the intuitive style of the
interaction provided in the explorer. The results also
indicated that the user interface for constructing path
filters needs to be improved.
Special Interactive Visual Tools have been
developed, as described by (Andrienko, 2004), to
explore the analysis of spatial-Temporal data. The
interface provides the user with time-control icons to
AN EVALUATION OF A VISUAL QUERY LANGUAGE FOR INFORMATION SYSTEMS
53
specify the beginning and end of a period of time
during which the changes have occurred on a spatial
location. No evaluation of the language was made.
2.5 Summary
The above described state-of-the-art visual query
languages have demonstrated a considerable
improvement in the field of visual query languages.
However, each one of them has some limitations.
We hereby discuss their advantages and limitations.
The LVIS visual query language described by
(Bonhomme, 2002) has a major advantage which is
using iconic Metaphors to represent and visualize
objects locations and operators. The PHENOMENA
visual query language described by (Laurini, 2003)
and (Paolino, 2004) has a major advantage which is
the use of a uniform visual environment, iconic
metaphors that represent operators to be applied
simultaneously to spatial and continuous fields. The
user can manage continuous fields as actual spatial
data. GeoQA described by (Stojanovic, 2000) has a
major advantage which is the flexibility in the
options in building queries. The user can text input a
query, build a query by using a combination of text
input and icons, and the possibility of building
complex queries by using only icons (iconic query
building). However, none of the above visual query
languages is able to provide the user with the ability
to formulate dynamic queries and none takes into
account mobile computing users. They do not
provide users from different culture and background
with an international visual query language that
depicts queries using icons. The IVQL visual query
language aims to present an integrated approach that
combines some of the advantages of the various
languages as well as remedy some of their
limitations. The use of iconic metaphors to depict
object, locations and operators has been used from
the LVIS visual query language by using the smiley
icons that have a more expressiveness power. The
idea of applying the same operators to continuous
fields as well as spatial fields in the PHENOMENA
visual query language has been used in the IVQL
visual query language. The operator < less than can
be applied to spatial and temporal fields such as,
find locations that fall within a certain distance and
to find events that fall within a certain time interval.
GeoQA provides the user with the possibility to
either text input a query or to build a query by using
only icons. IVQL provides the user with the
possibility to either text input his location with the
destination location or select them from list boxes.
As mentioned above some of visual query languages
have been evaluated while others have not which
means that their effectiveness and expressiveness
have not been tested. However, the IVQL will be
tested in future work using some of the strategies
discussed earlier as well as other possible strategies.
3 PROPOSED FRAMEWORK
3.1 IVQL Architecture
The IVQL user interface is installed on the target
device where the user can formulate a query
visually. The query is converted into a pivot
language and might be sent for example using an
SMS message to the GIS server where it is saved in
a sequential file. IVQL is implemented as a
middleware between the text-queries (pivot
language) and any Object-Relational database
management system (ORDBMS). An ORDBMS has
an object-oriented (OO) environment, is based on an
OO data model as well as on an OO application
development methodology. Its underlying spatial
database is stored and organized by a RDBMS. The
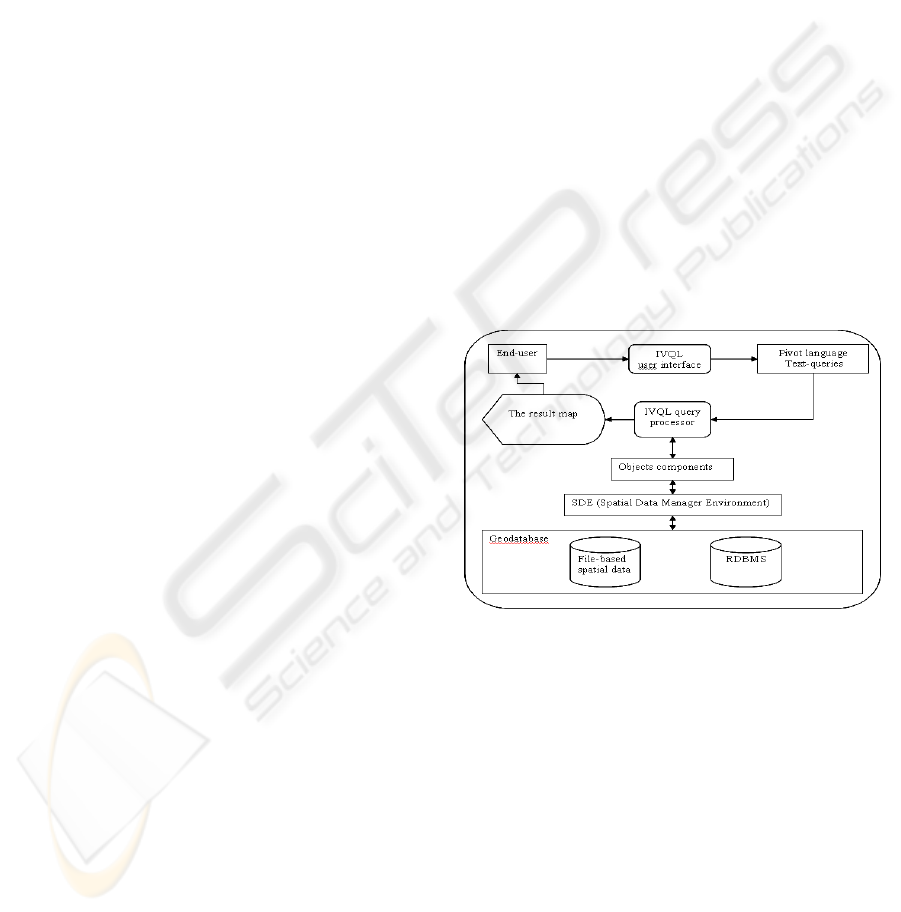
architecture of IVQL is shown in Figure 1.
Figure 1: The architecture of IVQL.
Objects Components is a framework that allows
the creation of new domain-specific components
from previously developed ones. It forms a common
library of those software components called Objects
used to build, manage and query the database. They
allow users to develop new extensions and embed
maps functionality in applications, thus making the
database scaleable. SDE is used to handle, access,
manage, index and display spatial data stored in a
RDBMS. It enhances data management performance
and enables schema portability between RDBMSs.
Pivot language plays the role of a middleware
between the user interface and the query processor.
The user interface translates and converts the visual
queries into text queries by replacing each icon with
its textual name before the query is sent to the GIS
server for execution. Pilot language Text-queries is
ICEIS 2006 - HUMAN-COMPUTER INTERACTION
54
a sequential file that contains the received text
queries. IVQL query processor reads sequentially the
text queries that are stored in the Pilot language
Text-queries, converts them to GIS SQL statements
and executes them. It can process dynamic complex
queries and includes intelligent query mechanisms.
3.2 IVQL Query Representation
IVQL has a global query representation that is based
on smiley icons and intended for users from
different countries with different cultures, thus
enabling them to access data and build queries easily
and in a user-friendly way. Smiley icons are text-
free.
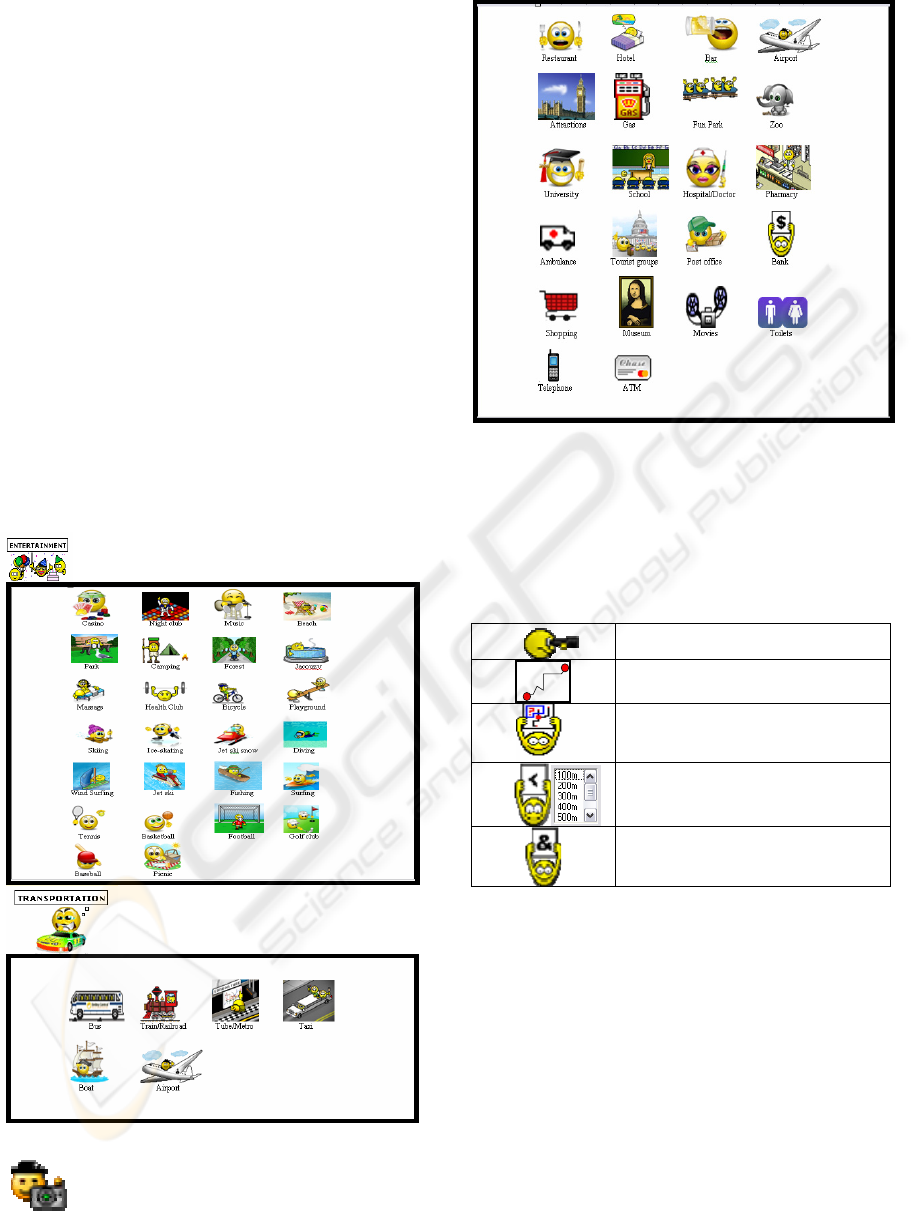
3.2.1 Themes, Objects and Instances
A theme represents a category of objects such as,
entertainment, transportation and tourist. Each object
represents a group of locations such as restaurant. A
location is an instance of an object such as XX
restaurant. Figure 2 shows the basic visual elements.
Figure 2: Basic elements of the IVQL user interface.
3.2.2 Visual Representations of Operators
The queries are formulated using the smiley icons
that represent and depict instructions to find the
shortest path between two locations, nearest object
or to find all locations of a certain type within a
certain distance as shown in Figure 3.
Find
Shortest path
Nearest and display shortest
path
All locations within a certain
distance
AND
Figure 3: The operators smiley icons and their meaning.
3.2.3 Visual User Interface
IVQL user interface may accommodate 6-7 rows
and 6-7 columns in order to fit the small screen of a
mobile phone. It provides the user with two major
toolbars, one horizontal and one vertical. It has a
middle area where objects are displayed and a query
formulation area at the bottom of the interface. The
horizontal toolbar contains the smiley icons that
represent proximity relations to be applied on icons
that are displayed in the vertical toolbar. The vertical
toolbar displays icons that represent themes. The
middle area displays the theme objects on which the
spatial operation is to be applied. The query
formulation is done first by selecting an icon from
AN EVALUATION OF A VISUAL QUERY LANGUAGE FOR INFORMATION SYSTEMS
55
the horizontal toolbar. The icon is moved to the
query formulation area at the bottom of the interface.
Second, the user selects a theme from the vertical
toolbar. All objects that belong to the selected theme
are displayed in the middle area. The user selects the
object needed that is moved to the query formulation
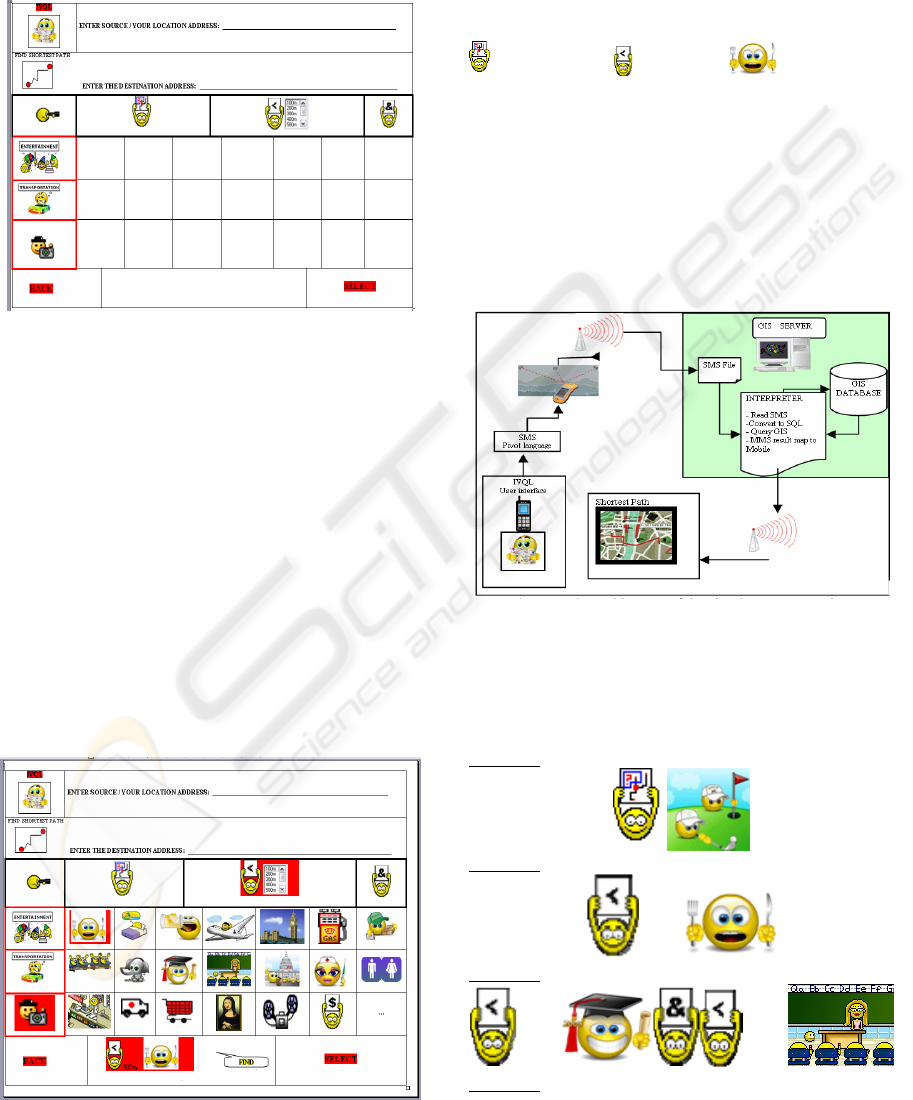
area. The user interface is shown in figure 4.
Figure 4: The IVQL user interface.
The first two rows of the IVQL user interface are
used to allow the user to text input the source and
destination addresses. He can input his current
location and input the address of the destination then
query the shortest path between them. In the first
row, the location of the user could be automatically
determined by a GPS, LBS (Location Based
Services), RADAR, etc. So, there will be no need to
include the Text Input of the user’s location. The
same applies to the second row. With the possibility
of having an open-line connection, the user can
query a list of hospitals and get back an output
showing their locations on the map as well as a list
box that includes the name and address of each
hospital. In such a case, the user can select the
hospital from the list box and use it as an input to the
destination and then ask for the shortest path. Figure
5 shows the query ‘find within 500m all restaurants’.
Figure 5: A formulated visual query.
The icon “more” appears as the last icon to inform
the user that there are more icons to display.
3.3 Query Processing Architecture
After building a query, the user clicks the FIND icon
to process it. IVQL converts the query into normal
text by assigning a TEXT name to each icon, such as
nearest within restaurant.
The Text query is displayed as an SMS message.
The user chooses the ‘send’ option and inputs the
phone number that is assigned to the GIS server. The
SMS message is received by the GIS server. The
query interpreter processes the SMS messages
sequentially. Each message processed is first
translated into a Select-From-Where SQL query and
then executed on the GIS database. The resulting
map of the query is sent to the user as an MMS
message. Figure 6 shows the query processing.
Figure 6: The architecture of the query processing.
The user interface is implemented for mobile
phones by using the J2ME platform installed on the
Symbian operating system. The query interpreter is
implemented on the server computer. Some of the
queries that can be formulated are presented below.
Query 1:
Find nearest golf club and the shortest path
Query 2:
Find all restaurants within 500m
500m
Query 3: Find universities & schools within 500m
500m 500m
Query 4:
Find shortest path to destination address
ICEIS 2006 - HUMAN-COMPUTER INTERACTION
56
Destination address
Query 5: Find all bus stations within 500m and all
train stations within 700m
500m 700m
The resulting map uses symbols to represent the
locations found by a query. Figure 7 shows some of
the international symbols used for tourists.
Figure 7: Some symbols of Garmin GPS 12 MAP.
3.4 IVQL Model
The suggested model has been developed based on
the fact that its elements are spatial geographic
features and taking into consideration the relations
that exist between them. Accordingly, a spatial data
model and a relations model have been designed.
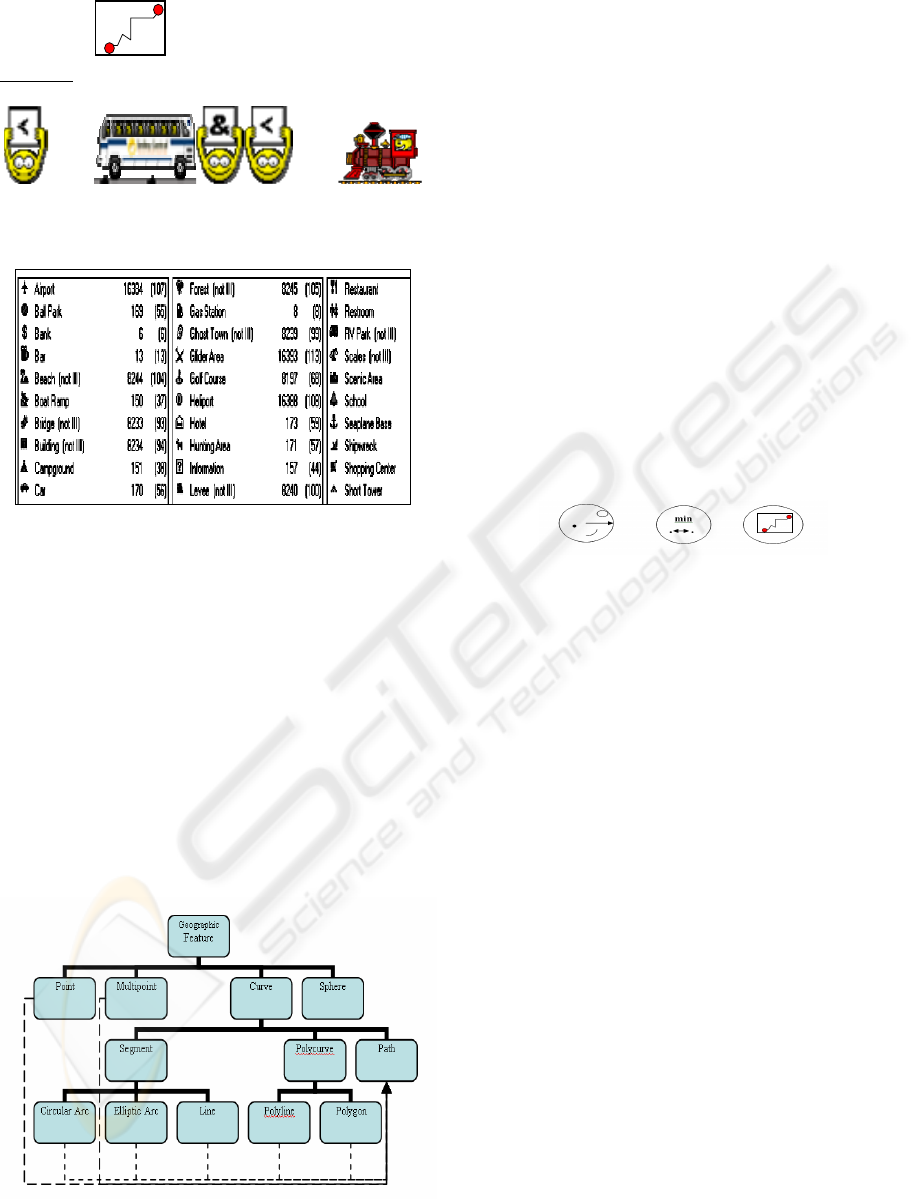
3.4.1 Data Model
The data model of IVQL is based on the object-
oriented approach. Its major components are feature
objects, feature classes, attributes, inheritance and
aggregation. Figure 8 shows the hierarchy of spatial
classes that represent geographic spatial features.
Figure 8: The hierarchy of geographic feature class.
The Geographic Feature contains attributes and
methods that are common to all other classes below
it. The lowest-level classes such as Circular Arc,
Elliptic Arc, Line, Polyline and Polygon are used to
construct the Path class. Each of the lowest-level
classes possesses an internal identifier, a spatial
location and a thematic identifier. The spatial
location class contains the x and y coordinates of the
object whereas the thematic class contains its
attributes such as name. The Path class is used for
network analysis. The Class hierarchy is extensible.
3.4.2 Network Relations
Our model consists of geometric relations that define
metric properties of spatial objects such as length &
distance. The network relations can be derived from
them such as the length of a path, minimum distance
and within a distance. These relations play a major
role in proximity and network analysis such as
querying objects within a certain range, finding the
nearest neighbor of a certain feature class and
finding the shortest path between two defined
objects. Figure 9 shows the relations.
Figure 9: The models of the network relations.
The network relations are declared in the Path
class. The skeleton of their definition is explained.
The IPointToEID object finds the nearest element to
a given point. It returns the element EID nearest to
the input point. Its method is: GetNearest(in Point,
outnearestEID, outLocation). The ITraceFlowSolver
object the FindPath which determines the optimal
path between two locations. Its method is: FindPath
(in FlowMethod, out junctionEIDs, out edgeEIDs,
out segmentCosts). The NetSolver object finds all
features of a certain type within a distance. Its
method is: SetFilterRanges(in Element Type, in
fromValues, in toValues, out Locations).
4 CONCLUSION
In this paper a visual approach to querying databases
was proposed. The approach aims at designing and
implementing IVQL, a visual query language that
has an international user interface. A critical
evaluation of the different methods proposed in the
literature for querying spatio-temporal databases has
been carried out in order to build the presented
approach upon the current generation of spatio-
temporal query languages. Smiley icons are used in
the user interface to facilitate the query formulation.
In order to evaluate their use in IVQL, a
comparative evaluation of the methods used to
AN EVALUATION OF A VISUAL QUERY LANGUAGE FOR INFORMATION SYSTEMS
57

evaluate visual query languages has been carried
out. The proposed framework, architecture, model,
user interface and query processing have been
described using a tourist information system for
network and proximity analysis. We also suggest the
implementation of a prototype, the evaluation of the
framework as well as its user interface and
conducting usability testing and user testing to verify
the quality of the icons as well as the expressive
power of the iconic visual query language.
REFERENCES
Allen, J., 1983. Maintaining knowledge about Temporal
Intervals. Communications of the ACM, 26(11), 832-
843.
Andrienko N. and Andrienko G., 2004. Interactive Visual
Tools to Explore Spatio-Temporal Variation. In
Proceedings of ACM AVI’04, Advanced Visual
Interfaces. May 25-28, 2004. Gallipoly (LE), Italy.
Aufaure, M. A., 1995. A High-Level Interface Language
for GIS. Journal of Visual Languages and Computing.
Academic Press, 6(2), 167-182.
Bonhomme C. and Aufaure M. A., 2002. Mixing Icons,
Geometric Shapes and Temporal Axis to Propose a
Visual Tool for Querying Spatio-Temporal Databases.
In Advanced Visual Interfaces, Trento, Italy.
Bonhomme C., Trepied C. and Aufaure M. A., 2000.
Metaphors for Visual Querying Spatio-Temporal
Databases. In Proceedings of the 4
th
International
Conference on Visual Information Systems. Springer
Verlag, Lecture Notes in Computer Sc., pp. 140-153.
Bonhomme C., Trepied C., Aufaure M. A. and Laurini R.,
1999. A Visual Language for Querying Spatio-
Temporal Databases. In Proceedings of ACM GIS’99,
7
th
ACM Symposium on Advances in Geographic
Information Systems. November 1999. Kansas, USA.
Clementini, E., De Felice P. and Van Oosterom, P., 1993.
A Small Set of Formal Topological Relationships for
End-user Interaction. In Proceedings on Advances in
Spatial Databases, Singapore, 1993, 277-295.
Djordjevic-Kajan, S., 1996. Functions and contents of
digital maps in process of building GIS in Serbia PTT.
In Proceedings in GIS/LIS, Budapest, Hungary, June
10-14, 1996, GIS/LIS Editions, 82-91.
ISO/IEC, 1996. JTC1/SC21/N10441, SQL Multimedia and
Application Packages, Part3: Spatial, p.172.
Laurini R., Paolino L., Sebillo M., Tortora G., Vitiello G.,
2003. Phenomena – A Visual Query Language for
Continuous Fields. In Proceedings of ACMGIS 2003
on Association for Computing Machinery, New
Orleans, Louisiana, USA 2003.
Lbath A., Aufrane-Portier M. A., Laurini R., 1997. Using
a Visual Language for the Design and Query in GIS
Customization. In VISUAL’97, 2
nd
International
Conference on Visual Information Systems, San
Diego, USA, pp. 197-204.
Marcus A., 1999. Globalization of User-Interface Design
for the Web. In Fifth Conference on Human Factors
and the Web: The Future of Web Applications. June 3,
1999. Gaithersburg, Maryland, USA.
Morris A. J., Abdelmoty A. I., Tudhope D. S., and
ElGeresy B. A., 2004. A Filter-flow Visual Query
Language and Interface for Spatial Databases.
GeoInformatica, 8(2), 107-141.
Morris A. J., Abdelmoty A. I., Tudhope D. S., and
ElGeresy B. A., 2002. Design and Implementation of a
Visual Query Language for Large Spatial Databases.
In Proceedings of the Sixth International Conference
on Information Visualisation (IV’02).
Murray N. S., Paton N. W. and Goble C. A., 1998.
Kaleidoquery: A Visual Query Language for Object
Databases. In Proceedings of Advanced Visual
Interfaces, L’Aquila, Italy, May 25-27, 1998.
Pang Y., 2002. Multimodal McDrive System. Master
Thesis, Faculty of Information Technology and
Systems, Delft University of Technology.
Paolino L. and Laurini R., 2004. Dealing with Geographic
Continuous Fields – the Way to a Visual GIS
Environment. In Proceedings of ACM AVI’04, May
25-28, 2004. Gallipoly (LE), Italy.
Smith M., King P., 2005. A Database Interface for Link
Analysis. Journal of Database Management, Idea
Group Publishing, 16(1), 60-74.
Smith M. N., 2004. Enhancing Database Interface
Support for Link Analysis. PhD Thesis, Birkbeck
College, University of London.
Snodgrass R., 1995. (Ed.). The TSQL2 Temporal Query
Language. Kluwer Academic Publishers.
Stoimenov L., Mitrovic A., Mitrovic D. and Djordjevic-
Kajan S., 1999. Bridging objects and relations: a
Mediator for an OO front-end to RDBMSs.
Information and software technology, 41(2), 57-66.
Stojanovic Z., Djordjevic-Kajan S. and Stojanovic D.,
2000. Visual Query and Analysis Tool of the Object-
Relational GIS Framework. In Proceedings of
Advanced Visual Interfaces. McLean, VA USA.
Stojanovic Z., Djordjevic-Kajan S. and Stojanovic D.,
1998. Query language in Telecom GIS. In
GISPlaNET’98 Conference, 7-11.9.1998, Lisbon,
Portugal.
ICEIS 2006 - HUMAN-COMPUTER INTERACTION
58
