
A FUZZY-BASED DISTANCE TO IMPROVE EMPIRICAL
METHODS FOR MENU CLUSTERING
Cristina Coppola, Gennaro Costagliola, Sergio Di Martino, Filomena Ferrucci, Tiziana Pacelli
Dipartimento di Matematica e Informatica, Università degli Studi di Salerno,via Ponte don Melillo, Fisciano (SA), Italy
Keywords: Menu Design, Human Factors, Design Methodology.
Abstract: An effective menu organization is fundamental to obtain usable applications. A common practice to achieve
this is to adopt empirical methods in the menu design phase, by requesting a number of intended final users
to provide their ideal tasks arrangements. However, to improve the effectiveness of this approach, it is
necessary to filter results, by identifying and discarding data coming from subjects whose mental models are
too weak on the considered domain. To this aim, in the paper, we propose a formal tool suited to support
menu designers, which is based on a fuzzy-based distance we defined. This measure can be easily calculated
on the empirical datasets, thanks to a specifically conceived supporting application we developed. As a
result, by exploiting the proposed solution, menu designers can rely on a formal tool to evaluate significance
of empirical data, thus leading towards more effective menu clustering.
1 INTRODUCTION
In the literature it is widely proved that an intuitive
menu organization, corresponding to user’s
expectations, can lead to many benefits, since it
improves the overall usability of the system (for
instance (Norman, 1991), or (Schneiderman, 1998)).
Moreover, in some domains, menu intuitiveness can
eventually affect safety of human beings. For
instance, in automotive info-telematics systems the
end-user is normally busy in the mission-critical task
of driving, and menu clustering has deep impact on
the safety, since it influences the amount of time the
driver spends with glances out of the road, searching
for a specific system feature (Di Martino, 2005).
The effectiveness of a menu-based system is
strongly dependent on the organization of its items,
which should both be congruent to the operator’s
mental organization of the task domain, both closely
match his/her conceptual relationships between
system features (Wickens, 1984). This is particularly
true for ubiquitous information systems, such as cell
phones, MP3 players, automotive information
systems, etc… where very often the point-and-click
paradigm cannot be applied, and the interaction is
achieved exclusively by means of menus. For
standard desktop applications, the menu design is a
widely covered issue by the literature, where it is
possible to find lots of guidelines and different
approaches, such as (Sears and Shneiderman, 1994).
Many menu organizations have been suggested in
literature, such as alphabetical, categorical, or
frequency-based (Norman, 1991). In particular, the
frequency-based sorting is achieved by placing the
most frequently used item at the top of the menu,
and it turns out to be very adequate (other than
widely adopted) for the previously described mobile
systems. In fact, it allows users for a faster selection
of frequently used features, with an overall reduction
of interaction efforts. To apply this approach, User
Interface (UI) designers must own knowledge about
the selection frequencies of the considered tasks.
This job is straightforward in well-established
domains, since these data are either usually available
or easily collectable by logging subjects’
interactions in pilot experiments. But when dealing
with novel application domains, these data are often
not available. Thus, since it is not possible to rely
only on domain experts knowledge (Toms et al.,
2001), there is the necessity to gain data from
empirical methods, involving external subjects to
capture the diverse organizational structures that
exist within the user population (Shneiderman,
1998). This is especially true when the intended user
population is highly diverse on factors such as age,
system expertise, and technical background, which
is a common case for mobile systems (Toms et al.,
2001). About the empirical approaches, many
researches in the literature suggest to analyze data
with methods such as the Cluster Analysis
Technique or Multi-dimensional Scaling. However,
their applicability to dual task environments, such as
59
Coppola C., Costagliola G., Di Martino S., Ferrucci F. and Pacelli T. (2006).
A FUZZY-BASED DISTANCE TO IMPROVE EMPIRICAL METHODS FOR MENU CLUSTERING.
In Proceedings of the Eighth International Conference on Enterprise Information Systems - HCI, pages 59-64
DOI: 10.5220/0002466800590064
Copyright
c
SciTePress

the ubiquitous ones, is not clear (Toms et al., 2001).
Indeed, we adopted the cluster analysis technique in
the context of automotive info-telematics systems,
but the data we gathered leaded us to initial
inaccurate results. In particular, we recruited a set of
14 intended end-users to define a meaningful menu
arrangement for the navigator, phone, SMS and
entertainment sections of a next-generation
telematics system. We noticed that some subjects do
not own a significant mental model on the specific
features, thus distorting the results in the gathered
empirical data.
Starting from this experience, we felt the need
for a formal tool able to support the menu designer
in identifying the outliers, i.e. the subjects with a
mental model too weak for significant results in
these experiments. To address this issue, in this
paper we introduce a notion of distance, to measure
how far is the mental model of a subject with respect
of all others, when dealing with frequency-based
menu organizations. In particular, we propose a
“fuzzy-based” distance function, aimed at measuring
the closeness between different arrangements of
menu items proposed by the subjects. This measure
allows menu designers to define a threshold to
clearly identify the outliers. The threshold can be
easily calculated by using a tool (freely
downloadable) we developed, which is able to
highlight subjects’ data too far from the others. So,
the defined distance allows menu designers to filter
empirical data on the basis of a formal tool rather
than on his/her sensibility, which can be highly
subjective. Thus, higher quality and repeatable
results can be obtained from the datasets, leading
towards menu clustering less biased by outliers.
The remainder of the paper is structured as
follows. In section 2 we describe the experiment we
conducted, and the related contrasting results, which
motivated us in working for the definition of a
distance. In section 3 we present the fuzzy-based
distance function, and how to calculate it, while in
section 4 we report on the application of this
distance on our dataset, also by exploiting a tool we
specifically developed to assist menu designer.
Finally, a discussion on final remarks and future
work will conclude the paper.
2 THE EXPERIMENT
In 2004 we were involved in the definition of the UI
for a next-generation automotive telematics system,
together with the research centre of a well-known
automotive car manufacturer. We had about 90
system features to arrange within menus.
Accordingly to the standard literature guidelines (for
instance (Lee, MacGregor, 1985)) we adopted the
following methodology to arrange these items:
1. cluster together items sharing some inherent
relationships, and
2. within each cluster, sort items basing on
selection frequency, placing most frequently
used on top of hierarchy.
Since we were dealing with many novel features,
such as remote diagnosis, or interaction with PAN
wireless devices, we had no previous data about
their frequency of use. To define an organizational
menu structure reflecting a “typical” end-user
mental model, many previous researches (such as
(Toms et al., 2001)) suggest to use empirical
methods involving a number of intended users,
external from the development team. Following
these suggestions, we recruited for the experiment a
total of 14 participants, 9 males and 5 females. Their
age ranged form 23 to 59, with a mean of 31. To
gain insight about their backgrounds, we collected
information about their experiences on Personal
Computers, Cell Phones, Car Stereo and Mobile
Navigators. Moreover, we asked subjects if they
own a Car Stereo and/or a Car Navigator. The
results were that all subjects but one reported to be
familiar with personal computers and phone cells.
All the 14 subjects stated to have experience with a
car stereo, and only three of them do not own it.
Finally, 8 subjects reported some previous
experiences with car navigators, and only 3 have a
telematics system in their vehicles. Thus, almost half
of the samples does not have familiarity with
advanced automotive infotainment applications.
The stimuli for the analysis consisted of 90 strips
of paper (8 x 2.5 cm), each of them with a system
feature description, corresponding to a generic task
that one might perform when using a next generation
telematics system. Slips were subdivided according
to six modules of the system, namely the Navigator,
Audio – OFF, Audio – Tuner, Audio – CD Changer,
Cell Phone and Short Message System (SMS).
Obviously, careful consideration was given
wording of each task description, to allow subjects
to base their assessments more on the semantic
rather than the syntactic attributes of the task. Some
examples of these strips are provided in Table 1.
Each strip was accompanied by a number (not
shown to subjects), used by the team for task
identification. Subjects were asked to:
1. Sort slips, placing at the top positions the
feature they suppose to be the most frequently
selected, according to their mental model.
2. Arrange slips into stacks of related functions,
based on their own criteria for similarity. They
could make as many separate stacks as they
cared to, as long as each stack contained at most
four task items.
ICEIS 2006 - HUMAN-COMPUTER INTERACTION
60
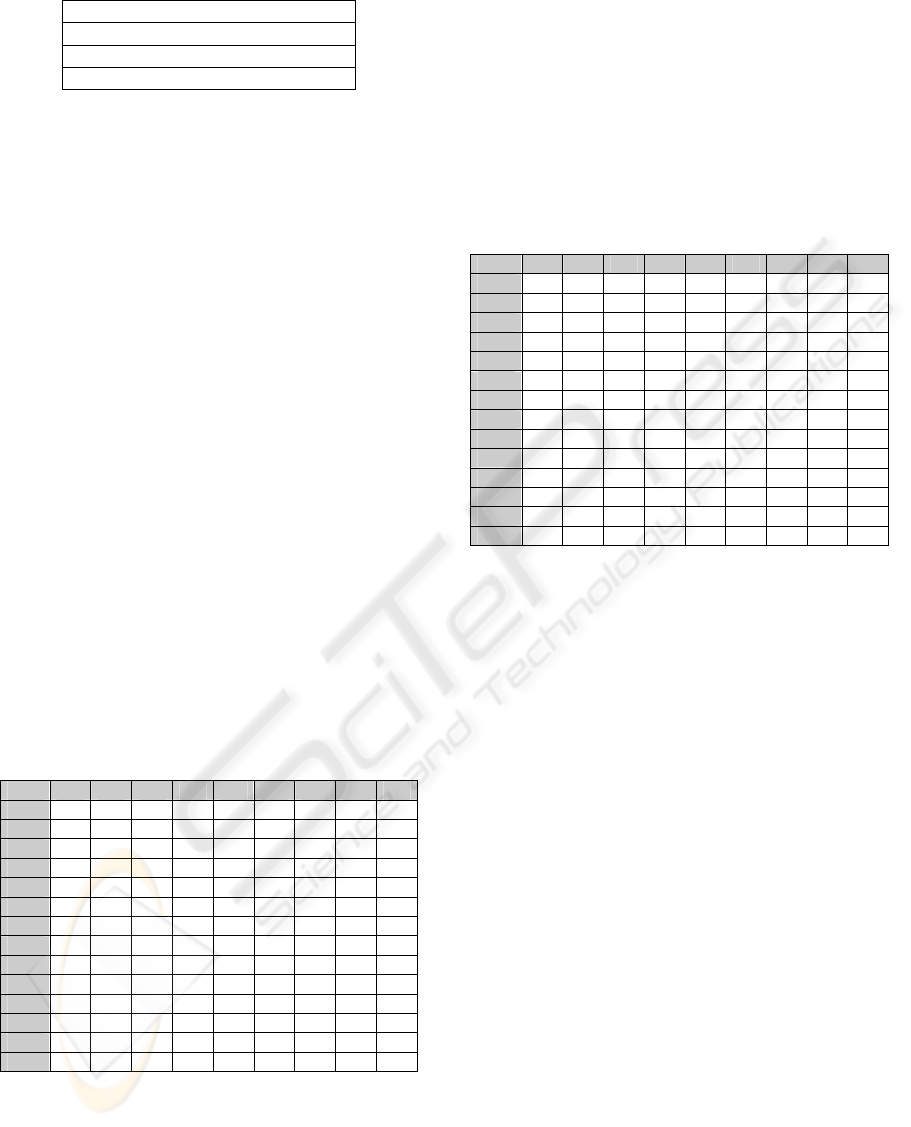
Table 1: Some examples of task descriptions.
Activate Remote Diagnosis
Play a specific track of the CD
Write a SMS
Insert a Destination in the navigator
In the remainder of the paper, we will use
indifferently the terms permutation, arrangement,
list and sequence, to refer to the ordered list of menu
items produced by a subject in step 1, to represent
his/her mental model of selection frequency.
In order to obtain the tree-like structure of menu
items (named also dendritic representations, or
dendograms), we adopted the Agglomerative
Clustering Procedure (Toms et al., 2001), starting
from a situation in which every item is in its own
cluster and then, in succeeding steps, merging the
closest clusters on the basis of their similarity.
Within each of these clusters, items are sorted
consequently to the sequences proposed by subjects.
In particular, the final permutation is obtained by
applying the statistical mode function on all the
gathered lists.
2.1 Results
Some of the empirical data we gained from subjects
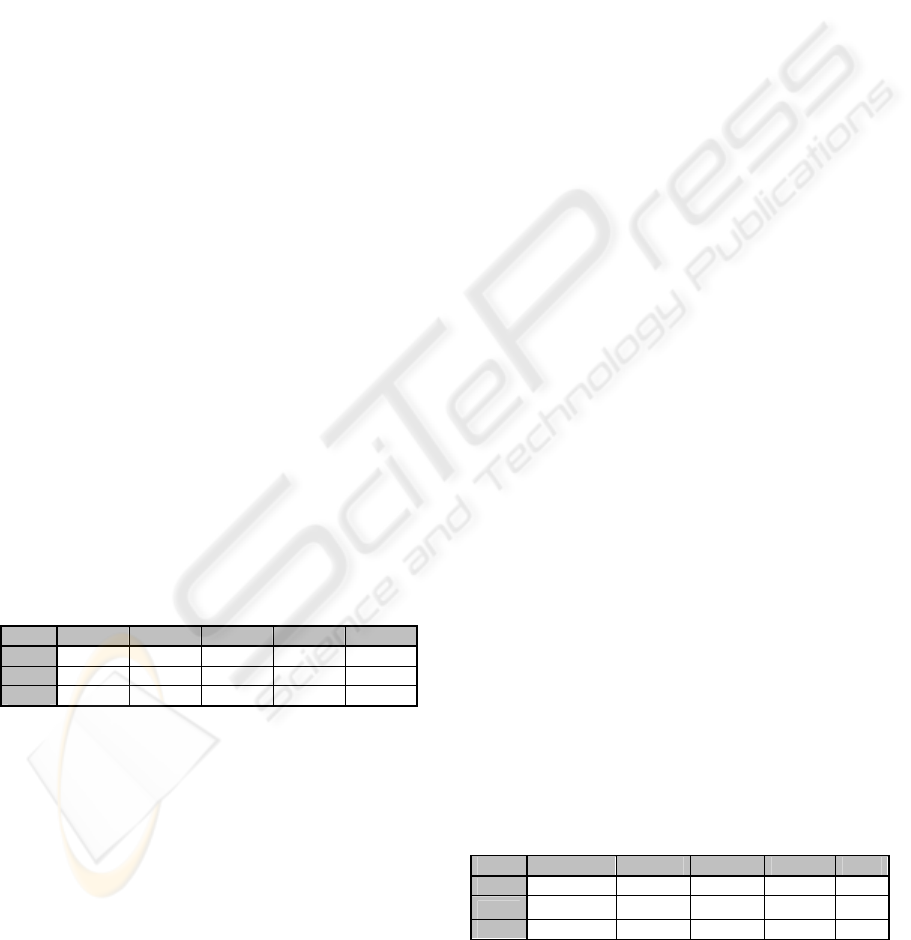
are shown in Table 2 (results for the SMS module)
and Table 3 (results for the navigator module). The
strings S1...S14 in first column identify the
considered subjects, while the numbers on the table
headers represent the positions in the items sorting.
The digits in table cells represent the numbers used
for the identification of each menu item, ordered by
the subject’s supposed frequency of usage.
Table 2: Gathered data about SMS.
1 2 3 4 5 6 7 8
S1 79 80 81 77 86 82 78 83 …
S2 83 79 90 86 80 88 89 81 …
S3 83 80 78 87 79 77 90 82 …
S4 83 87 79 88 78 80 77 89 …
S5 83 80 82 79 87 77 78 90 …
S6 83 80 87 78 82 79 88 90 …
S7 83 80 79 82 87 77 88 78 …
S8 83 82 90 87 79 80 84 86 …
S9 80 83 87 79 78 90 82 88 …
S10 83 80 79 87 78 88 82 86 …
S11 77 80 83 78 86 87 82 79 …
S12 83 80 78 89 77 87 88 79 …
S13 83 80 78 87 79 82 90 77 …
S14 83 78 80 87 90 82 88 79 …
For instance, in Table 2 the number 79 in
position 1 for the subject S1 means that subject S1
expects that feature n° 79 might be his/her most
frequently used one, the 80 the second one, and so
on.
By analyzing these data, we can gain insight on
the subjects’ mental models, depending on the
different domains. In particular, we found that for
well-established applications, such as Cell-Phone or
SMS, subjects have comparable conceptual
organizations. Indeed, let us observe that items in
Table 2 were arranged by the various subjects in a
very similar fashion. For instance, notice that
features numbered 83 and 80 were placed at the
beginning of the lists by almost all the subjects,
since they suppose these features might be the most
frequently used. Similarly, functions 79 and 87
appeared frequently in the 3
rd
and/or in the 4
th
positions, and so on.
Table 3: Gathered data about NAV.
1 2 3 4 5 6 7 8
S1 9 6 8 1 17 16 13 7 …
S2 5 4 10 1 16 17 11 12 …
S3 16 11 17 4 10 14 15 13 …
S4 3 11 16 4 12 13 14 15 …
S5 12 11 17 16 4 13 2 8 …
S6 14 15 13 17 4 16 10 2 …
S7 11 16 8 10 2 17 4 13 …
S8 11 16 2 8 17 10 4 15 …
S9 4 12 13 15 14 11 17 1 …
S10 4 13 2 17 12 11 16 10 …
S11 4 6 15 17 1 7 2 14 …
S12 4 13 12 2 14 10 16 6 …
S13 17 1 3 14 15 12 16 11 …
S14 17 14 4 3 1 15 12 7 …
On the other hand, when dealing with novel
services, such as the services provided by a next-
generation navigator, user’s mental models and
conceptual relationships between menu items are
dissimilar, even when they received detailed task
explanations prior to the test. By looking at items in
Table 3, it is more difficult to find similarities in the
arrangements proposed by the different subjects.
Moreover, some subjects, such as S1 and S2,
provided arrangements very far from the others,
biasing the result of the mode and aggregative
procedures. It is worth pointing out that these
outliers are far from trivial to perceive, especially in
large datasets, limiting the meaningfulness of the
empirical data.
In order to provide UI designers with a formal
tool to identify subjects that can disrupt the validity
of the collected data, we are going to define, in the
next section, a specific “distance” among subjects’
arrangements, satisfying several peculiarities related
to the problem we are dealing with.
3 AN EVALUATION FUNCTION
We are interested in “measuring” the “distances”
between the collected permutations, i.e. to
understand if a sequence is on the average very
different from the others, implying that the
corresponding subject cannot be considered
affordable for that specific domain.
A FUZZY-BASED DISTANCE TO IMPROVE EMPIRICAL METHODS FOR MENU CLUSTERING
61
In order to define this measure, we have to
clarify which relations among the elements in these
permutations have to be considered relevant. When
dealing with binary strings, the Hamming distance is
the most natural and utilized one. Instead, for
general permutations, in the literature there are many
different interpretations of distance, according to the
kind of problem they represent (Moraglio et al.,
2004). For example, in some domains, the relevant
information is the adjacency relation among the
elements of a permutation; in others, the most
significant factor is the position in which the
elements of a permutation lie; in further contexts,
permutations provide priority lists, and so the
relevant information is the order of the elements of
the permutations. An interesting survey of metrics
on permutations is provided by (Huang, 1997). But,
at best of our knowledge, none of the above
described interpretations fits well our problem.
3.1 The Underlying Approach
In our case, we have to give prominence to two
factors:
1. the relative positions of the items in the same
permutation, and
2. the distance between the position of an item
in the i
th
permutation and the position of the
same item in the j
th
one.
To clarify factor 1, let us recall that, in
frequency-based menu organization, we are mainly
interested in the items placed at the top of the
sequence, which should be the most frequently used.
For example, let us consider the following
sequences:
Table 4: Example 1.
1 2 … n-1 n
S1 A … … … …
S2 … … A … …
S3 … … … … A
In agreement with the selection-frequency
approach, the sequences provided by S1 and S2 are
semantically much more “far” than the two
sequences provided by S2 and S3, since the foremost
positions in the menu, corresponding to the mostly
used tasks, are much more relevant than the
outermost ones. Factor 2 concerns the comparison of
the positions where the same items are placed in the
different permutations. Thus, in order to define a
suitable distance between the permutations, we
combine, in a single formula, the following aspects:
– to make the foremost menu positions more
relevant, we assign them weights, between 1 and
0, in a decreasing and non-linear way;
– to satisfy factor 2, we define a distance reporting
the number of steps needed to go from the
position of an item in a permutation, to the
position of the same item in the other
permutation we are examining;
– finally, in order to normalize the distance
function to take values between 0 and 1,
independently from the length of permutations,
we multiply the result by a suitable factor. This
allows us to compare sequences of different
subsystems, independently of the number of
menu items.
In the following we will describe these steps in a
more formal way.
3.2 Weight and Distance Functions
To satisfy the requirement that the foremost
positions have much more importance than the
others, we consider the monotone decreasing
function rel from the set of the positions P={1,…,N}
to the interval [0,1]:
rel: k ∈ P → 1/k ∈ [0, 1]. (1)
This function is a fuzzy subset (Zadeh, 1965) and we
interpret the membership degree rel(k) of the
element k as the “degree of relevancy” of the
position k; we call rel the fuzzy subset of relevant
positions. The function rel is suitable for our
situation because it well represents the decreasing
importance of the positions, in a non-linear trend.
In order to compare the positions corresponding
to equal items in different permutations, we consider
a distance between the position of an item in a
sequence and the position of the same item in
another sequence. Given an item, we denote by d
this distance and we define it, as
d(k, h) = |k -h| (2)
for every k, h ∈ P, where | | denotes the absolute
value. In other words, the value d(k, h) indicates
how many steps we have to do from the position k of
an item in a permutation, to the position h, in which
the same item is placed in the other permutation we
are examining. Let us observe that, since we have a
set of N positions, the maximum possible distance
between two positions is N-1.
To clarify these concepts, let us consider the
following example of a dataset:
Table 5: Example 2.
1 2 … 9 10
Si A B … C D
… … … … … …
Sj B C … A D
We have a set of 10 items A, B,… to be arranged
by subjects Si .. Sj. If we consider the item A, we
observe that it is in position 1 in the sequence
arranged by subject
Si and in position 9 in the
ICEIS 2006 - HUMAN-COMPUTER INTERACTION
62

sequence arranged by subject Sj
.
So we can evaluate
the distance between these two permutations for the
item A as d(1, 9) = |1-9|.
Now we have to combine the considered
functions, in order to give a suitable expression for
the distance between permutations.
3.3 The Resulting Fuzzy-based
Distance
Before proceeding, let us introduce some notations.
Let us suppose that each module of the system for
which we are defining the menu clustering has N
menu items. We denote by I this set. The i
th
subject
arranges the items in a particular sequence, which
can be viewed as a function from the set of the
positions P={1,…, N}, to the set of the items I:
s
i
: k∈{1,…N}→ s
i
(k) ∈ I. (3)
In other words, we identify the permutation
produced by the subject Si with the function s
i
.
By s
i
(k) we indicate the item placed in the k
th
position by the i
th
subject. Let us underline that,
since s
i
is bijective, we can always consider the
inverse image of an item s
i
(k). In this case, we have
that s
i
-1
(s
i
(k)) gives the position k in which the item
s
i
(k) is placed in the i
th
sequence.
In the example we are considering (Table 4),
s
i
(1) = A and s
i
-1
(s
i
(9))=s
i
-1
(C) = 9.
Let us remark that we can move from the i
th
permutation to the j
th
one simply by the composition
of s
j
and the inverse of s
i
. More precisely, s
i
-1
(s
j
(k))
furnishes the position in the i
th
sequence of the item
s
j
(k), which is placed in the position k in the j
th
sequence.
Now we can define, for every pair of
permutations (s
i
, s
j
), the distance
D(s
i
, s
j
) =
()
∑
=
−
N
k
krelN
1
)(12
1
∑
=
N
k 1
rel(k) [d(k, s
j
-1
(s
i
(k))
) +
+d (k, s
i
-1
(s
j
(k))
)]. (4)
Let us also observe that in this expression, we
consider both the distance d (k, s
j
-1
(s
i
(k))
) between
the positions k and s
j
-1
(s
i
(k)) of the same item in the
sequence s
i
and in the sequence s
j
, respectively, and
the distance d (k, s
i
-1
(s
j
(k))
) between the positions k
and s
i
-1
(s
j
(k)) of the same item in the sequence s
j
and
in the sequence s
i
, respectively. Then, in order to
make symmetric the distance D, we sum these two
distances. As an example, in calculating the distance
between s
i
and s
j
in Table 4, for the position 1, first
we consider the distance d(1, 9) = |1-9|. Then, since
s
j
(1) = B, and B lies in the position 2 in the sequence
s
i
, we consider also the distance d(1, 2) = |1-2|.
Let us stress that if an item is fixed, i.e. if it lies
in the same position k in both the permutations we
are comparing, the k
th
term in the sum vanishes,
obviously. So D results reflexive, trivially.
Then we multiply each term of the sum of the
distances d by the degree of relevancy of the
position we are examining.
Finally, in order to normalize on the length of
permutations, we multiply the result of the total sum
by the factor
()
∑
=
−
N
k
krelN
1
)(12
1
. So the distance
takes always values between 0 and 1, obtaining just
0 for equal sequences. In this way we can compare
sequences, independently of their length.
Again referring to the simple example of Table
4, let us evaluate the final distance D between the
two sequences s
i
, and s
j
. We have to repeat for every
position each step we examined and then to sum all
the results. Finally we have to multiply by the factor
∑
=
10
1
1
1
*
9*2
1
k
k
to normalize. At the end, we have
D(s
i
, s
j
)=
93.2
1
*
9*2
1
[1(|1 - 9| + |1 - 2| ) +
2
1
(|2 - 1| +
|2 - 9|) + … +
9
1
(|9 - 2|+ |9 - 1|) +
10
1
(|10 - 10| +
|10 - 10| )]. (5)
4 APPLYING THE FORMULA
In order to identify the outliers, the designer needs to
calculate, for each permutation, its distance on the
average from all the other ones. Then, (s)he may
choose a threshold, depending on the considered
context, to filter data. An example applied on our
data is provided in the following. We applied the
proposed distance on the data gathered by the
empirical studies described in Section 2. In Table 6
we provide the mean distances among the
permutations. As expected, it resulted that for well
known domains, such as the SMS or the CD
modules, the permutations provided by the different
subjects were very close (mean 0.286 and 0.237
respectively). On the other hand, the mean distance
for the navigator is 0.446, which is almost the
double of the other modules. Moreover, the distance
allowed us to discern the outlier subjects. For
instance, we choose a threshold value of 0.3 for
Audio and SMS modules and 0.5 for the navigator
one. Consequently subjects s1 and s2 were discarded
both for NAV and SMS data, having high mean
distances. S11 was not considered for the SMS,
A FUZZY-BASED DISTANCE TO IMPROVE EMPIRICAL METHODS FOR MENU CLUSTERING
63
while S4 and S13 were discarded in the Audio
module.
Table 6: Results on the gathered data.
Audio - CD SMS NAV
S1 0.4 0.446 0.623
S2 0.226 0.322 0.525
S3 0.220 0.169 0.370
S4 0.336 0.256 0.479
S5 0.219 0.177 0.419
S6 0.223 0.179 0.419
S7 0.219 0.172 0.433
S8 0.234 0.279 0.431
S9 0.208 0.204 0.394
S10 0.263 0.182 0.384
S11 0.250 0.325 0.444
S12 0.234 0.224 0.417
S13 0.751 0.167 0.477
S14 0.225 0.211 0.427
Mean 0.286 0.237 0.446
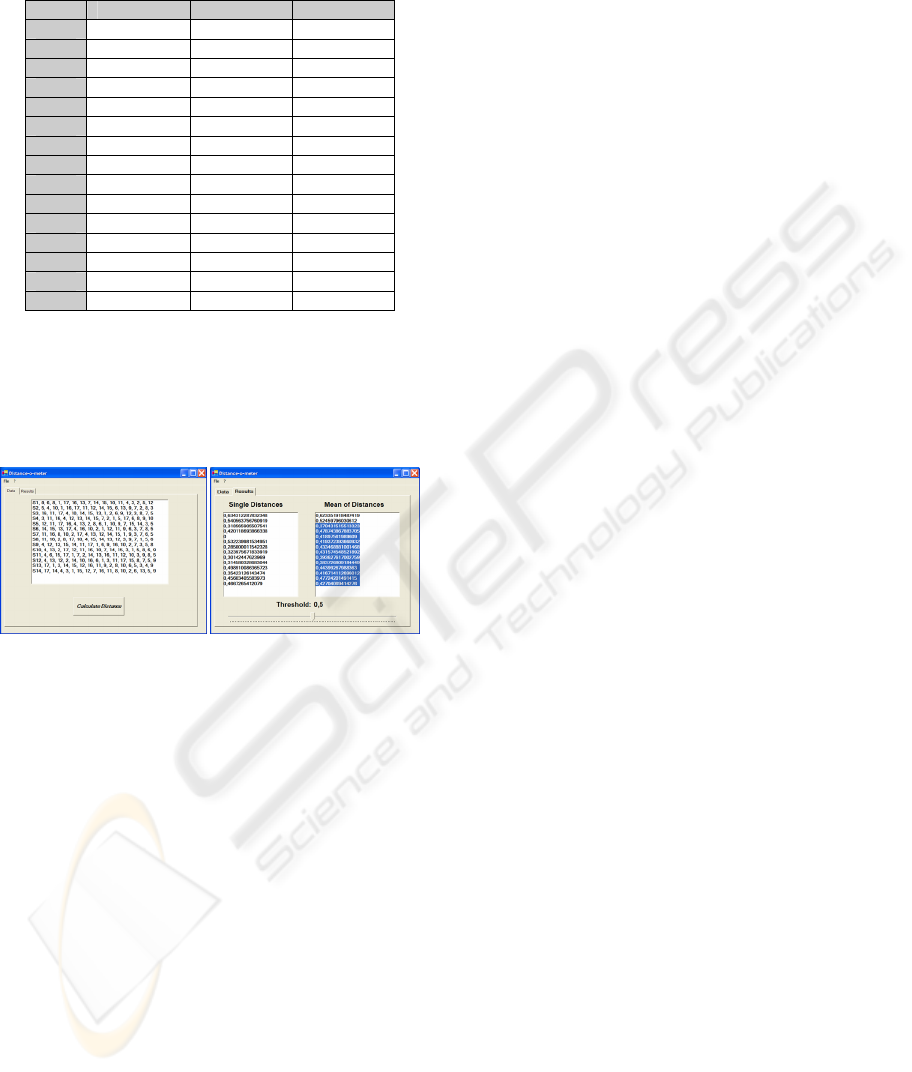
4.1 A Supporting Tool
To simplify the evaluation of these distances, we
developed a specific tool, named Distance-o-Meter,
quite trivial to use.
Figure 1: A screenshot of the developed tool.
Starting from a CSV file, storing the dataset of
the permutation, the designer can either calculate the
distance of a specific subject from all others, or let
the tool calculate all the distances among subjects.
Moreover, it allows the designer to specify a limit to
filter subjects, which can be easily adjusted through
a slider. Figure
1 shows the tool’s UI (left) and how
the tool highlights the subjects within the threshold
of 0.5 (right). The tool can be freely downloaded at
http://193.205.186.31/DataAnalysis.
5 CONCLUSIONS AND FUTURE
WORK
To define a significant menu clustering it is a
common practice to involve a number of final users
in the menu design process. However, in novel
application domains this approach can sometimes
provide imprecise results if some subjects have weak
mental models about the considered tasks. In this
paper we presented a formal tool to support the
menu designers in identifying the validity of
subjects’ conceptual models. To address this issue,
we defined a “fuzzy-based” distance function
between the different arrangements of the tasks,
empirically produced by the different subjects. In
particular, since we are considering a frequency-
based menu organization, the proposed distance
takes into account the fact that the foremost
positions in an arrangement are more “important”
than the others. Indeed, we used a function that
assigns a decreasing “relevance” to the positions in
an arrangement.
Thanks to this defined measure, a UI designer
can compare the different menu items arrangements
provided by the subjects. If a distance is over a
selected threshold, then the relative subject can be
considered an outlier. Such a filtering can be easily
calculated by using a tool (freely downloadable) we
developed, which is able to analyze a dataset
containing subjects’ answers, and to highlight
abnormal situations.
We successfully applied this distance to discern
significant subjects’ trials when defining a next-
generation automotive telematics system. About
future work, we are currently devoting efforts at
defining a distance on the dendograms obtained by
agglomerative psychological clustering procedures.
REFERENCES
Di Martino S., Multimodal Automotive Telematics
Systems: Design and Evaluation. PhD Thesis.
University of Salerno, Italy, 2005.
Huang T., Deza M.,. Metrics on Permutations, a Survey,
Journal of Combinatorics, Information and System
Sciences, Vol. 23, Nos. 1-4, 1 Pages 73-185, NSC85-
2121-M009-012, 1998.
Lee, E. and MacGregor, J. Minimizing user search time in
menu retrieval systems, Human Factors, 27, 1985.
Moraglio A., Poli R. Topological Crossover for the
Permutation Representation, Technical Report CSM-
408, University of Essex, 2004.
Norman, K. The Psychology of Menu Selection. Norwood,
New Jersey, Ablex Publishing Corporation. 1991.
Shneiderman B. Designing the User Interfaces, Addison
Wesley, 1998.
Sears A., Shneiderman B., Split Menus: Effectively Using
Selection Frequency to Organize Menus, ACM
Transactions on Computer-Human Interaction, Vol. 1,
No. 1, March 1994, Pages 27-51.
Toms M., Cummings-Hill M., Curry D. Cone S. Using
Cluster Analysis for Deriving Menu Structures for
Automotive Mobile Multimedia Applications. In
Human Factors in Automotive Design, 2001
Wickens, C.D. Engineering Psychology and Human
Performance, Columbus, Ohio, Charles E. Merrill
Publishing Company, 1984.
Zadeh L.A. Fuzzy sets, Information Control n° 8, Pages
338-353, 1965.
ICEIS 2006 - HUMAN-COMPUTER INTERACTION
64
